Westmorland and Lonsdale (UK Parliament constituency)
Westmorland and Lonsdale is a constituency[n 1] in the south of Cumbria, represented in the House of Commons of the UK Parliament since 2005 by Tim Farron, the former leader of the Liberal Democrats (2015–2017).
| Westmorland and Lonsdale | |
|---|---|
| County constituency for the House of Commons | |
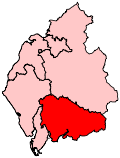 Boundary of Westmorland and Lonsdale in Cumbria | |
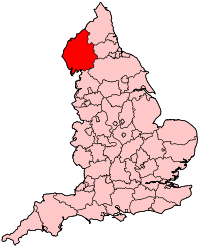 Location of Cumbria within England | |
| County | Cumbria |
| Electorate | 66,609 (December 2010)[1] |
| Major settlements | Grange-over-Sands, Kendal |
| Current constituency | |
| Created | 1983 |
| Member of Parliament | Tim Farron (Liberal Democrats) |
| Number of members | One |
| Created from | Morecambe and Lonsdale and Westmorland |
Boundaries
The constituency is similar in extent to the South Lakeland district of Cumbria. Important towns by size in the constituency include Kendal, Windermere and Kirkby Lonsdale. It is named for the historic county of Westmorland and the Lancashire Hundred of Lonsdale, both of which extend beyond the bounds of the constituency.
Boundary review
Following their review of parliamentary representation in Cumbria, the Boundary Commission for England created a modified Westmorland and Lonsdale constituency, to deal with population changes.
The electoral wards used to create the modified seat, contested for the first time at the 2010 general election, are entirely within the South Lakeland district.
- Arnside and Beetham, Burneside, Burton and Holme, Cartmel, Coniston, Crooklands, Grange, Hawkshead, Holker, Kendal Castle, Kendal Far Cross, Kendal Fell, Kendal Glebelands, Kendal Heron Hill, Kendal Highgate, Kendal Kirkland, Kendal Mintsfeet, Kendal Nether, Kendal Oxenholme, Kendal Parks, Kendal Stonecross, Kendal Strickland, Kendal Underley, Kirkby Lonsdale, Lakes Ambleside, Lakes Grasmere, Levens, Lyth Valley, Milnthorpe, Natland, Sedbergh, Staveley-in-Cartmel, Staveley-in-Westmorland, Whinfell, Windermere Applethwaite, Windermere Bowness North, Windermere Bowness South and Windermere Town[2]
This removed Broughton-in-Furness from the constituency.
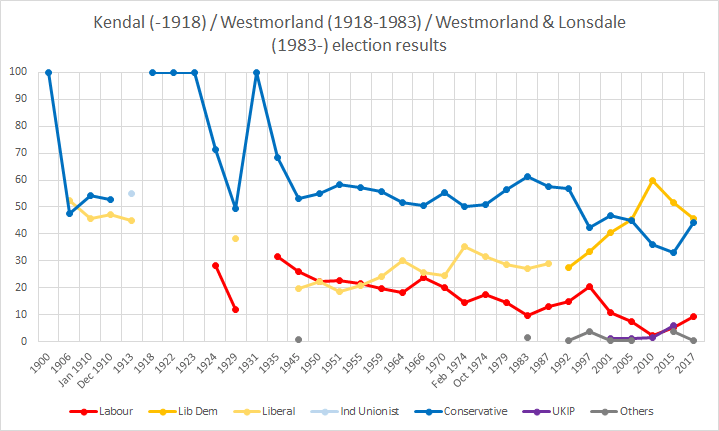
History
Having been a Conservative-dominated seat since its creation in 1983, the 1997 general election saw the Conservatives' majority cut to fewer than 5,000 votes. This was further reduced at the 2001 general election. In 2005, the constituency featured among a list of seats held by high-profile Conservatives (in this case, Shadow Education minister Tim Collins) targeted by the Liberal Democrats by deploying supporters from across each region in what was referred in the media as a "decapitation strategy".[3] Westmorland and Lonsdale was the single shadow ministerial loss at the following election — Tim Farron gained the seat by a marginal majority of 267 votes.
At the 2010 general election, the local electorate caused the largest (Conservative-to-Liberal Democrat) swing nationally, of 11.1% — equally the lowest share of the vote for Labour (2.2%, one of five lost deposits for Labour), nationally. With 96.2% of votes cast for either the Conservative or Liberal Democrat candidates, Westmorland and Lonsdale had the highest combined share of the vote cast for the Coalition parties.
Contrasting with its long-term Conservative support, the combined Conservative/UKIP vote narrowly failed to reach 40% in 2015. Equally, Farron, who would become Leader of the Liberal Democrats two months later; was the only member of his party to secure an absolute majority (over 50%) of votes cast, after what was a poor result for the party nationwide with their seat count reduced from 57 seats to 8.[4][5]
Members of Parliament
| Election | Member[6] | Party | |
|---|---|---|---|
| 1983 | Michael Jopling | Conservative | |
| 1997 | Tim Collins | Conservative | |
| 2005 | Tim Farron | Liberal Democrat | |
Elections
Elections in the 2010s
In 2019, Westmorland & Lonsdale was one of three English constituencies, the others being Esher and Walton and Cheltenham where Labour failed to obtain over 5% of the vote and lost their deposit.[7]
| Party | Candidate | Votes | % | ± | |
|---|---|---|---|---|---|
| Liberal Democrats | Tim Farron | 25,795 | 48.9 | ||
| Conservative | James Airey | 23,861 | 45.3 | ||
| Labour | Phillip Black | 2,293 | 4.4 | ||
| Brexit Party | Steven Bolton | 763 | 1.4 | ||
| Majority | 1,934 | 3.6 | |||
| Turnout | 52,712 | 77.8 | |||
| Liberal Democrats hold | Swing | ||||
| Party | Candidate | Votes | % | ± | |
|---|---|---|---|---|---|
| Liberal Democrats | Tim Farron | 23,686 | 45.8 | ||
| Conservative | James Airey | 22,909 | 44.3 | ||
| Labour | Eli Aldridge | 4,783 | 9.3 | ||
| Independent | Mr Fishfinger | 309 | 0.6 | ||
| Majority | 777 | 1.5 | |||
| Turnout | 51,687 | 77.9 | |||
| Liberal Democrats hold | Swing | ||||
| Party | Candidate | Votes | % | ± | |
|---|---|---|---|---|---|
| Liberal Democrats | Tim Farron | 25,194 | 51.5 | −8.5 | |
| Conservative | Ann Myatt | 16,245 | 33.2 | −3.0 | |
| UKIP | Alan Piper | 3,031 | 6.2 | +4.6 | |
| Labour | John Bateson | 2,661 | 5.4 | +3.2 | |
| Green | Chris Loynes | 1,798 | 3.7 | New | |
| Majority | 8,949 | 18.3 | -5.5 | ||
| Turnout | 48,929 | 74.3 | −1.5 | ||
| Liberal Democrats hold | Swing | −2.8 | |||
| Party | Candidate | Votes | % | ± | |
|---|---|---|---|---|---|
| Liberal Democrats | Tim Farron | 30,896 | 60.0 | +14.1 | |
| Conservative | Gareth McKeever | 18,632 | 36.2 | -8.7 | |
| Labour | Jonathan Todd | 1,158 | 2.2 | −5.6 | |
| UKIP | John Mander | 801 | 1.6 | +0.2 | |
| Majority | 12,264 | 23.8 | +23.3 | ||
| Turnout | 51,487 | 75.8 | +5.1 | ||
| Liberal Democrats hold | Swing | +11.1 | |||
Elections in the 2000s
| Party | Candidate | Votes | % | ± | |
|---|---|---|---|---|---|
| Liberal Democrats | Tim Farron | 22,569 | 45.5 | +5.1 | |
| Conservative | Tim Collins | 22,302 | 44.9 | −2.0 | |
| Labour | John Reardon | 3,796 | 7.6 | −3.3 | |
| UKIP | Robert Gibson | 660 | 1.3 | +0.1 | |
| Independent | Anthony Kemp | 309 | 0.6 | N/A | |
| Majority | 267 | 0.6 | -5.9 | ||
| Turnout | 49,636 | 71.6 | +3.8 | ||
| Liberal Democrats gain from Conservative | Swing | +3.5 | |||
| Party | Candidate | Votes | % | ± | |
|---|---|---|---|---|---|
| Conservative | Tim Collins | 22,486 | 46.9 | +4.7 | |
| Liberal Democrats | Tim Farron | 19,339 | 40.4 | +7.0 | |
| Labour | John Bateson | 5,234 | 10.9 | −9.7 | |
| UKIP | Robert Gibson | 552 | 1.2 | N/A | |
| Independent | Timothy Bell | 292 | 0.6 | N/A | |
| Majority | 3,147 | 6.5 | -2.5 | ||
| Turnout | 47,903 | 67.8 | −6.2 | ||
| Conservative hold | Swing | −1.2 | |||
Elections in the 1990s
| Party | Candidate | Votes | % | ± | |
|---|---|---|---|---|---|
| Conservative | Tim Collins | 21,463 | 42.3 | −14.6 | |
| Liberal Democrats | Stanley Collins | 16,942 | 33.4 | +5.9 | |
| Labour | John Harding | 10,452 | 20.6 | +5.5 | |
| Referendum | Michael H. Smith | 1,924 | 3.8 | N/A | |
| Majority | 4,521 | 9.0 | -20.4 | ||
| Turnout | 50,781 | 74.1 | -3.7 | ||
| Conservative hold | Swing | −10.3 | |||
| Party | Candidate | Votes | % | ± | |
|---|---|---|---|---|---|
| Conservative | Michael Jopling | 31,798 | 56.9 | −0.7 | |
| Liberal Democrats | Stanley Collins | 15,362 | 27.5 | −1.7 | |
| Labour | Dickon J. Abbott | 8,436 | 15.1 | +1.9 | |
| Natural Law | Robert Johnstone | 287 | 0.5 | N/A | |
| Majority | 16,436 | 29.4 | +1.0 | ||
| Turnout | 55,883 | 77.8 | −3.0 | ||
| Conservative hold | Swing | +0.5 | |||
Elections in the 1980s
| Party | Candidate | Votes | % | ± | |
|---|---|---|---|---|---|
| Conservative | Michael Jopling | 30,259 | 57.6 | −3.7 | |
| Liberal | Stanley Collins | 15,339 | 29.2 | +2.1 | |
| Labour | Shaun Halfpenny | 6,968 | 13.2 | +3.3 | |
| Majority | 14,920 | 28.4 | -5.8 | ||
| Turnout | 52,566 | 74.8 | +2.5 | ||
| Conservative hold | Swing | −2.9 | |||
| Party | Candidate | Votes | % | ± | |
|---|---|---|---|---|---|
| Conservative | Michael Jopling | 29,775 | 61.3 | N/A | |
| Liberal | Ken Hulls | 13,188 | 27.1 | N/A | |
| Labour | Chris Stott | 4,798 | 9.9 | N/A | |
| Ecology | Robert Gibson | 805 | 1.7 | N/A | |
| Majority | 16,587 | 34.2 | N/A | ||
| Turnout | 48,566 | 72.3 | N/A | ||
| Conservative win (new seat) | |||||
Note: The Robert Gibson who stood in this election and the similarly named candidate in 2001 and 2005 are not the same person.
Notes and references
- Notes
- A county constituency (for the purposes of election expenses and type of returning officer).
- References
- "Electorate Figures - Boundary Commission for England". 2011 Electorate Figures. Boundary Commission for England. 4 March 2011. Retrieved 13 March 2011.
- "2010 post-revision map non-metropolitan areas and unitary authorities of England" (PDF). Retrieved 2016-08-12.
- Senior Tories Avoid LibDem "decaptitation" The Evening Standard 6 May 2005
- Gosden, Emily (2015-05-09). "Liberal Democrat survivors round on Nick Clegg". ISSN 0307-1235. Retrieved 2019-08-16.
- Harris, John (2015-07-12). "The strange death of the Liberal Democrats". The Guardian. ISSN 0261-3077. Retrieved 2019-08-16.
- Leigh Rayment's Historical List of MPs – Constituencies beginning with "W" (part 3)
- https://www.bbc.com/news/election-2019-50781957
- "Statement of Persons Nominated and Notice of Poll" (PDF). southlakeland.gov.uk. South Lakeland Council. Retrieved 15 November 2019.
- "Westmorland & Lonsdale parliamentary constituency - Election 2019". Retrieved 2019-12-16.
- "UK Parliamentary election: Westmorland & Lonsdale constituency - Statement of Persons Nominated and Notice of Poll" (PDF). South Lakeland District Council. 11 May 2017. Retrieved 8 June 2017.
- "Election Data 2015". Electoral Calculus. Archived from the original on 17 October 2015. Retrieved 17 October 2015.
- "Westmorland & Lonsdale". BBC News. Retrieved 11 May 2015.
- "Election Data 2010". Electoral Calculus. Archived from the original on 17 October 2015. Retrieved 17 October 2015.
- Westmorland and Lonsdale Conservatives, Westmorland and Lonsdale Conservatives
- "Election Data 2005". Electoral Calculus. Archived from the original on 15 October 2011. Retrieved 18 October 2015.
- "Election Data 2001". Electoral Calculus. Archived from the original on 15 October 2011. Retrieved 18 October 2015.
- "Election Data 1997". Electoral Calculus. Archived from the original on 15 October 2011. Retrieved 18 October 2015.
- "Election Data 1992". Electoral Calculus. Archived from the original on 15 October 2011. Retrieved 18 October 2015.
- "UK General Election results April 1992". Richard Kimber's Political Science Resources. Politics Resources. 9 April 1992. Retrieved 2010-12-06.
- "Election Data 1987". Electoral Calculus. Archived from the original on 15 October 2011. Retrieved 18 October 2015.
- "Election Data 1983". Electoral Calculus. Archived from the original on 15 October 2011. Retrieved 18 October 2015.