Ellesmere Port and Neston (UK Parliament constituency)
Ellesmere Port and Neston is a constituency[n 1] represented in the House of Commons of the UK Parliament since 2015 by Justin Madders of the Labour Party.[n 2]
| Ellesmere Port and Neston | |
|---|---|
| County constituency for the House of Commons | |
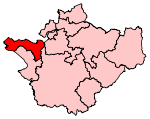 Boundary of Ellesmere Port and Neston in Cheshire | |
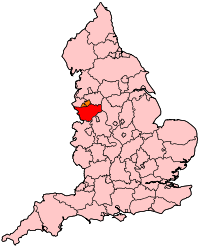 Location of Cheshire within England | |
| County | Cheshire |
| Electorate | 69,522 (2018)[1] |
| Major settlements | Ellesmere Port and Neston |
| Current constituency | |
| Created | 1983 |
| Member of Parliament | Justin Madders (Labour) |
| Number of members | One |
| Created from | Bebington and Ellesmere Port, Wirral and City of Chester[2] |
History
The constituency was formed in 1983, largely from the southern parts of the former Bebington and Ellesmere Port and Wirral constituencies. Both were former Conservative seats. Mike Woodcock of the Conservatives held the seat from the 1983 election until the 1992 election, when it was taken by Andrew Miller of the Labour Party. Miller held the seat until his retirement from the Commons in 2015, during which time it became a relatively safe Labour seat, and was succeeded by Justin Madders.[3]
Boundaries
1983–1997: The Borough of Ellesmere Port and Neston, and the City of Chester wards of Elton, Mollington, and Saughall.
1997–2010: The Borough of Ellesmere Port and Neston, and the City of Chester ward of Elton.
2010–present: The Cheshire West and Chester wards of Chester Villages, Ellesmere Port Town, Elton, Grange, Ledsham and Manor, Little Neston and Burton, Neston, Netherpool, Parkgate, Rossmore, St Paul's, Strawberry, Sutton, Whitby and Willaston and Thornton.[4]
The constituency includes the industrial town of Ellesmere Port, the smaller residential town of Neston and villages such as Burton, Parkgate, Willaston, Elton and Mickle Trafford.[5]
Members of Parliament
| Election | Member[6] | Party | |
|---|---|---|---|
| 1983 | Mike Woodcock | Conservative | |
| 1992 | Andrew Miller | Labour | |
| 2015 | Justin Madders | Labour | |
Elections
Elections in the 2010s
| Party | Candidate | Votes | % | ± | |
|---|---|---|---|---|---|
| Labour | Justin Madders | 26,001 | 53.3 | ||
| Conservative | Alison Rodwell | 17,237 | 35.4 | ||
| Liberal Democrats | Ed Gough | 2,406 | 4.9 | ||
| Brexit Party | Christopher Stevens | 2,138 | 4.4 | N/A | |
| Green | Chris Copeman | 964 | 2.0 | ||
| Majority | 8,764 | 17.9 | |||
| Turnout | 46,340 | 69.3 | |||
| Labour hold | Swing | ||||
| Party | Candidate | Votes | % | ± | |
|---|---|---|---|---|---|
| Labour | Justin Madders | 30,137 | 59.2 | ||
| Conservative | Nigel Jones | 18,747 | 36.8 | ||
| Liberal Democrats | Ed Gough | 892 | 1.8 | ||
| UKIP | Fred Fricker | 821 | 1.6 | ||
| Green | Steven Baker | 342 | 0.7 | ||
| Majority | 11,390 | 22.4 | |||
| Turnout | 50,939 | 74.2 | |||
| Labour hold | Swing | +4.5 | |||
| Party | Candidate | Votes | % | ± | |
|---|---|---|---|---|---|
| Labour | Justin Madders | 22,316 | 47.8 | +3.1 | |
| Conservative | Katherine Fletcher | 16,041 | 34.3 | −0.5 | |
| UKIP | Jonathan Starkey | 5,594 | 12.0 | +8.3 | |
| Liberal Democrats | Trish Derraugh | 1,563 | 3.3 | −11.7 | |
| Green | Michelle Palmer | 990 | 2.1 | N/A | |
| TUSC | Felicity Dowling | 192 | 0.4 | N/A | |
| Independent | John Dyer | 31 | 0.1 | N/A | |
| Majority | 6,275 | 13.4 | |||
| Turnout | 46,727 | 68.6 | |||
| Labour hold | Swing | +1.8 | |||
| Party | Candidate | Votes | % | ± | |
|---|---|---|---|---|---|
| Labour | Andrew Miller | 19,750 | 44.6 | −4.1 | |
| Conservative | Stuart Penketh | 15,419 | 34.9 | +2.1 | |
| Liberal Democrats | Denise Aspinall | 6,663 | 15.1 | −0.7 | |
| UKIP | Henry Crocker | 1,619 | 3.7 | +0.8 | |
| Independent | Jonathan Starkey | 782 | 1.8 | N/A | |
| Majority | 4,331 | 9.8 | −9.6 | ||
| Turnout | 44,233 | 70.1 | +8.8 | ||
| Labour hold | Swing | −3.1 | |||
Elections in the 2000s
| Party | Candidate | Votes | % | ± | |
|---|---|---|---|---|---|
| Labour | Andrew Miller | 20,371 | 48.4 | −6.9 | |
| Conservative | Myles Hogg | 13,885 | 33.0 | +3.9 | |
| Liberal Democrats | Steve Cooke | 6,607 | 15.7 | +4.1 | |
| UKIP | Henry Crocker | 1,206 | 2.9 | +0.9 | |
| Majority | 6,486 | 15.4 | |||
| Turnout | 42,069 | 61.6 | +0.7 | ||
| Labour hold | Swing | −5.4 | |||
| Party | Candidate | Votes | % | ± | |
|---|---|---|---|---|---|
| Labour | Andrew Miller | 22,964 | 55.3 | −4.3 | |
| Conservative | Gareth Williams | 12,103 | 29.1 | +0.1 | |
| Liberal Democrats | Stuart Kelly | 4,828 | 11.6 | +2.7 | |
| UKIP | Henry Crocker | 824 | 2.0 | N/A | |
| Green | Geoff Nicholls | 809 | 1.9 | N/A | |
| Majority | 10,861 | 26.2 | |||
| Turnout | 41,528 | 60.9 | −16.8 | ||
| Labour hold | Swing | ||||
Elections in the 1990s
| Party | Candidate | Votes | % | ± | |
|---|---|---|---|---|---|
| Labour | Andrew Miller | 31,310 | 59.6 | +13.5 | |
| Conservative | Lynn Turnbull | 15,274 | 29.1 | −13.7 | |
| Liberal Democrats | Joanna Pemberton | 4,673 | 8.9 | −1.0 | |
| Referendum | Colin S. Rodden | 1,305 | 2.5 | N/A | |
| Majority | 16,036 | 30.5 | |||
| Turnout | 52,562 | 75.8 | |||
| Labour hold | Swing | ||||
| Party | Candidate | Votes | % | ± | |
|---|---|---|---|---|---|
| Labour | Andrew Miller | 27,782 | 46.1 | +4.9 | |
| Conservative | Andrew Pearce | 25,793 | 42.8 | −1.6 | |
| Liberal Democrats | Elizabeth B. Jewkes | 5,944 | 9.9 | −4.2 | |
| Green | Mike C. Money | 589 | 1.0 | N/A | |
| Natural Law | Alan Rae | 105 | 0.2 | N/A | |
| Majority | 1,989 | 3.3 | +0.1 | ||
| Turnout | 60,213 | 84.1 | +3.1 | ||
| Labour gain from Conservative | Swing | +3.3 | |||
Elections in the 1980s
| Party | Candidate | Votes | % | ± | |
|---|---|---|---|---|---|
| Conservative | Mike Woodcock | 25,664 | 44.4 | −1.5 | |
| Labour Co-op | Helen Jones | 23,811 | 41.2 | +8.6 | |
| SDP | Simon Holbrook | 8,143 | 14.1 | −7.4 | |
| PRP | David Carson | 185 | 0.3 | N/A | |
| Majority | 1,853 | 3.2 | |||
| Turnout | 57,803 | 81.0 | |||
| Conservative hold | Swing | −5.1 | |||
| Party | Candidate | Votes | % | ± | |
|---|---|---|---|---|---|
| Conservative | Mike Woodcock | 24,371 | 45.9 | N/A | |
| Labour | Andrew Davies | 17,284 | 32.6 | N/A | |
| Liberal | Lester George | 11,413 | 21.5 | N/A | |
| Majority | 7,087 | 13.4 | N/A | ||
| Turnout | 53,068 | 75.8 | N/A | ||
| Conservative win (new seat) | |||||
Notes and references
- Notes
- A county constituency (for the purposes of election expenses and type of returning officer)
- As with all constituencies, the constituency elects one Member of Parliament (MP) by the first past the post system of election at least every five years.
- References
- "England Parliamentary electorates 2010-2018". Boundary Commission for England. Retrieved 23 March 2019.
- "'Ellesmere Port and Neston', June 1983 up to May 1997". ElectionWeb Project. Cognitive Computing Limited. Archived from the original on 12 March 2016. Retrieved 11 March 2016.
- "General Election Results from the Electoral Commission".
- Electoral Calculus https://www.electoralcalculus.co.uk/fcgi-bin/seatdetails.py?seat=Ellesmere+Port+and+Neston
- "OpenStreetMap". OpenStreetMap.
- Leigh Rayment's Historical List of MPs – Constituencies beginning with "E" (part 2)
- "Statement of Persons Nominated 2019" (PDF). Cheshire West and Chester Council. Retrieved 15 November 2019.
- "Ellesmere Port and Neston". Cheshire West and Chester Council. Retrieved 12 May 2017.
- "Election Data 2015". Electoral Calculus. Archived from the original on 17 October 2015. Retrieved 17 October 2015.
- "Ellesmere Port & Neston". BBC News. Retrieved 11 May 2015.
- "Election Data 2010". Electoral Calculus. Archived from the original on 26 July 2013. Retrieved 17 October 2015.
- "Election Data 2005". Electoral Calculus. Archived from the original on 15 October 2011. Retrieved 18 October 2015.
- "Election Data 2001". Electoral Calculus. Archived from the original on 15 October 2011. Retrieved 18 October 2015.
- "Election Data 1997". Electoral Calculus. Archived from the original on 15 October 2011. Retrieved 18 October 2015.
- "Election Data 1992". Electoral Calculus. Archived from the original on 15 October 2011. Retrieved 18 October 2015.
- "Politics Resources". Election 1992. Politics Resources. 9 April 1992. Archived from the original on 24 July 2011. Retrieved 6 December 2010.
- "Election Data 1987". Electoral Calculus. Archived from the original on 15 October 2011. Retrieved 18 October 2015.
- "Election Data 1983". Electoral Calculus. Archived from the original on 15 October 2011. Retrieved 18 October 2015.
| Authority control |
|
|---|