2018 Barnet London Borough Council election
The 2018 Barnet Council election took place on 3 May 2018 to elect members of Barnet Borough Council in England. It took place on the same day as other local elections in 2018. In the last election, the Conservatives won control of the council with 32 seats, compared to 30 for Labour and 1 for the Liberal Democrats. On 15 March 2018, following the resignation of a Conservative councillor, the council was in a state of no overall control. The election on 3 May 2018 saw the Conservatives take back overall control with a majority of 13.
| |||||||||||||||||||||||||||||||
All 63 seats to Barnet London Borough Council 32 seats needed for a majority | |||||||||||||||||||||||||||||||
|---|---|---|---|---|---|---|---|---|---|---|---|---|---|---|---|---|---|---|---|---|---|---|---|---|---|---|---|---|---|---|---|
| |||||||||||||||||||||||||||||||
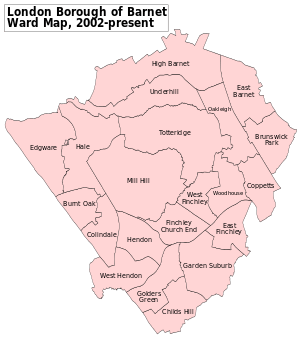
 Map of the results of the 2018 Barnet London Borough council election. Conservatives in blue and Labour in red. | |||||||||||||||||||||||||||||||
| |||||||||||||||||||||||||||||||
On 20 September 2019 Gabriel Rozenberg (elected Conservative) joined the Liberal Democrats, citing his opposition to Brexit.[1] On 2 October, he was then followed by Jess Brayne (elected Labour) who also defected to the Liberal Democrats.[2]
Background
At the last election in 2014, the Conservatives were re-elected with a reduced majority. Labour gained 9 seats from the Conservatives, but the Conservatives remained in office as a result of winning 2 seats from the Liberal Democrats in Childs Hill ward.
The Conservatives remained in control of the council with 32 seats until March 2018, when councillor Sury Khatri resigned his membership and role as party whip after being deselected as a Conservative candidate.[3] As a result, the Conservatives lost their majority on the Council, leaving them as a minority administration.
Election results
| Party | Seats | Gains | Losses | Net gain/loss | Seats % | Votes % | Votes | +/− | |
|---|---|---|---|---|---|---|---|---|---|
| Conservative | 38 | 6 | 0 | +6 | 60.3 | 44.5 | 50,340 | +5.9 | |
| Labour | 25 | 1 | 6 | -5 | 39.7 | 39.0 | 44,159 | +2.7 | |
| Liberal Democrats | 0 | 0 | 1 | -1 | 9.2 | 10,415 | +1.1 | ||
| Green | 0 | 0 | 0 | 0 | 6.3 | 7,078 | -4.6 | ||
| Independent | 0 | 0 | 0 | 0 | 0.4 | 471 | -0.9 | ||
| UKIP | 0 | 0 | 0 | 0 | 0.0 | 122 | -2.2 | ||
| Others | 0 | 0 | 0 | 0 | 0.0 | 627 | +0.4 | ||
Council Composition
Prior to the election the composition of the council was:
| 31 | 30 | 1 | 1 |
| Conservative | Labour |
After the election the composition of the council was:
| 38 | 25 |
| Conservative | Labour |
Results[5]
Brunswick Park
| Party | Candidate | Votes | % | ± | |
|---|---|---|---|---|---|
| Conservative | Roberto Weeden-Sanz | 2,586 | 46.9 | +7.6 | |
| Conservative | Lisa Rutter* | 2,517 | 45.7 | +5.9 | |
| Labour | Kathy Levine* | 2,369 | 43.0 | +2.1 | |
| Conservative | Mukesh Depala | 2,362 | 42.9 | +6.4 | |
| Labour | Andy Palmer | 2,293 | 41.6 | +0.9 | |
| Labour | Clement Magoba | 2,184 | 39.6 | +1.5 | |
| Green | David Farbey | 443 | 8.0 | -2.4 | |
| Liberal Democrats | Clareine Enderby | 321 | 5.8 | +0.1 | |
| Liberal Democrats | Michael Hughes | 263 | 4.8 | +0.2 | |
| Liberal Democrats | Roy Seger | 221 | 4.0 | +0.5 | |
| Conservative gain from Labour | Swing | ||||
| Conservative hold | Swing | ||||
| Labour hold | Swing | ||||
Burnt Oak
| Party | Candidate | Votes | % | ± | |
|---|---|---|---|---|---|
| Labour | Sara Conway | 2,440 | 63.3 | -0.5 | |
| Labour | Charlie O'Macauley* | 2,321 | 60.2 | +6.1 | |
| Labour | Ammar Naqvi* | 2,320 | 60.2 | +7.2 | |
| Conservative | Jack Oliver-Aaron | 985 | 25.6 | +4.0 | |
| Conservative | Nicole Richer | 892 | 23.1 | +2.3 | |
| Conservative | Ekaterina Dragomirova | 755 | 19.6 | +3.8 | |
| Green | Ben Samuel | 364 | 9.4 | -1.5 | |
| Liberal Democrats | Robin Marks | 253 | 6.6 | -0.4 | |
| Liberal Democrats | Millicent Watkins | 187 | 4.9 | -1.0 | |
| Liberal Democrats | Mosa Zahed | 129 | 3.3 | -0.4 | |
| Labour hold | Swing | ||||
| Labour hold | Swing | ||||
| Labour hold | Swing | ||||
Childs Hill
| Party | Candidate | Votes | % | ± | |
|---|---|---|---|---|---|
| Conservative | Shimon Ryde* | 2,262 | 39.4 | +6.6 | |
| Conservative | Peter Zinkin* | 2,243 | 39.0 | +6.4 | |
| Labour | Anne Clarke | 2,224 | 38.7 | +7.7 | |
| Conservative | Vanessa Gearson | 2,222 | 38.7 | +5.9 | |
| Labour | Lisa Pate | 2,080 | 36.2 | +6.3 | |
| Labour | Nigel Young | 1,877 | 32.7 | +3.4 | |
| Liberal Democrats | Jack Cohen* | 1,279 | 22.3 | -9.7 | |
| Liberal Democrats | Susette Palmer | 1,126 | 19.6 | -6.3 | |
| Liberal Democrats | Sachin Patel | 876 | 15.3 | -10.1 | |
| Green | Jemma Ferguson | 406 | 7.1 | -3.5 | |
| Conservative hold | Swing | ||||
| Conservative hold | Swing | ||||
| Labour gain from Liberal Democrats | Swing | ||||
Colindale
| Party | Candidate | Votes | % | ± | |
|---|---|---|---|---|---|
| Labour | Nagus Narenthira* | 3,121 | 68.8 | +0.4 | |
| Labour | Gill Sargeant* | 2,912 | 64.2 | -1.0 | |
| Labour | Zakia Zubairi* | 2,831 | 62.4 | -0.5 | |
| Conservative | Jethro Ezimako | 1,005 | 22.2 | +6.6 | |
| Conservative | Anshul Gupta | 879 | 19.4 | +4.9 | |
| Conservative | Sabah Mnili | 818 | 18.0 | +4.9 | |
| Liberal Democrats | Nicola Hargreaves | 415 | 9.2 | +5.0 | |
| Liberal Democrats | Christian Matenaers | 375 | 8.3 | +5.5 | |
| Liberal Democrats | Mubin Mukadam | 222 | 4.9 | +2.2 | |
| Labour hold | Swing | ||||
| Labour hold | Swing | ||||
| Labour hold | Swing | ||||
Coppetts
| Party | Candidate | Votes | % | ± | |
|---|---|---|---|---|---|
| Labour | Reema Patel* | 2,793 | 58.6 | +10.7 | |
| Labour | Barry Rawlings* | 2,778 | 58.3 | +12.1 | |
| Labour | Pauline Coakley Webb* | 2,767 | 58.1 | +11.4 | |
| Conservative | Daniel Cohen | 1,358 | 28.5 | -3.7 | |
| Conservative | Luke Stewart | 1,300 | 27.3 | -1.4 | |
| Conservative | Anila Skeja | 1,247 | 26.2 | -0.9 | |
| Liberal Democrats | Julia Hughes | 493 | 10.3 | +5.7 | |
| Liberal Democrats | Alexander Ollier | 401 | 8.4 | +4.2 | |
| Liberal Democrats | Melvyn Rees | 381 | 8.0 | +4.8 | |
| Labour hold | Swing | ||||
| Labour hold | Swing | ||||
| Labour hold | Swing | ||||
East Barnet
| Party | Candidate | Votes | % | ± | |
|---|---|---|---|---|---|
| Labour | Jo Cooper | 2,509 | 45.2 | +2.1 | |
| Labour | Laurie Williams* | 2,509 | 45.2 | +3.4 | |
| Conservative | Felix Byers | 2,429 | 43.8 | +5.1 | |
| Labour | Philip Cohen* | 2,399 | 43.2 | +2.5 | |
| Conservative | Anne-Marie Pearce** | 2,365 | 42.6 | +4.3 | |
| Conservative | Pavan Pavanakumar | 2,310 | 41.6 | +4.4 | |
| Green | Margaret Curati | 498 | 9.0 | -4.0 | |
| Liberal Democrats | Jon Finlayson | 339 | 6.1 | +2.1 | |
| Liberal Democrats | David Bullen | 323 | 5.8 | +2.2 | |
| Liberal Democrats | Sean Hooker | 302 | 5.4 | +1.9 | |
| Conservative gain from Labour | Swing | ||||
| Labour hold | Swing | ||||
| Labour hold | Swing | ||||
Pearce was a councillor for Cockfosters ward in the London Borough of Enfield prior to the election.
East Finchley
| Party | Candidate | Votes | % | ± | |
|---|---|---|---|---|---|
| Labour | Arjun Mittra* | 3,158 | 60.5 | +6.1 | |
| Labour | Claire Farrier** | 3,151 | 60.3 | +13.6 | |
| Labour | Alison Moore* | 3,094 | 59.2 | +1.7 | |
| Conservative | Lucy Marks | 1,176 | 22.5 | +1.0 | |
| Conservative | James McKinley | 1,123 | 21.5 | +0.6 | |
| Conservative | Adam Gheasuddin | 1,073 | 20.5 | -0.4 | |
| Liberal Democrats | Joyce Arram | 545 | 10.4 | +1.7 | |
| Green | Noel Lynch | 416 | 8.0 | -5.6 | |
| Liberal Democrats | Diana Iwi | 377 | 7.2 | +0.6 | |
| Liberal Democrats | Jonty Stern | 351 | 6.7 | +1.4 | |
| Green | Stephen Norman | 313 | 6.0 | -6.8 | |
| Green | David Mellows | 287 | 5.5 | -7.3 | |
| Labour hold | Swing | ||||
| Labour hold | Swing | ||||
| Labour hold | Swing | ||||
Farrier was a councillor for Burnt Oak ward prior to the election.
Edgware
| Party | Candidate | Votes | % | ± | |
|---|---|---|---|---|---|
| Conservative | Brian Gordon* | 3,567 | 68.3 | +7.3 | |
| Conservative | Linda Freedman | 3,370 | 64.6 | +11.7 | |
| Conservative | Sarah Wardle | 3,289 | 63.0 | +14.3 | |
| Labour | Andrea Bilbow | 1,311 | 25.1 | -1.3 | |
| Labour | Amir Khnifess | 1,077 | 20.6 | -5.2 | |
| Labour | Jordan Scammell | 1,019 | 19.5 | -6.0 | |
| Green | Kunal Dhanani-Sumaria | 407 | 7.8 | -2.8 | |
| Liberal Democrats | Stephen Barber | 273 | 5.2 | -4.8 | |
| Liberal Democrats | Maria Manalo | 268 | 5.1 | -4.1 | |
| Liberal Democrats | Jose-Angel Ferrero Tijera | 252 | 4.8 | +1.0 | |
| Conservative hold | Swing | ||||
| Conservative hold | Swing | ||||
| Conservative hold | Swing | ||||
Finchley Church End
| Party | Candidate | Votes | % | ± | |
|---|---|---|---|---|---|
| Conservative | Eva Greenspan* | 3,429 | 64.9 | +8.5 | |
| Conservative | Jennifer Grocock | 3,192 | 60.5 | +10.4 | |
| Conservative | Daniel Thomas* | 3,050 | 57.8 | +9.6 | |
| Labour | Karen Walkden | 1,200 | 22.7 | -4.9 | |
| Labour | Debs Heneghan | 1,161 | 22.0 | -4.4 | |
| Labour | Joel Salmon | 1,141 | 21.6 | -4.6 | |
| Liberal Democrats | Rita Landeryou | 636 | 12.0 | +5.3 | |
| Liberal Democrats | Frank Jackman | 580 | 11.0 | +5.1 | |
| Liberal Democrats | Charles Wakefield | 517 | 9.8 | +4.9 | |
| Conservative hold | Swing | ||||
| Conservative hold | Swing | ||||
| Conservative hold | Swing | ||||
Garden Suburb
On September 20 2019, Cllr Gabriel Rozenberg left the Conservatives to join the Liberal Democrats due to their stance on Brexit and the election of Boris Johnson as party leader.[6]
| Party | Candidate | Votes | % | ± | |
|---|---|---|---|---|---|
| Conservative | John Marshall* | 3,481 | 66.9 | +7.8 | |
| Conservative | Gabriel Rozenberg* | 3,442 | 66.2 | +9.9 | |
| Conservative | Rohit Grover* | 3,376 | 64.9 | +9.1 | |
| Labour | Ruth Levin | 880 | 16.9 | -7.5 | |
| Labour | Mary McGuirk | 854 | 16.4 | -7.8 | |
| Labour | Ben MacKay | 815 | 15.7 | -5.0 | |
| Liberal Democrats | James Dearden | 636 | 12.2 | +3.8 | |
| Liberal Democrats | Penelope Gostyn | 583 | 11.2 | +3.3 | |
| Liberal Democrats | Jonathan Davies | 578 | 11.1 | +3.5 | |
| Green | Rachel Scott Halls | 460 | 8.8 | -5.4 | |
| Conservative hold | Swing | ||||
| Conservative hold | Swing | ||||
| Conservative hold | Swing | ||||
Golders Green
| Party | Candidate | Votes | % | ± | |
|---|---|---|---|---|---|
| Conservative | Dean Cohen* | 3,308 | 66.9 | +5.5 | |
| Conservative | Melvin Cohen* | 3,218 | 65.0 | +6.7 | |
| Conservative | Reuben Thompstone* | 3,046 | 61.6 | +15.2 | |
| Labour | Charles Harvey | 1,240 | 25.1 | -0.8 | |
| Labour | Sue O'Halloran | 1,129 | 22.8 | +0.4 | |
| Labour | Parmodh Sharma | 1,028 | 20.8 | -2.0 | |
| Green | Gillian Ward | 357 | 7.2 | -2.1 | |
| Liberal Democrats | Diana Darrer | 311 | 6.3 | +0.1 | |
| Liberal Democrats | Altan Akbiyik | 258 | 5.2 | +1.2 | |
| Liberal Democrats | Peter Lusher | 252 | 5.1 | +1.9 | |
| Conservative hold | Swing | ||||
| Conservative hold | Swing | ||||
| Conservative hold | Swing | ||||
Hale
| Party | Candidate | Votes | % | ± | |
|---|---|---|---|---|---|
| Conservative | Elliot Simberg | 3,130 | 51.9 | +11.4 | |
| Conservative | Lachhya Bahadur Gurung | 3,007 | 49.9 | +6.1 | |
| Conservative | Laithe Jajeh | 2,999 | 49.8 | +6.4 | |
| Labour | Rachel Barker | 2,347 | 38.9 | -1.7 | |
| Labour | Ernest Ambe | 2,166 | 35.9 | -4.2 | |
| Labour | Liron Velleman | 1,976 | 32.8 | -4.8 | |
| Green | Emile Batt | 420 | 7.0 | -3.8 | |
| Liberal Democrats | Michael Goodman | 397 | 6.6 | -0.1 | |
| Liberal Democrats | James Creighton | 355 | 5.9 | -0.1 | |
| Liberal Democrats | Geoffrey Jacobs | 306 | 5.1 | +0.2 | |
| Conservative hold | Swing | ||||
| Conservative hold | Swing | ||||
| Conservative gain from Labour | Swing | ||||
Hendon
| Party | Candidate | Votes | % | ± | |
|---|---|---|---|---|---|
| Conservative | Anthony Finn* | 3,002 | 62.6 | +11.6 | |
| Conservative | Mark Shooter* | 2,950 | 61.6 | +11.5 | |
| Conservative | Nizza Fluss | 2,892 | 60.4 | +12.1 | |
| Labour | Jenny Brown | 1,217 | 25.4 | -3.2 | |
| Labour | Andreas Ioannidis** | 1,192 | 24.9 | -3.0 | |
| Labour | David Beere | 1,185 | 24.7 | -2.0 | |
| Green | Carmen Legarda | 316 | 6.6 | -2.8 | |
| Liberal Democrats | Jason Moleman | 271 | 5.7 | -1.0 | |
| Liberal Democrats | Henryk Feszczur | 252 | 5.3 | -0.5 | |
| Liberal Democrats | Klevis Krasniqi | 163 | 3.4 | -0.9 | |
| Duma Polska | Malgorzata Zajaczkowska | 130 | 2.7 | N/A | |
| Conservative hold | Swing | ||||
| Conservative hold | Swing | ||||
| Conservative hold | Swing | ||||
Ioannidis was a councillor for Brunswick Park ward prior to the election.
High Barnet
| Party | Candidate | Votes | % | ± | |
|---|---|---|---|---|---|
| Conservative | Wendy Prentice* | 2,792 | 43.9 | +2.6 | |
| Conservative | David Longstaff* | 2,764 | 43.4 | +2.3 | |
| Conservative | Julian Teare | 2,605 | 41.0 | ±0.0 | |
| Labour | Amy Trevethan** | 2,604 | 41.0 | +18.0 | |
| Labour | Ange Balendra | 2,386 | 37.6 | +15.0 | |
| Labour | Paul Lemon | 2,344 | 36.9 | +16.9 | |
| Liberal Democrats | Duncan MacDonald | 581 | 9.2 | -7.1 | |
| Liberal Democrats | Simon Cohen | 577 | 9.1 | -4.3 | |
| Liberal Democrats | Sharmistha Michaels | 481 | 7.6 | -4.4 | |
| Independent | Ken Rowland | 471 | 7.4 | N/A | |
| Green | Charles Wicksteed | 425 | 6.7 | -11.8 | |
| Green | Nathan Wade | 328 | 5.2 | -12.3 | |
| Conservative hold | Swing | ||||
| Conservative hold | Swing | ||||
| Conservative hold | Swing | ||||
Trevethan was a councillor for Underhill prior to the election.
Mill Hill
| Party | Candidate | Votes | % | ± | |
|---|---|---|---|---|---|
| Conservative | Val Duschinsky* | 3,009 | 50.7 | +11.3 | |
| Conservative | John Hart* | 2,977 | 50.1 | +8.2 | |
| Conservative | Golnar Bokaei | 2,867 | 48.3 | +10.3 | |
| Labour | Katherine Barker | 1,555 | 26.2 | +0.4 | |
| Labour | Mike Barker | 1,431 | 24.1 | -1.0 | |
| Labour | Kamal Gurung | 1,307 | 22.0 | -3.0 | |
| Liberal Democrats | Richard Logue | 1,236 | 20.8 | +6.1 | |
| Liberal Democrats | Roger Tichborne | 1,200 | 20.2 | +9.8 | |
| Liberal Democrats | Donna Pickup | 1,045 | 17.6 | +8.0 | |
| Green | Michelle Lynch | 301 | 5.1 | -5.0 | |
| Green | Kwatelai Quartey-Papafio | 166 | 2.8 | -2.9 | |
| Conservative hold | Swing | ||||
| Conservative hold | Swing | ||||
| Conservative hold | Swing | ||||
Oakleigh
| Party | Candidate | Votes | % | ± | |
|---|---|---|---|---|---|
| Conservative | Thomas Smith | 2,814 | 52.0 | +10.4 | |
| Conservative | Stephen Sowerby* | 2,774 | 51.3 | +12.1 | |
| Conservative | Sachin Rajput* | 2,768 | 51.2 | +10.4 | |
| Labour | Angie Hudson | 1,943 | 35.9 | +12.0 | |
| Labour | Nick Mahony | 1,734 | 32.1 | +9.0 | |
| Labour | Paul Probyn | 1,629 | 30.1 | +10.1 | |
| Green | Gabrielle Bailey | 535 | 9.9 | -0.5 | |
| Liberal Democrats | Elisabeth Edgar | 421 | 7.8 | +2.7 | |
| Liberal Democrats | Lisa Smith | 420 | 7.8 | +3.8 | |
| Liberal Democrats | Horora Morrissey | 349 | 6.5 | +2.5 | |
| Conservative hold | Swing | ||||
| Conservative hold | Swing | ||||
| Conservative hold | Swing | ||||
Totteridge
| Party | Candidate | Votes | % | ± | |
|---|---|---|---|---|---|
| Conservative | Alison Cornelius* | 2,862 | 59.5 | +7.3 | |
| Conservative | Caroline Stock* | 2,810 | 58.4 | +9.1 | |
| Conservative | Richard Cornelius* | 2,800 | 58.2 | +7.5 | |
| Labour | Cameron Camina | 1,294 | 26.9 | +2.2 | |
| Labour | Nancy Graterol-Montilla | 1,197 | 24.9 | +3.4 | |
| Labour | Rob Persad | 1,150 | 23.9 | +5.1 | |
| Liberal Democrats | Janice Turner | 451 | 9.4 | +1.8 | |
| Liberal Democrats | Fiona Brickwood | 433 | 9.0 | +3.0 | |
| Green | Jacob Trup | 362 | 7.5 | -3.5 | |
| Liberal Democrats | David Jeremy Keech | 322 | 6.7 | +1.7 | |
| Green | Raymundo Obedencio | 236 | 4.9 | -3.7 | |
| Total votes | 4,808 | ||||
| Conservative hold | Swing | ||||
| Conservative hold | Swing | ||||
| Conservative hold | Swing | ||||
Underhill
On February 25 2019, Cllr Jessica Brayne left the Labour Party over their failure to tackle anti-Semitism and their stance on Brexit. She then joined the Liberal Democrats in September 2019.[7]
| Party | Candidate | Votes | % | ± | |
|---|---|---|---|---|---|
| Labour | Paul Edwards* | 2,635 | 51.9 | +9.6 | |
| Labour | Jess Brayne* | 2,556 | 50.4 | +10.7 | |
| Labour | Tim Roberts* | 2,447 | 48.2 | +9.8 | |
| Conservative | Gaynor Bond | 1,839 | 36.2 | +2.9 | |
| Conservative | Lara Akindiji | 1,769 | 34.9 | +5.8 | |
| Conservative | Maximilian Romain | 1,547 | 30.5 | +4.8 | |
| Liberal Democrats | Victor Corney | 507 | 10.0 | +5.3 | |
| Green | Dawn Laughton | 467 | 9.2 | -2.0 | |
| Liberal Democrats | Gerard Fitzgerald | 282 | 5.6 | +2.1 | |
| Liberal Democrats | Eunice Phillips | 280 | 5.5 | +2.2 | |
| Green | Brigitte Guile | 278 | 5.5 | -5.2 | |
| Labour hold | Swing | ||||
| Labour hold | Swing | ||||
| Labour hold | Swing | ||||
West Finchley
| Party | Candidate | Votes | % | ± | |
|---|---|---|---|---|---|
| Labour | Ross Houston* | 2,326 | 49.3 | -0.7 | |
| Labour | Kath McGuirk* | 2,279 | 48.3 | +0.6 | |
| Labour | Danny Rich | 2,069 | 43.8 | -4.5 | |
| Conservative | Afshan Smith | 1,563 | 33.1 | +2.2 | |
| Conservative | Doron Jacobs | 1,518 | 32.2 | +3.0 | |
| Conservative | Ajantha Tennakoon | 1,424 | 30.2 | +6.1 | |
| Women's Equality | Amanda Shribman | 497 | 10.5 | N/A | |
| Liberal Democrats | Carolina Revilla Garcia | 428 | 9.1 | +3.2 | |
| Green | John Colmans | 418 | 8.9 | -3.5 | |
| Green | David Burns | 394 | 8.3 | -1.6 | |
| Liberal Democrats | Thomas Darrer | 357 | 7.6 | +2.2 | |
| Liberal Democrats | Ronald Finlay | 318 | 6.7 | +2.0 | |
| Labour hold | Swing | ||||
| Labour hold | Swing | ||||
| Labour hold | Swing | ||||
West Hendon
| Party | Candidate | Votes | % | ± | |
|---|---|---|---|---|---|
| Conservative | Saira Don | 2,196 | 45.4 | +10.3 | |
| Conservative | Alex Prager | 2,155 | 44.5 | +10.1 | |
| Conservative | Helene Richman | 2,130 | 44.0 | +12.0 | |
| Labour | Agnes Slocombe* | 2,078 | 42.9 | +1.7 | |
| Labour | Humayune Khalick | 2,074 | 42.9 | +1.2 | |
| Labour | Adam Langleben* | 2,014 | 41.6 | -0.7 | |
| Green | Miriam Green | 299 | 6.2 | -0.7 | |
| Liberal Democrats | Daniel Churchus | 264 | 5.5 | +1.4 | |
| Liberal Democrats | Michael Lees | 238 | 4.9 | +1.1 | |
| Liberal Democrats | David Watson | 184 | 3.8 | ±0.0 | |
| Total votes | 13,632 | ||||
| Conservative gain from Labour | Swing | ||||
| Conservative gain from Labour | Swing | ||||
| Conservative gain from Labour | Swing | ||||
Woodhouse
| Party | Candidate | Votes | % | ± | |
|---|---|---|---|---|---|
| Labour | Anne Hutton* | 2,915 | 54.8 | +7.4 | |
| Labour | Geof Cooke* | 2,796 | 52.6 | +6.5 | |
| Labour | Alan Schneiderman* | 2,677 | 50.3 | +8.6 | |
| Conservative | Mark Higgins | 1,547 | 29.1 | ±0.0 | |
| Conservative | James Marlow | 1,514 | 28.5 | +1.3 | |
| Conservative | Simon Shaer | 1,499 | 28.2 | +1.6 | |
| Green | Diane Burstein | 541 | 10.2 | -2.0 | |
| Liberal Democrats | Tanya Spensley | 411 | 7.7 | +3.3 | |
| Liberal Democrats | Jonathan Landau | 366 | 6.9 | +2.6 | |
| Green | Nicole Onyeche | 354 | 6.7 | -4.3 | |
| Green | Gardi Vaswani | 316 | 5.9 | -3.6 | |
| Liberal Democrats | Dara Vakili | 254 | 4.8 | +0.9 | |
| UKIP | Karl Khan | 122 | 2.3 | -8.8 | |
| Labour hold | Swing | ||||
| Labour hold | Swing | ||||
| Labour hold | Swing | ||||
References
- Volpe, Sam (20 September 2019). "Gabriel Rozenberg: Barnet Tory councillor defects to Liberal Democrats blaming Brexit, Boris Johnson and Jacob Rees-Mogg". Ham&High.
- https://twitter.com/rozgab/status/1179461185974030343?s=19
- King, Jon (15 March 2018). "Barnet Conservatives lose majority control of council after Cllr Sury Khatri resignation". Ham & High. Retrieved 18 March 2018.
- Elects, Britain (May 2018). "LE2018 ward-by-ward results: London only [Britain Elects]". Britain Elects. Retrieved 21 June 2018.
- Election results on Barnet Council website
- Volpe, Sam (20 September 2019). "Gabriel Rozenberg: Barnet Tory councillor defects to Liberal Democrats blaming Brexit, Boris Johnson and Jacob Rees-Mogg". Ham&High.
- Allin, Simon (25 February 2019). "Barnet Labour councillor quits over anti-Semitism and Brexit". Hendon and Finchley Times.