1990 German federal election
Federal elections were held in Germany on 2 December 1990 to elect the members of the 12th Bundestag. This was the first all-German election since the Nazi show election in April 1938, the first multi-party all-German election since that of March 1933, which was held after the Nazi seizure of power and was subject to widespread suppression, and the first free and fair all-German election since November 1932. The result was a comprehensive victory for the governing coalition of the Christian Democratic Union/Christian Social Union and the Free Democratic Party, which was reelected to a third term.
| |||||||||||||||||||||||||||||||||||||||||||||||||||||||||||||||||||||||||||||||||||||||||
All 662 seats in the Bundestag 332 seats needed for a majority | |||||||||||||||||||||||||||||||||||||||||||||||||||||||||||||||||||||||||||||||||||||||||
|---|---|---|---|---|---|---|---|---|---|---|---|---|---|---|---|---|---|---|---|---|---|---|---|---|---|---|---|---|---|---|---|---|---|---|---|---|---|---|---|---|---|---|---|---|---|---|---|---|---|---|---|---|---|---|---|---|---|---|---|---|---|---|---|---|---|---|---|---|---|---|---|---|---|---|---|---|---|---|---|---|---|---|---|---|---|---|---|---|---|
| Registered | 60,436,560 | ||||||||||||||||||||||||||||||||||||||||||||||||||||||||||||||||||||||||||||||||||||||||
| Turnout | 46,995,915 (77.8%)[1] | ||||||||||||||||||||||||||||||||||||||||||||||||||||||||||||||||||||||||||||||||||||||||
| |||||||||||||||||||||||||||||||||||||||||||||||||||||||||||||||||||||||||||||||||||||||||
 Results by state for the second votes. Light blue denotes states where the CDU/CSU won a plurality of votes; darker blue denotes states where CDU/CSU won an absolute majority of votes; pink denotes states where the SPD won a plurality of votes; red denotes where the SPD won an absolute majority of votes. | |||||||||||||||||||||||||||||||||||||||||||||||||||||||||||||||||||||||||||||||||||||||||
| |||||||||||||||||||||||||||||||||||||||||||||||||||||||||||||||||||||||||||||||||||||||||
.jpg)
.jpg)
.jpg)
.jpg)
.jpg)
Issues and campaign
This was the first election conducted after German reunification which took place on 3 October. Almost 150 seats had been added to represent the newly re-established eastern states of Germany without reducing the number of Western members. The euphoria following the reunification gave the ruling CDU/CSU–FDP coalition a dramatic advantage in both Western and Eastern Germany throughout the campaign.
This was the one and only election for which the 5% threshold was not applied nationwide, but separately for East Germany (including East Berlin) and West Germany (including West Berlin). As a result, while the Western The Greens failed to gain representation, an ideologically similar party from the East, Alliance 90, did. They merged to form Alliance 90/The Greens in 1993.
Results
 |
|---|
| This article is part of a series on the politics and government of Germany |
|
|
Head of State |
|
Executive
|
|
|
Administrative divisions
|
|
All change figures are relative to the pre-existing West German Bundestag.
| Parties | Constituency | Party list | Total seats | |||||||||||||
|---|---|---|---|---|---|---|---|---|---|---|---|---|---|---|---|---|
| Votes | % | +/− | Seats | +/− | Votes | % | +/− | Seats | +/− | Seats | +/− | % | ||||
| Christian Democratic Union (CDU) | 17,707,574 | 38.3 | +0.8 | 192 | +68 | 17,055,116 | 36.7 | +2.3 | 76 | +26 | 268 | +83 | 40.5 | |||
| Social Democratic Party (SPD) | 16,279,980 | 35.2 | −4.0 | 91 | +12 | 15,545,366 | 33.5 | −3.5 | 148 | +41 | 239 | +46 | 36.1 | |||
| Free Democratic Party (FDP) | 3,595,135 | 7.8 | +3.1 | 1 | +1 | 5,123,233 | 11.0 | +1.9 | 78 | +32 | 79 | +31 | 11.9 | |||
| Christian Social Union (CSU) | 3,423,904 | 7.4 | −2.8 | 43 | −2 | 3,302,980 | 7.1 | −2.7 | 8 | +4 | 51 | +2 | 7.7 | |||
| Party of Democratic Socialism (PDS) | 1,049,245 | 2.3 | +2.3 | 1 | +1 | 1,129,578 | 2.4 | +2.4 | 16 | +16 | 17 | +17 | 2.6 | |||
| Alliance '90/The Greens (B90/Gr.) (East) | 552,027 | 1.2 | +1.2 | 0 | ±0 | 559,207 | 1.2 | +1.2 | 8 | +8 | 8 | +8 | 1.2 | |||
| The Greens (West) | 2,037,885 | 4.4 | −2.6 | 0 | ±0 | 1,788,200 | 3.8 | −4.5 | 0 | −42 | 0 | −44 | 0 | |||
| The Republicans (REP) | 767,652 | 1.7 | +1.7 | 0 | ±0 | 987,269 | 2.1 | +2.1 | 0 | ±0 | 0 | ±0 | 0 | |||
| The Grays – Gray Panthers (GRAUE) | 218,412 | 0.5 | +0.5 | 0 | ±0 | 385,910 | 0.8 | +0.8 | 0 | ±0 | 0 | ±0 | 0 | |||
| Ecological Democratic Party (ÖDP) | 243,469 | 0.5 | +0.4 | 0 | ±0 | 205,206 | 0.4 | +0.1 | 0 | ±0 | 0 | ±0 | 0 | |||
| National Democratic Party (NPD) | 190,105 | 0.4 | −0.1 | 0 | ±0 | 145,776 | 0.3 | −0.3 | 0 | ±0 | 0 | ±0 | 0 | |||
| German Social Union (DSU) | 131,747 | 0.3 | +0.3 | 0 | ±0 | 89,008 | 0.2 | +0.2 | 0 | ±0 | 0 | ±0 | 0 | |||
| Christian League (Liga) | 8,667 | 0.0 | +0.0 | 0 | ±0 | 39,640 | 0.1 | +0.1 | 0 | ±0 | 0 | ±0 | 0 | |||
| Christian Centre (CM) | 9,824 | 0.0 | +0.0 | 0 | ±0 | 36,466 | 0.1 | +0.1 | 0 | ±0 | 0 | ±0 | 0 | |||
| Bavaria Party (BP) | 10,836 | 0.0 | ±0 | 0 | ±0 | 31,315 | 0.1 | ±0 | 0 | ±0 | 0 | ±0 | 0 | |||
| The Women (FRAUEN) | 1,433 | 0.0 | +0.0 | 0 | ±0 | 12,077 | 0.0 | −0.2 | 0 | ±0 | 0 | ±0 | 0 | |||
| Patriots for Germany (Patrioten) | 746 | 0.0 | −0.1 | 0 | ±0 | 4,687 | 0.0 | −0.1 | 0 | ±0 | 0 | ±0 | 0 | |||
| Eco-Union (ÖKO-UNION) | 1,106 | 0.0 | +0.0 | 0 | ±0 | 4,661 | 0.0 | +0.0 | 0 | ±0 | 0 | ±0 | 0 | |||
| Union of Working Groups for Employee Politics and Democracy (VAA) | 704 | 0.0 | +0.0 | 0 | ±0 | 4,530 | 0.0 | +0.0 | 0 | ±0 | 0 | ±0 | 0 | |||
| Communist Party of Germany (KPD) | – | – | – | – | – | 1,630 | 0.0 | +0.0 | 0 | ±0 | 0 | ±0 | 0 | |||
| Spartacist Workers' Party of Germany (SpAD) | 124 | 0.0 | +0.0 | 0 | ±0 | 1,610 | 0.0 | +0.0 | 0 | ±0 | 0 | ±0 | 0 | |||
| Federation of German Democrats (DDD) | 474 | 0.0 | +0.0 | 0 | ±0 | 1,009 | 0.0 | +0.0 | 0 | ±0 | 0 | ±0 | 0 | |||
| Federation of Socialist Workers (BSA) | 214 | 0.0 | +0.0 | 0 | ±0 | 826 | 0.0 | +0.0 | 0 | ±0 | 0 | ±0 | 0 | |||
| Responsible Citizens | 72 | 0.0 | ±0 | 0 | ±0 | 492 | 0.0 | −0.1 | 0 | ±0 | 0 | ±0 | 0 | |||
| European Federalist Party (EFP) | 266 | 0.0 | +0.0 | 0 | ±0 | – | – | – | – | – | 0 | ±0 | 0 | |||
| Electoral groups and independents | 43,324 | 0.1 | −0.6 | 0 | ±0 | – | – | – | – | – | 0 | ±0 | 0 | |||
| Invalid/blank votes | 720,990 | — | — | — | — | 540,143 | — | — | — | — | — | — | — | |||
| Totals | 46,995,915 | 100 | ±0.0 | 328 | +80 | 46,995,915 | 100 | ±0.0 | 334 | +85 | 662 | +143 | ±0 | |||
| Registered voters/turnout | 60,436,560 | 77.8 | — | — | — | 60,436,560 | 77.8 | — | — | — | — | — | — | |||
| Source: Federal Returning Officer | ||||||||||||||||
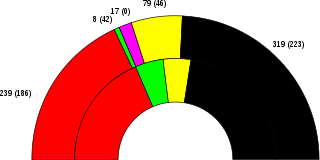
| 319 | 79 | 239 | 17 | 8 |
| CDU/CSU | FDP | SPD | PDS |
Results by state
| State | Union | SPD | FDP | Grüne | PDS | Others |
|---|---|---|---|---|---|---|
| 46.5 | 29.1 | 12.3 | 5.7 | 0.3 | 6.1 | |
| 51.9 | 26.7 | 8.7 | 4.6 | 0.2 | 7.9 | |
| 39.4 | 30.6 | 9.1 | 7.2[lower-alpha 3] | 9.7 | 4.0 | |
| 36.3 | 32.9 | 9.7 | 6.6 | 11.0 | 3.5 | |
| 30.9 | 42.5 | 12.8 | 8.3 | 1.1 | 4.4 | |
| 36.6 | 41.0 | 12.0 | 5.8 | 1.1 | 3.5 | |
| 41.3 | 38.0 | 10.9 | 5.6 | 0.4 | 3.8 | |
| 44.3 | 38.4 | 10.3 | 4.5 | 0.3 | 2.2 | |
| 41.2 | 26.5 | 9.1 | 5.9 | 14.2 | 3.1 | |
| 40.5 | 41.1 | 11.0 | 4.3 | 0.3 | 2.8 | |
| 45.6 | 36.1 | 10.4 | 4.0 | 0.2 | 3.7 | |
| 38.1 | 51.2 | 6.0 | 2.3 | 0.2 | 2.2 | |
| 49.5 | 18.2 | 12.4 | 5.9 | 9.0 | 5.0 | |
| 38.6 | 24.7 | 19.7 | 5.3 | 9.4 | 2.3 | |
| 43.5 | 38.5 | 11.4 | 4.0 | 0.3 | 2.3 | |
| 45.2 | 21.9 | 14.6 | 6.1 | 8.3 | 3.9 | |
| Old states (West) | 44.3 | 35.7 | 10.6 | 4.8 | 0.3 | 4.3 |
| New states (East) | 41.8 | 24.3 | 12.9 | 6.2 | 11.1 | 3.7 |
Post-election
The governing CDU/CSU-FDP coalition was returned to office with a landslide majority, and Helmut Kohl remained chancellor. The CDU did exceptionally well in the former East Germany, which had been the heartland of the SPD before the Nazi era.

Notes
- Lafontaine was the SPD's Chancellor candidate, but was not party leader.
- Lafontaine was elected in Saarbrücken, but did not accept his mandate after the election.
- 3.9% West German Green Party, 3.3% East German Green Party/Alliance 90.
References
- "Voter turnout by election year". Website of the Federal Returning Officer's Office. The Federal Returning Officer. Archived from the original on 7 November 2014. Retrieved 7 November 2014.
Sources
| Parliamentary elections | |
|---|---|
| Presidential elections | |
| European elections | |
| Referendums | |
| |