Landslide victory
A landslide victory is an electoral victory in a political system, when a change in people's views on political matters results in one candidate or party receiving an overwhelming majority of the votes or seats in the elected body, thus all but utterly eliminating the opponents. Part of the reason for a landslide victory is sometimes a bandwagon effect, as a significant number of people may decide to vote for the party which is in the lead in the pre-election opinion polls, whereas they wouldn't have voted the same way if it seemed unpopular. The term is borrowed from geology, where a landslide takes almost everything with it on its way, creating a change in the landscape.
For some people, a landslide victory is synonymous to an overwhelming victory, but there is no consensus on how wide a margin is necessary for an overwhelming or lopsided victory is necessary to justify a landslide. In this usage, there is no inherent shift from one side to the other, no change in the landscape.
Canada

In a Canadian federal election, a landslide victory occurs when a political party gains a significant majority of the House of Commons of Canada.
Landslide victories may also occur during provincial elections, and territorial elections in Yukon. Landslide victories are not possible for territorial elections in the Northwest Territories, and Nunavut, as its members are elected without reference to political parties, operating as a consensus government.
The following Canadian federal elections resulted in landslide victories:[1]
- 1874 – The Liberals won 133 seats while the Conservatives won just 73 seats.
- 1878 – The Conservatives won 137 seats while the Liberals won just 69 seats.
- 1882 – The Conservatives won 139 seats while the Liberals won just 71 seats.
- 1900 – The Liberals won 132 seats while the Conservatives won just 81.
- 1904 – The Liberals won 139 seats while the Conservatives won just 75.
- 1908 – The Liberals won 133 seats while the Conservatives won just 85.
- 1911 – The Conservatives won 133 seats while the Liberals won just 86.
- 1917 – The Conservatives won 153 seats while the Liberals won just 82.
- 1930 – The Conservatives won 137 seats while the Liberals won just 91.
- 1935 – The Liberals won 171 seats while the Conservatives won just 39.
- 1940 – The Liberals won 178 seats while the Progressive Conservatives won just 39.
- 1949 – The Liberals won 190 seats while the Progressive Conservatives won just 41.
- 1953 – The Liberals won 171 seats while the Progressive Conservatives won just 51.
- 1958 – The Progressive Conservatives won 208 seats while the Liberals won just 48.
- 1968 – The Liberals won 155 seats while the Progressive Conservatives won just 72.
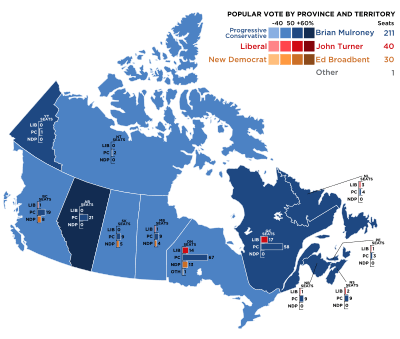
- 1984 – The Progressive Conservatives won 211 seats while the Liberals won just 40.
- 1993 – The Liberals won 177 seats while the Bloc Quebecois, which ran only in Québec, won 54. The ruling Progressive Conservatives dropped from 154 to 2.
- 2015 – The Liberals led by Justin Trudeau won 184 seats, defeating Conservative Prime Minister Stephen Harper, who only won 99 seats.
Provincial examples
- 2018 Ontario general election – Doug Ford's Progressive Conservative Party defeated the long-term Liberal government of Kathleen Wynne.
- 2018 Quebec general election – The populist party Coalition Avenir Québec led by François Legault beat the Quebec Liberal Party, defeating 4-year Premier of Quebec Philippe Couillard.
- 2019 Alberta general election – Jason Kenney's United Conservative Party defeated the Alberta New Democratic Party government of Rachel Notley.
France
Since 1958
- 1968 legislative election: the Gaullist party wins 3/4 of all seats.
- 1981 legislative elections: the PS wins 266 out of 481
- 1993: the liberal-conservative coalition RPR-UDF wins 84% of the seats in parliament.
- 2002 – Jacques Chirac wins the presidential election with 82.1% of the popular vote.[2] His party also won 357 seats out of 577.
Germany
Because of Germany's multi-party mixed-member proportional representation system, it is extremely difficult for any one party to gain a majority in the Bundestag. Thus, a landslide election occurs when a party gains close to a majority and has a large margin over its main opponent in the popular vote and are very rare.
- 1953: The CDU/CSU received 45.2% of the popular vote and 249 seats (six shy of a majority) while the SPD received just 28.8% of the popular vote and 162 seats.[3]
- 1957: The CDU/CSU received 50.2% of the popular vote and 277 seats (a majority of 17) while the SPD received just 31.8% of the popular vote and 181 seats.[4]
- 2013: The CDU/CSU received 41.5% of the popular vote and 311 seats (five shy of a majority) while the SPD received just 25.7% of the popular vote and 193 seats.[5][6]
Hong Kong
- 1991 Hong Kong legislative election: The pro-democracy camp won 16 of the 18 directly elected geographical constituency seats, with a coalition of the United Democrats of Hong Kong and the Meeting Point taking 14 of the seats.
- 1995 Hong Kong legislative election: The pro-democracy camp swept 16 of the 20 directly elected geographical constituency seats in which the Democratic Party alone took 12 directly elected seats.
- 2019 Hong Kong local elections: The pro-democracy camp seized control of 17 of the 18 District Councils, tripling their seats from about 124 to 389. The Pro-Beijing parties and independents won only 61 seats, a loss of 242 seats, received their largest defeat in history.
Italy
- 2005 Italian regional elections: The Union took over the presidency in 16 out of 20 regions.
- 2014 European Parliament election in Italy: The PD received 40.8% of the popular vote while the M5S received just 21.2% of the popular vote.
- 2015 Italian regional elections (with the deviating from 2012 to 2014): The Centre-left coalition took over the presidency in 17 out of 20 regions.
New Zealand
Before 1993, New Zealand used the traditional first-past-the-post system as in the U.K. to determine representation in its Parliament. Thus, landslide elections at that time were defined in an identical fashion, i.e. where one party got an overwhelming majority of the seats. Since 1993, New Zealand has used the mixed member proportional system as in Germany, making landslides much less likely.[7]
- 1893 election – The Liberals won 51 seats and 57.8% of the vote while the Conservatives won 13 seats and just 24.5% of the vote.[8]
- 1899 election – The Liberals won 49 seats and 52.7% of the vote while the Conservatives won 19 seats and just 36.6% of the vote.[8]
- 1905 election – The Liberals won 58 seats and 53.1% of the vote while the Conservatives won 16 seats and just 29.7% of the vote.[8]
- 1925 election – The Reform Party won 55 seats while the Labour & Liberal parties won just 23 seats combined.[8]
- 1935 election – The Labour Party won 53 seats while the Coalition won just 19 seats.[8]
- 1938 election – The Labour Party won 53 seats while the National Party won just 25 seats.[8]
- 1972 election – The Labour Party won 55 seats while the National Party won just 32 seats.[8]
- 1975 election – The National Party won 55 seats while the Labour Party won just 32 seats.[8]
- 1984 election – The Labour Party won 56 seats while the National Party won just 37 seats.[8]
- 1990 election – The National Party won 67 seats while the Labour Party won just 29 seats.[8]
- 2002 election – The Labour Party won 52 seats while the National Party won just 27 seats.[9]
- 2014 election – The National Party won 60 seats while the Labour Party won just 32 seats.[10]
Philippines

In 1941, the Nacionalista Party won the presidency, vice presidency, all seats in Senate and all but 3 seats in the House of Representatives. This was the biggest landslide in Philippine history. The legislators won't serve until 1945 though, due to World War II.
Starting in 1987, the Philippines evolved into a multi-party system, and coupled with the introduction of party-list elections in 1998, no party was able to win a landslide, much less a majority of seats, in the House of Representatives since then. This has also meant that no presidential and vice presidential election winner won a majority of votes, although in 1998, the winners were described in having landslide victories, despite winning less than a majority of votes, due to large winning margins. Senatorial landslides are more possible though in midterm elections, as voters are usually presented with two distinct choices.
Presidential and vice presidential elections
In the Philippines, while there are presidential tickets, the positions of president and vice president are elected separately.
- 1935 election – Manuel L. Quezon won with 68% of the vote. His running mate, Sergio Osmeña, won with 86% of the vote. Their second placers had 18% and 8% of the vote, respectively.
- 1941 election – Manuel L. Quezon won with 82% of the vote. His running mate, Sergio Osmeña, won with 92% of the vote. Their opponents had 18% and 8% of the vote, respectively. This was the biggest landslide in an election where major opposition parties participated.
- 1953 election – Ramon Magsaysay won with 69% of the vote. His running mate, Carlos P. Garcia, won with 63% of the vote. Their opponents had 31% and 37% of the vote, respectively.
- 1981 election – Ferdinand Marcos won with 89% of the vote, and won on every province. Major opposition parties boycotted this election. This is the largest landslide in history.
- 1998 election – Joseph Estrada won with 40% of the vote. His main opponent, Jose de Venecia, received just 16%, or a margin of 24%. De Venecia's running mate, Gloria Macapagal Arroyo, won with almost 50% of the vote. Her main opponent, Estrada's running mate Edgardo Angara, received just 22%, or a margin of about 28%.
Senate
- 1941 election – Nacionalista Party won all 24 seats in the Senate. This was the only time that the Senate had no members from the opposition.
- 1949 election – The Liberal Party won all 8 seats contested.
- 1951 election – The Nacionalista Party won all 9 seats contested.
- 1955 election – The Nacionalista Party won all 9 seats contested. The Nacionalistas then had 21 of the 24 seats in the Senate, leaving the Liberals with none.
- 1987 election – Lakas ng Bayan won 22 of 24 seats. Their main opponents, the Grand Alliance for Democracy, won 2.
- 2019 election – Hugpong ng Pagbabago won 9 of the 12 seats contested. Their main opponents, Otso Diretso won no seats. The other 3 seats went to other parties.
House of Representatives
- 1907 election – The Nacionalista Party won 59 of 80 seats. The Progresista Party won 16. From 1907 to 1919, the Nacionalistas won every election in large margins, as they advocated Philippine independence from the United States, over their opponents more conservative approach to the issue. From 1922 to 1935, the Nacionalistas were split into factions, until they were reunited in time for 1938 election.
- 1938 election – The Nacionalista Party won all 98 seats. This was the only time that the House of Representatives had no members from the opposition.
- 1941 election – The Nacionalista Party won 95 seats. The other 3 seats were won by independents.
- 1957 election – The Nacionalista Party won 82 seats. The Liberal Party won just 19.
- 1969 election – The Nacionalista Party won 88 seats. The Liberal Party won just 18.
- 1978 election – The Kilusang Bagong Lipunan won 150 seats. Their opposition Lakas ng Bayan, won no seats. Minor and regional parties won the remaining 15 seats. The opposition branded the election as fraudulent.
Slovakia
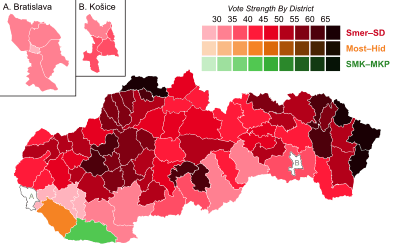
- 2012: Direction – Social Democracy won an absolute majority of seats - received 44.41% of the popular vote while the second party Christian Democratic Movement received just 8.82% of the popular vote. It was the first time after Velvet Revolution when government was created by only one party. The early elections followed the fall of Prime Minister Iveta Radičová's Slovak Democratic and Christian Union – Democratic Party-led coalition in October 2011 over a no confidence vote her government had lost because of its support for the European Financial Stability Fund.
Spain
- 1982 and 1986: Felipe González's Spanish Socialist Workers' Party (PSOE) won two consecutive blowouts, with advantages of 22 and 18 percentage points over the second party, Manuel Fraga's right-wing People's Alliance, which scored just over one hundred seats and won only one region, Galicia. In 1982, PSOE won over 200 seats, the only time this has been achieved by a sole party.
- 2000: Ruling José María Aznar's People's Party (PP) won by 10 percentage points to the PSOE.
- 2011: local, regional and national elections were all landslide wins for the then-in opposition Mariano Rajoy's PP, winning the national election by a 16 percentage point margin to then-ruling PSOE.
United Kingdom

In UK General Elections, a landslide victory involves a large swing from one party to another as well as one party winning a large majority in parliament. Landslide victories have usually occurred after a long period of government from one particular party and a change in the popular mood.
Notable landslide election results:
- 1906 General Election – Known as the 'Liberal Landslide', Henry Campbell-Bannerman led his Liberal Party to victory over Arthur Balfour's Conservative Party who lost more than half their seats, including his own seat in Manchester East, as a result of the large national swing to the Liberal Party (The 5.4% swing from the Conservatives to Liberals was at the time the highest ever achieved). The Liberal Party won 397 seats (an increase of 214) while the Conservative Party were left with 156 seats (a decrease of 246).[11][12]
- 1945 General Election – Clement Attlee led his Labour Party to victory over Winston Churchill's Conservative Party, a 12.0% swing from the Conservatives to Labour. Labour won 393 seats (an increase of 239) while the Conservative Party were left with 197 (a decrease of 190).[13]
- 1983 General Election – Margaret Thatcher won her second term in office with a landslide victory for the Conservatives gaining an overall majority of 144 by winning 397 seats (a increase of 38 seats) on 42.4% of the national vote and forcing her main opponent Michael Foot to resign after Labour won 209 seats.
- 1997 General Election – Tony Blair's Labour Party won 418 seats (an increase of 145) and gained an overall majority of 179 while the Conservative Party won 165 seats (a decrease of 178). The swing from the Conservatives to Labour was 10.2% and was the second biggest general election victory of the 20th Century after 1931.[14]
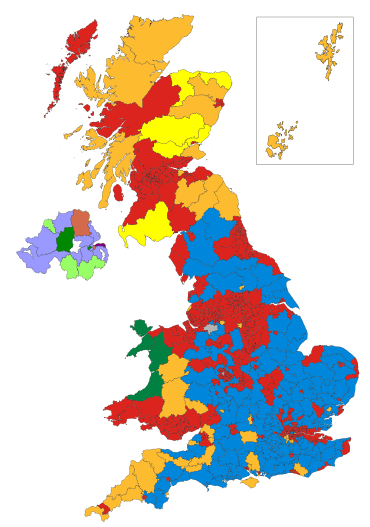
- 2019 General Election – Boris Johnson led the Conservative Party to its largest majority since 1987, winning a total of 365 seats (an increase of 48) and left the Labour Party, who were led by Jeremy Corbyn, with 202 seats (a decrease of 60, their worst result since 1935). The election led to 54 Labour seats changing to Conservative predominantly in the Midlands and Northern England - some of which had been held by Labour since the first half of the 20th century.[15]
Scotland

.svg.png)
- 2011 Scottish Parliament Election – Alex Salmond led the Scottish National Party to a second term in Scottish Government with unprecedented success when they became the first party in Scotland to win an overall majority under an electoral system which was supposed to prevent such a result winning 69 seats and led to the holding of the 2014 Scottish independence referendum. The Scottish Labour Party only lost 7 seats overall however lost 22 constituency seats to the SNP in their worst result in Scotland for almost thirty years.
- 2015 UK General Election (Scotland) – The Scottish National Party led by First Minister Nicola Sturgeon who took over from Alex Salmond following the 2014 Scottish independence referendum won 56 out of 59 Westminster parliamentary constituency seats in Scotland, an increase of 50. The SNP, additionally, achieved 50% of the total votes in Scotland, 30% higher than the previous election. The Scottish Labour Party were reduced to one seat, from 41. The overall swing in Scotland was 23.9% from Labour to the SNP.
United States


A landslide victory in U.S. Presidential elections occurs when a candidate has an overwhelming majority in the Electoral College.
- 1789 and 1792 – George Washington (Independent) received 100% of the electoral votes.
- 1804 – Thomas Jefferson (Democratic-Republican) received 162 (92%) of the electoral votes while Charles Cotesworth Pinckney (Federalist) received only 14 (8%).
- 1816 – James Monroe (Democratic-Republican) received 183 (83.9%) of the electoral votes while Rufus King (Federalist) received only 34 (15.6%).
- 1820 – James Monroe (Democratic-Republican) received 231 (99.57%) of the electoral votes.
- 1852 – Franklin Pierce (D) received 254 (85.8%) of the electoral votes while Winfield Scott (Whig) received only 42 (14.2%).
- 1864 – Abraham Lincoln (R) received 212 (90.6%) of the electoral votes while George B. McClellan (D) received only 21 (9%).
- 1872 – Ulysses S. Grant (R) received 286 (81.9%) of the electoral votes while four candidates split the remaining 66 due to the death of Horace Greeley (D).
- 1912 – Woodrow Wilson (D) received 435 (81.9%) of the electoral votes while Theodore Roosevelt (Progressive) received 88 (16.6%) and William Howard Taft (R) received only 8 (1.5%)—the worst showing ever by an incumbent president. Wilson won just 41.8% of the popular vote in the three-way race, compared to 27.4% for Roosevelt and 23.2% for Taft.
- 1928 – Herbert Hoover (R) received 444 (83.6%) of the electoral votes while Al Smith (D) received only 87 (16.4%).
- 1932 – Franklin D. Roosevelt (D) received 472 (88.9%) of the electoral votes while Herbert Hoover (R) received only 59 (11.1%).
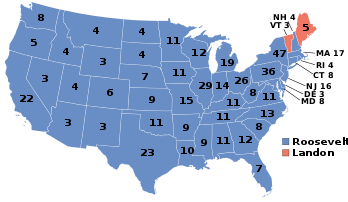
- 1936 – Franklin D. Roosevelt (D) received 523 (98.5%) of the electoral votes—the largest share since 1820—while Alf Landon (R) received only 8 (1.5%). Additionally, Roosevelt received 60.8% of the popular vote.
- 1940 – Franklin D. Roosevelt (D) received 449 (84.6%) of the electoral votes while Wendell Willkie (R) received only 82 (15.4%).
- 1944 – Franklin D. Roosevelt (D) received 432 (81.4%) of the electoral votes while Thomas E. Dewey (R) received only 99 (18.6%).
- 1952 – Dwight D. Eisenhower (R) received 442 (83.2%) of the electoral votes while Adlai Stevenson II (D) received only 89 (16.8%).
- 1956 – Dwight D. Eisenhower (R) received 457 (86.1%) of the electoral votes while Adlai Stevenson II (D) received only 73 (13.7%).
- 1964 – Lyndon B. Johnson (D) received 486 (90.3%) of the electoral votes while Barry Goldwater (R) received only 52 (9.7%). Additionally, Johnson received 61.1% of the popular vote, which still stands as the largest share since the national popular vote was first recorded in 1824.
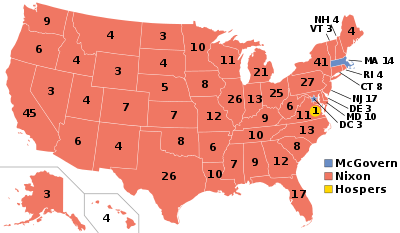
- 1972 – Richard Nixon (R) received 520 (96.7%) of the electoral votes while George McGovern (D) received only 17 (3.2%). One Republican elector voted for John Hospers of the Libertarian Party. Additionally, Nixon received 60.7% of the popular vote.
- 1980 – Ronald Reagan (R) received 489 (90.9%) of the electoral votes while Jimmy Carter (D) received only 49 (9.1%).
- 1984 – Ronald Reagan (R) received 525 (97.6%) of the electoral votes while Walter Mondale (D) received only 13 (2.4%).
See also
- Realigning election
- Wave election
- Blowout (sports)
- Landslide (board game)
References
- "Party Standings in the House of Commons (1867-date)". PARLINFO. Library of Parliament. 24 March 2016. Retrieved 5 April 2016.
- l'Intérieur, Ministère de. "Résultats de l'élection présidentielle 2002". Ministère de l'Intérieur (in French). Retrieved 2016-10-10.
- "Election to the 2nd German Bundestag on 6 September 1953". Bundeswahlleiter. 2015. Retrieved 31 March 2016.
- "Election to the 2nd German Bundestag on 15 September 1957". Bundeswahlleiter. 2015. Retrieved 31 March 2016.
- "Final result of the Election to the German Bundestag 2013". Bundeswahlleiter. 2015. Retrieved 31 March 2016.
- "Final result of the Election to the German Bundestag 2013". Bundeswahlleiter. 2015. Retrieved 31 March 2016.
- Electoral Commission (17 July 2014). Mixed Member Proportional Representation in New Zealand (Video). Wellington.
- "General elections 1890–1993 – seats won by party". Electoral Commission. 9 September 2013. Archived from the original on 30 December 2015. Retrieved 5 April 2016.
- "Official Count Results -- Overall Status". 2002 General Election – Official Results. Electoral Commission. 8 October 2002. Retrieved 5 April 2016.
- "Official Count Results -- Overall Status". 2014 General Election – Official Results. Electoral Commission. 10 October 2014. Retrieved 5 April 2016.
- "1906: The Liberal landslide". 9 February 2006 – via bbc.co.uk.
- Liberal Landslide: The General Election of 1906.
- Labour Landslide, July 5-19, 1945.
- Labour's Landslide: The British General Election 1997.
- "Boris Johnson must fulfil his One Nation pledge". Financial Times. 13 December 2019. Retrieved 2019-12-14.