Utah's 1st congressional district
| Utah's 1st congressional district | |
|---|---|
.tif.png) Utah's 1st congressional district - since January 3, 2013. | |
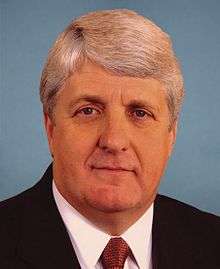
| Current Representative | Rob Bishop (R–Brigham City) |
| Cook PVI | R+26[1] |
Utah's 1st congressional district serves the northern area of Utah, including the cities of Ogden, Logan, Park City, Layton, Clearfield, and the northern half of the Great Salt Lake.
The current member of the United States House of Representatives from the district is Republican Rob Bishop.
President George W. Bush received 73% of the vote in this district in 2004. Scoring a Cook Partisan Voting Index (CPVI) of R+26 in 2004, the 1st Congressional District narrowly beat three other Congressional Districts which scored R+25 to become the most Republican district in the nation.[2]
Voting
Election results from presidential races[3]
| Year | Office | Result |
|---|---|---|
| 2000 | President | Bush 68 - 27% |
| 2004 | President | Bush 73 - 25% |
| 2008 | President | McCain 64 - 33% |
| 2012 | President | Romney 77 - 20% |
| 2016 | President | Trump 50 - 22% |
List of representatives
Until 1913, the district was the only district, elected statewide At-large.
District borders are periodically redrawn and some district residences may no longer be in this district.
| Representative | Party | Years | Congress | District Home | Occupation | Electoral history |
|---|---|---|---|---|---|---|
| District created March 4, 1913 | Districts were created from the former at-large district | |||||
 |
Republican | March 4, 1913 – March 3, 1917 |
63rd | Logan | Educator | First elected in 1902 (At-large district) Retired |
| 64th | ||||||
 |
Democratic | March 4, 1917 – March 3, 1921 |
65th | Farmington | Merchant | First elected in 1916 Retired to run for U.S. Senate |
| 66th | ||||||
 |
Republican | March 4, 1921 – March 3, 1933 |
67th | Vernal | Lawyer | First elected in 1920 Lost re-election |
| 68th | ||||||
| 69th | ||||||
| 70th | ||||||
| 71st | ||||||
| 72nd | ||||||
 |
Democratic | March 4, 1933 – January 3, 1941 |
73rd | Beaver | Lawyer | First elected in 1932 Retired to run for U.S. Senate |
| 74th | ||||||
| 75th | ||||||
| 76th | ||||||
 |
Democratic | January 3, 1941 – January 3, 1953 |
77th | Cedar City | Farmer | First elected in 1940 Retired to run for U.S. Senate |
| 78th | ||||||
| 79th | ||||||
| 80th | ||||||
| 81st | ||||||
| 82nd | ||||||
 |
Republican | January 3, 1953 – January 3, 1955 |
83rd | Draper | Newscaster | Elected in 1952 Renominated, but replaced on ballot due to personal scandal |
 |
Republican | January 3, 1955 – January 3, 1961 |
84th | Provo | Educator | First elected in 1954 Retired |
| 85th | ||||||
| 86th | ||||||
 |
Democratic | January 3, 1961 – January 3, 1963 |
87th | Ogden | Lawyer | Elected in 1960 Lost re-election |
 |
Republican | January 3, 1963 – January 3, 1971 |
88th | Ogden | Entrepreneur | First elected in 1962 Retired to run for U.S. Senate |
| 89th | ||||||
| 90th | ||||||
| 91st | ||||||
 |
Democratic | January 3, 1971 – January 3, 1981 |
92nd | Ogden | Educator | First elected in 1970 Lost re-election |
| 93rd | ||||||
| 94th | ||||||
| 95th | ||||||
| 96th | ||||||
 |
Republican | January 3, 1981 – January 3, 2003 |
97th | Farmington | Businessman | First elected in 1980 Retired |
| 98th | ||||||
| 99th | ||||||
| 100th | ||||||
| 101st | ||||||
| 102nd | ||||||
| 103rd | ||||||
| 104th | ||||||
| 105th | ||||||
| 106th | ||||||
| 107th | ||||||
 |
Republican | January 3, 2003 – Present |
108th | Brigham City | Educator | First elected in 2002 |
| 109th | ||||||
| 110th | ||||||
| 111th | ||||||
| 112th | ||||||
| 113th | ||||||
Election results
|
1912 • 1914 • 1916 • 1918 • 1920 • 1922 • 1924 • 1926 • 1928 • 1930 • 1932 • 1934 • 1936 • 1938 • 1940 • 1942 • 1944 • 1946 • 1948 • 1950 • 1952 • 1954 • 1956 • 1958 • 1960 • 1962 • 1964 • 1966 • 1968 • 1970 • 1972 • 1974 • 1976 • 1978 • 1980 • 1982 • 1984 • 1986 • 1988 • 1990 • 1992 • 1994 • 1996 • 1998 • 2000 • 2002 • 2004 • 2006 • 2008 • 2010 • 2012 • 2016 |
1912
Note: The 1912 election consisted of an all-party election to the two at-large seats. Howell was elected to the first at-large seat, while Johnson was elected to the second at-large seat.
| Party | Candidate | Votes | % | ||
|---|---|---|---|---|---|
| Republican | Joseph Howell | 43,133 | 19.45 | ||
| Republican | Jacob Johnson | 42,047 | 18.96 | ||
| Democratic | Mathonihah Thomas | 37,192 | 16.77 | ||
| Democratic | Tollman D. Johnson | 36,640 | 16.52 | ||
| Progressive | S.H. Love | 22,358 | 10.08 | ||
| Progressive | Lewis Larson | 21,934 | 9.89 | ||
| Socialist | Murray E. King | 8,971 | 4.05 | ||
| Socialist | William M. Knerr | 8,953 | 4.04 | ||
| Socialist Labor | Elias Anderson | 505 | 0.23 | ||
| Total votes | 221,733 | 100.0 | |||
| Republican win (new seat) | |||||
1914
| Party | Candidate | Votes | % | |
|---|---|---|---|---|
| Republican | Joseph Howell (incumbent) | 29,481 | 49.36 | |
| Democratic | Lewis Larson | 27,440 | 45.94 | |
| Socialist | Ben Jansen | 2,812 | 4.70 | |
| Total votes | 59,733 | 100.0 | ||
| Republican hold | ||||
1916
| Party | Candidate | Votes | % | |||
|---|---|---|---|---|---|---|
| Democratic | Milton H. Welling | 40,035 | 55.55 | |||
| Republican | Timothy C. Hoyt | 29,902 | 41.49 | |||
| Socialist | Daniel Konald | 2,134 | 2.96 | |||
| Total votes | 72,071 | 100.0 | ||||
| Democratic gain from Republican | ||||||
1918
| Party | Candidate | Votes | % | |
|---|---|---|---|---|
| Democratic | Milton H. Welling (incumbent) | 25,327 | 54.64 | |
| Republican | William Henry Wattis | 20,478 | 44.18 | |
| Socialist | Daniel N. Keef | 548 | 1.18 | |
| Total votes | 46,353 | 100.0 | ||
| Democratic hold | ||||
1920
| Party | Candidate | Votes | % | |||
|---|---|---|---|---|---|---|
| Republican | Don B. Colton | 42,249 | 57.49 | |||
| Democratic | James W. Funk | 28,160 | 38.32 | |||
| Farmer-Labor | John O. Watters | 3,083 | 4.19 | |||
| Total votes | 73,492 | 100.0 | ||||
| Republican gain from Democratic | ||||||
1922
| Party | Candidate | Votes | % | |
|---|---|---|---|---|
| Republican | Don B. Colton (incumbent) | 33,188 | 52.73 | |
| Democratic | Milton H. Welling | 27,801 | 44.17 | |
| Farmer-Labor | John O. Watters | 1,949 | 3.10 | |
| Total votes | 62,938 | 100.0 | ||
| Republican hold | ||||
1924
| Party | Candidate | Votes | % | |
|---|---|---|---|---|
| Republican | Don B. Colton (incumbent) | 40,883 | 54.86 | |
| Democratic | Frank Francis | 33,644 | 45.14 | |
| Total votes | 74,527 | 100.0 | ||
| Republican hold | ||||
1926
| Party | Candidate | Votes | % | |
|---|---|---|---|---|
| Republican | Don B. Colton (incumbent) | 44,007 | 61.44 | |
| Democratic | Ephraim Bergeson | 27,198 | 37.97 | |
| Socialist | John O. Watters | 426 | 0.59 | |
| Total votes | 71,631 | 100.0 | ||
| Republican hold | ||||
1928
| Party | Candidate | Votes | % | |
|---|---|---|---|---|
| Republican | Don B. Colton (incumbent) | 50,274 | 60.89 | |
| Democratic | Knox Patterson | 31,889 | 38.62 | |
| Socialist | John O. Watters | 408 | 0.49 | |
| Total votes | 82,571 | 100.0 | ||
| Republican hold | ||||
1930
| Party | Candidate | Votes | % | |
|---|---|---|---|---|
| Republican | Don B. Colton (incumbent) | 45,875 | 60.77 | |
| Democratic | Joseph Ririe | 29,210 | 38.70 | |
| Socialist | A. W. Clemons | 402 | 0.53 | |
| Total votes | 75,487 | 100.0 | ||
| Republican hold | ||||
1932
| Party | Candidate | Votes | % | |||
|---|---|---|---|---|---|---|
| Democratic | Abe Murdock | 47,774 | 51.59 | |||
| Republican | Don B. Colton (incumbent) | 44,827 | 48.41 | |||
| Total votes | 92,601 | 100.0 | ||||
| Democratic gain from Republican | ||||||
1934
| Party | Candidate | Votes | % | |
|---|---|---|---|---|
| Democratic | Abe Murdock (incumbent) | 55,800 | 64.43 | |
| Republican | Arthur Woolley | 29,878 | 34.51 | |
| Socialist | William J. McConnell | 644 | 0.74 | |
| Communist | Lawrence Mower | 279 | 0.32 | |
| Total votes | 86,601 | 100.0 | ||
| Democratic hold | ||||
1936
| Party | Candidate | Votes | % | |
|---|---|---|---|---|
| Democratic | Abe Murdock (incumbent) | 68,877 | 69.23 | |
| Republican | Charles W. Dunn | 30,415 | 30.57 | |
| Socialist | William J. McConnell | 202 | 0.20 | |
| Total votes | 99,494 | 100.0 | ||
| Democratic hold | ||||
1938
| Party | Candidate | Votes | % | |
|---|---|---|---|---|
| Democratic | Abe Murdock (incumbent) | 52,927 | 59.66 | |
| Republican | LeRoy B. Young | 35,790 | 40.34 | |
| Total votes | 88,717 | 100.0 | ||
| Democratic hold | ||||
1940
| Party | Candidate | Votes | % | |
|---|---|---|---|---|
| Democratic | Walter K. Granger | 62,654 | 57.13 | |
| Republican | LeRoy B. Young | 47,021 | 42.87 | |
| Total votes | 109,675 | 100.0 | ||
| Democratic hold | ||||
1942
| Party | Candidate | Votes | % | |
|---|---|---|---|---|
| Democratic | Walter K. Granger (incumbent) | 36,297 | 50.19 | |
| Republican | J. Bracken Lee | 36,028 | 49.81 | |
| Total votes | 72,325 | 100.0 | ||
| Democratic hold | ||||
1944
| Party | Candidate | Votes | % | |
|---|---|---|---|---|
| Democratic | Walter K. Granger (incumbent) | 59,755 | 57.79 | |
| Republican | B. H. Stringham | 43,642 | 42.21 | |
| Total votes | 103,397 | 100.0 | ||
| Democratic hold | ||||
1946
| Party | Candidate | Votes | % | |
|---|---|---|---|---|
| Democratic | Walter K. Granger (incumbent) | 44,888 | 50.06 | |
| Republican | David J. Wilson | 44,784 | 49.94 | |
| Total votes | 89,672 | 100.0 | ||
| Democratic hold | ||||
1948
| Party | Candidate | Votes | % | |
|---|---|---|---|---|
| Democratic | Walter K. Granger (incumbent) | 66,641 | 59.04 | |
| Republican | David J. Wilson | 46,229 | 40.96 | |
| Total votes | 112,870 | 100.0 | ||
| Democratic hold | ||||
1950
| Party | Candidate | Votes | % | |
|---|---|---|---|---|
| Democratic | Walter K. Granger (incumbent) | 54,161 | 51.08 | |
| Republican | Preston L. Jones | 51,868 | 48.92 | |
| Total votes | 106,029 | 100.0 | ||
| Democratic hold | ||||
1952
| Party | Candidate | Votes | % | |||
|---|---|---|---|---|---|---|
| Republican | Douglas R. Stringfellow | 76,545 | 60.54 | |||
| Democratic | Ernest R. McKay | 49,898 | 39.46 | |||
| Total votes | 126,443 | 100.0 | ||||
| Republican gain from Democratic | ||||||
1954
| Party | Candidate | Votes | % | |
|---|---|---|---|---|
| Republican | Henry Aldous Dixon | 55,542 | 53.37 | |
| Democratic | Walter K. Granger | 48,535 | 46.63 | |
| Total votes | 104,077 | 100.0 | ||
| Republican hold | ||||
1956
| Party | Candidate | Votes | % | |
|---|---|---|---|---|
| Republican | Henry Aldous Dixon (incumbent) | 74,107 | 60.92 | |
| Democratic | Carlyle F. Gronning | 47,533 | 39.08 | |
| Total votes | 121,640 | 100.0 | ||
| Republican hold | ||||
1958
| Party | Candidate | Votes | % | |
|---|---|---|---|---|
| Republican | Henry Aldous Dixon (incumbent) | 58,141 | 53.90 | |
| Democratic | M. Blaine Peterson | 49,735 | 46.10 | |
| Total votes | 107,876 | 100.0 | ||
| Republican hold | ||||
1960
| Party | Candidate | Votes | % | |||
|---|---|---|---|---|---|---|
| Democratic | M. Blaine Peterson | 65,939 | 50.03 | |||
| Republican | A. Walter Stevenson | 65,871 | 49.97 | |||
| Total votes | 131,810 | 100.0 | ||||
| Democratic gain from Republican | ||||||
1962
| Party | Candidate | Votes | % | |||
|---|---|---|---|---|---|---|
| Republican | Laurence J. Burton | 59,032 | 50.88 | |||
| Democratic | M. Blaine Peterson (incumbent) | 56,989 | 49.12 | |||
| Total votes | 116,021 | 100.0 | ||||
| Republican gain from Democratic | ||||||
1964
| Party | Candidate | Votes | % | |
|---|---|---|---|---|
| Republican | Laurence J. Burton (incumbent) | 75,986 | 55.97 | |
| Democratic | William G. Bruhn | 59,768 | 44.03 | |
| Total votes | 135,754 | 100.0 | ||
| Republican hold | ||||
1966
| Party | Candidate | Votes | % | |
|---|---|---|---|---|
| Republican | Laurence J. Burton (incumbent) | 99,750 | 66.50 | |
| Democratic | J. Keith Melville | 50,260 | 33.50 | |
| Total votes | 150,010 | 100.0 | ||
| Republican hold | ||||
1968
| Party | Candidate | Votes | % | |
|---|---|---|---|---|
| Republican | Laurence J. Burton (incumbent) | 139,456 | 68.12 | |
| Democratic | Richard J. Maughan | 65,265 | 31.88 | |
| Total votes | 204,721 | 100.0 | ||
| Republican hold | ||||
1970
| Party | Candidate | Votes | % | |||
|---|---|---|---|---|---|---|
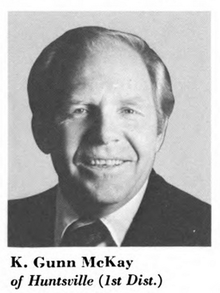
| Democratic | K. Gunn McKay | 95,499 | 51.27 | |||
| Republican | Richard Richards | 89,269 | 47.93 | |||
| American Independent | Daniel L. Worthington | 1,489 | 0.80 | |||
| Total votes | 186,257 | 100.0 | ||||
| Democratic gain from Republican | ||||||
1972
| Party | Candidate | Votes | % | |
|---|---|---|---|---|
| Democratic | K. Gunn McKay (incumbent) | 127,027 | 55.40 | |
| Republican | Robert K. Wolthuis | 96,296 | 42.00 | |
| American | L. S. Brown | 5,978 | 2.60 | |
| Total votes | 229,301 | 100.0 | ||
| Democratic hold | ||||
1974
| Party | Candidate | Votes | % | |
|---|---|---|---|---|
| Democratic | K. Gunn McKay (incumbent) | 124,793 | 62.63 | |
| Republican | Ronald W. Inkley | 62,807 | 31.52 | |
| American | L. S. Brown | 11,664 | 5.85 | |
| Total votes | 199,264 | 100.0 | ||
| Democratic hold | ||||
1976
| Party | Candidate | Votes | % | |
|---|---|---|---|---|
| Democratic | K. Gunn McKay (incumbent) | 155,631 | 58.17 | |
| Republican | Joe H. Ferguson | 106,542 | 39.83 | |
| American | Harry B. Gerlach | 5,358 | 2.00 | |
| Total votes | 267,531 | 100.0 | ||
| Democratic hold | ||||
1978
| Party | Candidate | Votes | % | |
|---|---|---|---|---|
| Democratic | K. Gunn McKay (incumbent) | 93,892 | 51.03 | |
| Republican | Jed J. Richardson | 85,028 | 46.21 | |
| American Independent | Robert Terrance Owens | 4,180 | 2.27 | |
| Independent | Dennis A. De Boer | 894 | 0.49 | |
| Total votes | 183,994 | 100.0 | ||
| Democratic hold | ||||
1980
| Party | Candidate | Votes | % | |||
|---|---|---|---|---|---|---|
| Republican | James V. Hansen | 157,111 | 52.10 | |||
| Democratic | K. Gunn McKay (incumbent) | 144,459 | 47.90 | |||
| Total votes | 301,570 | 100.0 | ||||
| Republican gain from Democratic | ||||||
1982
| Party | Candidate | Votes | % | |
|---|---|---|---|---|
| Republican | James V. Hansen (incumbent) | 111,416 | 62.80 | |
| Democratic | A. Stephen Dirks | 66,006 | 37.20 | |
| Total votes | 177,422 | 100.0 | ||
| Republican hold | ||||
1984
| Party | Candidate | Votes | % | |
|---|---|---|---|---|
| Republican | James V. Hansen (incumbent) | 142,952 | 71.22 | |
| Democratic | Milton C. Abrams | 56,619 | 28.21 | |
| Libertarian | Willy Marshall | 1,146 | 0.57 | |
| Total votes | 200,717 | 100.0 | ||
| Republican hold | ||||
1986
| Party | Candidate | Votes | % | |
|---|---|---|---|---|
| Republican | James V. Hansen (incumbent) | 82,151 | 51.56 | |
| Democratic | K. Gunn McKay | 77,180 | 48.44 | |
| Total votes | 159,331 | 100.0 | ||
| Republican hold | ||||
1988
| Party | Candidate | Votes | % | |
|---|---|---|---|---|
| Republican | James V. Hansen (incumbent) | 130,893 | 59.80 | |
| Democratic | K. Gunn McKay | 87,976 | 40.20 | |
| Total votes | 218,869 | 100.0 | ||
| Republican hold | ||||
1990
| Party | Candidate | Votes | % | |
|---|---|---|---|---|
| Republican | James V. Hansen (incumbent) | 82,746 | 52.15 | |
| Democratic | Kenley Brunsdale | 69,491 | 43.80 | |
| American | Reva Marx Wadsworth | 6,429 | 4.05 | |
| Total votes | 158,666 | 100.0 | ||
| Republican hold | ||||
1992
| Party | Candidate | Votes | % | |
|---|---|---|---|---|
| Republican | James V. Hansen (incumbent) | 160,037 | 65.25 | |
| Democratic | Ron Holt | 68,712 | 28.02 | |
| Independent | William J. "Dub" Lawrence | 16,505 | 6.73 | |
| Total votes | 245,254 | 100.0 | ||
| Republican hold | ||||
1994
| Party | Candidate | Votes | % | |
|---|---|---|---|---|
| Republican | James V. Hansen (incumbent) | 104,954 | 64.54 | |
| Democratic | Bobbie Coray | 57,664 | 35.46 | |
| Total votes | 162,618 | 100.0 | ||
| Republican hold | ||||
1996
| Party | Candidate | Votes | % | |
|---|---|---|---|---|
| Republican | James V. Hansen (incumbent) | 150,126 | 68.31 | |
| Democratic | Gregory J. Sanders | 65,866 | 29.97 | |
| Natural Law | Randall Tolpinrud | 3,787 | 1.72 | |
| Total votes | 219,779 | 100.0 | ||
| Republican hold | ||||
1998
| Party | Candidate | Votes | % | |
|---|---|---|---|---|
| Republican | James V. Hansen (incumbent) | 109,708 | 67.69 | |
| Democratic | Steve Beierlein | 49,307 | 30.42 | |
| Libertarian | Gerald A. Arthus | 3,070 | 1.89 | |
| Total votes | 162,085 | 100.0 | ||
| Republican hold | ||||
2000
| Party | Candidate | Votes | % | |
|---|---|---|---|---|
| Republican | James V. Hansen (incumbent) | 180,591 | 68.98 | |
| Democratic | Kathleen McConkie Collinwood | 71,229 | 27.21 | |
| Independent American | Hartley D. Anderson | 5,131 | 1.96 | |
| Libertarian | Dave Starr Seely | 3,151 | 1.20 | |
| Natural Law | Matthew D. Frandsen | 1,703 | 0.65 | |
| Total votes | 261,805 | 100.0 | ||
| Republican hold | ||||
2002
| Party | Candidate | Votes | % | |
|---|---|---|---|---|
| Republican | Rob Bishop | 109,265 | 60.90 | |
| Democratic | Dave Thomas | 66,104 | 36.84 | |
| Green | Craig Axford | 4,027 | 2.24 | |
| Write-ins | 16 | 0.01 | ||
| Total votes | 179,412 | 100.0 | ||
| Republican hold | ||||
2004
| Party | Candidate | Votes | % | |
|---|---|---|---|---|
| Republican | Rob Bishop (incumbent) | 199,615 | 67.91 | |
| Democratic | Steven Thompson | 85,630 | 29.13 | |
| Constitution | Charles Johnston | 4,510 | 1.53 | |
| Personal Choice | Richard W. Soderberg | 4,206 | 1.43 | |
| Total votes | 293,961 | 100.0 | ||
| Republican hold | ||||
2006
| Party | Candidate | Votes | % | |
|---|---|---|---|---|
| Republican | Rob Bishop (incumbent) | 112,546 | 63.06 | |
| Democratic | Steven Olsen | 57,922 | 32.45 | |
| Constitution | Mark Hudson | 5,539 | 3.10 | |
| Libertarian | Lynn Badler | 2,467 | 1.38 | |
| Total votes | 178,474 | 100.0 | ||
| Republican hold | ||||
2008
| Party | Candidate | Votes | % | |
|---|---|---|---|---|
| Republican | Rob Bishop (incumbent) | 196,799 | 64.85 | |
| Democratic | Morgan E. Bowen | 92,469 | 30.47 | |
| Constitution | Kirk D. Pearson | 7,397 | 2.44 | |
| Libertarian | Joseph Geddes Buchman | 6,780 | 2.23 | |
| Total votes | 303,445 | 100.0 | ||
| Republican hold | ||||
2010
| Party | Candidate | Votes | % | |
|---|---|---|---|---|
| Republican | Rob Bishop (incumbent) | 135,247 | 69.19 | |
| Democratic | Morgan E. Bowen | 46,765 | 23.93 | |
| Constitution | Kirk D. Pearson | 9,143 | 4.68 | |
| Libertarian | Jared Paul Stratton | 4,307 | 2.20 | |
| Total votes | 195,462 | 100.0 | ||
| Republican hold | ||||
2012
| Party | Candidate | Votes | % | |
|---|---|---|---|---|
| Republican | Rob Bishop (incumbent) | 161,546 | 71.50 | |
| Democratic | Donna McAleer | 55,740 | 24.70 | |
| Constitution | Sherry Phipps | 8,603 | 3.80 | |
| Total votes | 225,889 | 100.0 | ||
| Republican hold | ||||
2016
| Party | Candidate | Votes | % | |
|---|---|---|---|---|
| Republican | Rob Bishop (incumbent) | 182,928 | 65.9 | |
| Democratic | Peter C. Clemens | 73,381 | 26.4 | |
| Libertarian | Craig Bowden | 16,296 | 5.9 | |
| Unaffiliated | Chadwick H. Fairbanks III | 4,850 | 1.7 | |
| Total votes | 277,455 | 100.0 | ||
| Republican hold | ||||
Historical district boundaries
See also
References
- Martis, Kenneth C. (1989). The Historical Atlas of Political Parties in the United States Congress. New York: Macmillan Publishing Company.
- Martis, Kenneth C. (1982). The Historical Atlas of United States Congressional Districts. New York: Macmillan Publishing Company.
- Congressional Biographical Directory of the United States 1774–present
- ↑ "Partisan Voting Index – Districts of the 115th Congress" (PDF). The Cook Political Report. April 7, 2017. Retrieved April 7, 2017.
- ↑ About the Cook Report. What is the Cook Political Report?
- ↑ Presidential Election Results, by district, swingstateproject.com
- ↑ 1912 Election Results
- ↑ 1914 Election Results
- ↑ 1916 Election Results
- ↑ 1918 Election Results
- ↑ 1920 Election Results
- ↑ 1922 Election Results
- ↑ 1924 Election Results
- ↑ 1926 Election Results
- ↑ 1928 Election Results
- ↑ 1930 Election Results
- ↑ 1932 Election Results
- ↑ 1934 Election Results
- ↑ 1936 Election Results
- ↑ 1938 Election Results
- ↑ 1940 Election Results
- ↑ 1942 Election Results
- ↑ 1944 Election Results
- ↑ 1946 Election Results
- ↑ 1948 Election Results
- ↑ 1950 Election Results
- ↑ 1952 Election Results
- ↑ 1954 Election Results
- ↑ 1956 Election Results
- ↑ 1958 Election Results
- ↑ 1960 Election Results
- ↑ 1962 Election Results
- ↑ 1964 Election Results
- ↑ 1966 Election Results
- ↑ 1968 Election Results
- ↑ 1970 Election Results
- ↑ 1972 Election Results
- ↑ 1974 Election Results
- ↑ 1976 Election Results
- ↑ 1978 Election Results
- ↑ 1980 Election Results
- ↑ 1982 Election Results
- ↑ 1984 Election Results
- ↑ 1986 Election Results
- ↑ 1988 Election Results
- ↑ 1990 Election Results
- ↑ 1992 Election Results
- ↑ 1994 Election Results
- ↑ 1996 Election Results
- ↑ 1998 Election Results
- ↑ 2000 Election Results
- ↑ 2002 Election Results
- ↑ 2004 Election Results
- ↑ 2006 Election Results
- ↑ 2008 Election Results
- ↑ 2010 Election Results
- ↑
- ↑