St. John's South—Mount Pearl
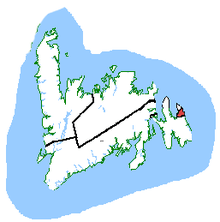 St. John's South—Mount Pearl in relation to other Newfoundland and Labrador ridings | |||
| Federal electoral district | |||
| Legislature | House of Commons | ||
| MP |
Liberal | ||
| District created | 2003 | ||
| First contested | 2004 | ||
| Last contested | 2015 | ||
| District webpage | profile, map | ||
| Demographics | |||
| Population (2011)[1] | 81,944 | ||
| Electors (2015) | 66,936 | ||
| Area (km²)[1] | 503 | ||
| Pop. density (per km²) | 162.9 | ||
| Census divisions | Division 1 | ||
| Census subdivisions | St. John's, Mount Pearl, Bay Bulls, Petty Harbour-Maddox Cove, Witless Bay | ||
St. John's South redirects here. For the provincial electoral district please see St. John's South (provincial electoral district)
St. John's South—Mount Pearl (French: St. John's-Sud—Mount Pearl; formerly St. John's South) is a federal electoral district in Newfoundland and Labrador, Canada, that has been represented in the House of Commons of Canada since 2004.
Demographics
Ethnic groups: 99.2% White
Languages: 98.7% English
Religions: 52.8% Catholic, 42.4% Protestant, 3.6% No affiliation
Average income: $25 379
Geography
The district includes the south end of the City of St. John's, the City of Mount Pearl, and the Town of Petty Harbour-Maddox Cove.
The neighbouring ridings are Avalon and St. John's East.
According to Elections Canada, the geographic boundaries of this riding for the 39th General Election are:
- "All that area consisting of:
- (a) that part of the City of St. John's lying southeasterly of the southeasterly limits of the towns of Conception Bay South and Paradise, and southeasterly of a line described as follows: commencing at the intersection of the westerly limit of the City of St. John's with Kenmount Road immediately north of the northwesterly limit of the City of Mount Pearl; thence northeasterly and easterly along said road, Freshwater Road and Longs Hill to Gower Street; thence northeasterly along said street to Kings Bridge Road; thence northerly along said road to Rennie's River; thence generally easterly along said river, Quidi Vidi Lake and the channel known locally as Quidi Vidi Gut to Quidi Vidi Harbour;
- (b) the City of Mount Pearl; and
- (c) the Town of Petty Harbour-Maddox Cove. Including all islands adjacent to the shoreline of the above-described area."
See also Elections Canada's map of the riding (.PDF).
History
The electoral district was created in 2003: 95.1% of the population of the riding came from St. John's West, and 4.9% from St. John's East ridings. As of the 2012 electoral redistribution, 5% of this riding will be moved to St. John's East, and it will gain 3% from Avalon.
The 2012 federal electoral boundaries redistribution concluded that the electoral boundaries of St. John's South—Mount Pearl should be adjusted, and a modified electoral district of the same name will be contested in future elections.[2] The redefined St. John's South—Mount Pearl had its boundaries legally defined in the 2013 representation order which came into effect upon the call of the 42nd Canadian federal election, scheduled for 19 October 2015.[3]
Members of Parliament
This riding has elected the following Members of Parliament:
| Parliament | Years | Member | Party | |
|---|---|---|---|---|
| St. John's South Riding created from St. John's West and St. John's East |
||||
| 38th | 2004–2006 | Loyola Hearn | Conservative | |
| St. John's South—Mount Pearl | ||||
| 39th | 2006–2008 | Loyola Hearn | Conservative | |
| 40th | 2008–2011 | Siobhán Coady | Liberal | |
| 41st | 2011–2015 | Ryan Cleary | New Democratic | |
| 42nd | 2015–Present | Seamus O'Regan | Liberal | |
Election results
St. John's South—Mount Pearl, 2013 Representation Order
| Canadian federal election, 2015 | ||||||||
|---|---|---|---|---|---|---|---|---|
| Party | Candidate | Votes | % | ±% | Expenditures | |||
| Liberal | Seamus O'Regan | 25,992 | 57.86 | +29.16 | $124,533.70 | |||
| New Democratic | Ryan Cleary | 16,467 | 36.76 | –9.58 | $98,225.69 | |||
| Conservative | Marek Krol | 2,047 | 4.57 | –19.64 | $24,331.40 | |||
| Green | Jackson McLean | 365 | 0.81 | +0.09 | – | |||
| Total valid votes/Expense limit | 44,801 | 100.00 | $201,093.98 | |||||
| Total rejected ballots | 133 | 0.30 | ||||||
| Turnout | 44,934 | 67.13 | ||||||
| Eligible voters | 66,936 | |||||||
| Liberal gain from New Democratic | Swing | +19.37 | ||||||
| Source: Elections Canada[4][5] | ||||||||
| 2011 federal election redistributed results[6] | |||
|---|---|---|---|
| Party | Vote | % | |
| New Democratic | 17,925 | 46.34 | |
| Liberal | 11,104 | 28.70 | |
| Conservative | 9,366 | 24.21 | |
| Green | 280 | 0.72 | |
| Others | 9 | 0.02 | |
St. John's South—Mount Pearl, 2003 Representation Order
| Canadian federal election, 2011 | ||||||||
|---|---|---|---|---|---|---|---|---|
| Party | Candidate | Votes | % | ±% | Expenditures | |||
| New Democratic | Ryan Cleary | 18,681 | 47.92 | +7.36 | $67,211.17 | |||
| Liberal | Siobhán Coady | 11,130 | 28.55 | -14.77 | $81,760.42 | |||
| Conservative | Loyola Sullivan | 8,883 | 22.79 | +10.24 | $78,347.37 | |||
| Green | Rick Austin | 291 | 0.75 | -1.11 | none listed | |||
| Total valid votes/Expense limit | 38,985 | 100.0 | – | $82,628.65 | ||||
| Total rejected, declined and unmarked ballots | 108 | 0.28 | +0.01 | |||||
| Turnout | 39,093 | 58.97 | +7.02 | |||||
| Eligible voters | 66,294 | |||||||
| New Democratic gain from Liberal | Swing | +11.06 | ||||||
| Sources:[7][8] | ||||||||
| Canadian federal election, 2008 | ||||||||
|---|---|---|---|---|---|---|---|---|
| Party | Candidate | Votes | % | ±% | Expenditures | |||
| Liberal | Siobhán Coady | 14,920 | 43.32 | +10.32 | $63,155.64 | |||
| New Democratic | Ryan Cleary | 13,971 | 40.56 | +18.87 | $18,947.03 | |||
| Conservative | Merv Wiseman | 4,324 | 12.55 | -32.13 | $63,115.88 | |||
| Green | Ted Warren | 643 | 1.86 | +1.23 | $172.03 | |||
| Newfoundland and Labrador First | Greg Byrne | 402 | 1.16 | – | $2,908.17 | |||
| Independent | Terry Christopher Butler | 179 | 0.51 | – | none listed | |||
| Total valid votes/Expense limit | 34,439 | 100.0 | – | $80,167 | ||||
| Total rejected, declined and unmarked ballots | 92 | 0.27 | -0.06 | |||||
| Turnout | 34,531 | 51.95 | ||||||
| Eligible voters | 66,467 | |||||||
| Liberal gain from Conservative | Swing | -4.28 | ||||||
| Canadian federal election, 2006 | ||||||||
|---|---|---|---|---|---|---|---|---|
| Party | Candidate | Votes | % | ±% | Expenditures | |||
| Conservative | Loyola Hearn | 16,644 | 44.68 | +5.11 | $67,639.04 | |||
| Liberal | Siobhán Coady | 12,295 | 33.00 | -2.26 | $68,791.05 | |||
| New Democratic | Peg Norman | 8,079 | 21.69 | -2.02 | $40,492.63 | |||
| Green | Barry Crozier | 235 | 0.63 | -0.83 | none listed | |||
| Total valid votes/Expense limit | 37,253 | 100.0 | – | $73,776 | ||||
| Total rejected, declined and unmarked ballots | 124 | 0.33 | +0.03 | |||||
| Turnout | 37,371 | 57.90 | +5.42 | |||||
| Eligible voters | 64,543 | |||||||
| Conservative hold | Swing | +3.68 | ||||||
St. John's South, 2003 Representation Order
| Canadian federal election, 2004 | ||||||||
|---|---|---|---|---|---|---|---|---|
| Party | Candidate | Votes | % | ±% | Expenditures | |||
| Conservative | Loyola Hearn | 13,330 | 39.57 | -16.27 | $63,090.26 | |||
| Liberal | Siobhán Coady | 11,879 | 35.26 | +4.91 | $63,121.27 | |||
| New Democratic | Peg Norman | 7989 | 23.71 | +10.31 | $36,839.75 | |||
| Green | Steve Willcott | 493 | 1.46 | – | $184.24 | |||
| Total valid votes/Expense limit | 33,691 | 100.0 | – | $72,104 | ||||
| Total rejected, declined and unmarked ballots | 103 | 0.30 | ||||||
| Turnout | 33,794 | 52.48 | -1.38 | |||||
| Eligible voters | 64,397 | |||||||
| Conservative notional gain from Progressive Conservative | Swing | -10.59 | ||||||
| Changes from 2000 are based on redistributed results. Change for the Conservatives is based on the combined totals of the Progressive Conservatives and the Canadian Alliance. | ||||||||
| 2000 federal election redistributed results | |||
|---|---|---|---|
| Party | Vote | % | |
| Progressive Conservative | 18,610 | 53.65 | |
| Liberal | 10,526 | 30.35 | |
| New Democratic | 4,647 | 13.40 | |
| Alliance | 761 | 2.19 | |
| Others | 142 | 0.41 | |
See also
References
- "(Code 10007) Census Profile". 2011 census. Statistics Canada. 2012. Retrieved 2011-03-03.
- 1 2 Statistics Canada: 2012
- ↑ Report – Newfoundland and Labrador
- ↑ Timeline for the Redistribution of Federal Electoral Districts
- ↑ "October 19, 2015 Election Results — St. John's South—Mount Pearl (Validated results)". Elections Canada. 21 October 2015. Retrieved 24 October 2015.
- ↑ Elections Canada – Preliminary Election Expenses Limits for Candidates
- ↑ Pundits' Guide to Canadian Elections
- ↑ Elections Canada – Official voting results, Forty-first general election, 2011
- ↑ Elections Canada – Candidate's electoral campaign return, 41st general election