Sackville—Preston—Chezzetcook
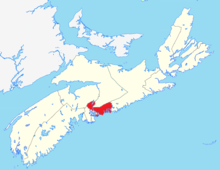 Sackville—Porters Lake in relation to the other Nova Scotia federal electoral districts (2003 boundaries) | |||
| Federal electoral district | |||
| Legislature | House of Commons | ||
| MP |
Liberal | ||
| District created | 1996 | ||
| First contested | 1997 | ||
| Last contested | 2015 | ||
| District webpage | profile, map | ||
| Demographics | |||
| Population (2016)[1] | 86,498 | ||
| Electors (2015) | 67,401 | ||
| Area (km²)[1] | 645 | ||
| Pop. density (per km²) | 134.1 | ||
| Census divisions | Halifax | ||
| Census subdivisions | Halifax | ||
Sackville—Preston—Chezzetcook (formerly known as Sackville—Eastern Shore and Sackville—Musquodoboit Valley—Eastern Shore) is a federal electoral district in Halifax, Nova Scotia, Canada, that has been represented in the House of Commons of Canada since 1997.
Demographics
| Historical population | ||
|---|---|---|
| Year | Pop. | ±% |
| 2001 | 84,209 | — |
| 2006 | 86,963 | +3.3% |
| 2011 (2003 redist.) | 91,266 | +4.9% |
| 2011 (2013 redist.) | 85,853 | −5.9% |
| 2016 | 86,498 | +0.8% |
From the 2006 census [2]
Ethnic groups:
Languages:
Religions:
- Protestant: 51.3%
- Catholic: 36.8%
- Other Christian: 1.2%
- No religious affiliation: 10.2%
Education:
- No certificate, diploma or degree: 22.7%
- High school certificate: 23.9%
- Apprenticeship or trade certificate or diploma: 13.0%
- Community college, CEGEP or other non-university certificate or diploma: 21.7%
- University certificate or diploma: 18.6%
Median Age:
- 38.4
Median total income:
- $29,212
Average total income:
- $34,589
Median household income:
- $64,588
Average household income:
- $72,245
Median family income:
- $71,566
Average family income:
- $78,873
Unemployment:
- 5.9%
Geography
The district includes the part of the Halifax Regional Municipality located on the Atlantic coast between Lake Charlotte and Jeddore Harbour in the east to Halifax Harbour in the west excluding the community of Dartmouth and the community of Eastern Passage. It also includes HRM's northern suburbs in the Sackville River valley north to the boundary with Hants County. The area is 1,328 km².
History
The electoral district was created in 1996 from Central Nova and Dartmouth ridings, and was known as "Sackville—Musquodoboit Valley—Eastern Shore" from 1999 to 2003. MP Peter Stoffer has tabled a Private Members Bill to change the name of the riding to "Sackville—Preston—Eastern Shore". As per the 2012 federal electoral redistribution, this riding will be largely dissolved into the new riding of Sackville—Preston—Chezzetcook (94%), with small portions going to Central Nova (4%) and Dartmouth—Cole Harbour (2%).
Members of Parliament
This riding has elected the following Members of Parliament:
| Parliament | Years | Member | Party | |
|---|---|---|---|---|
| Sackville—Musquodoboit Valley—Eastern Shore Riding created from Central Nova and Dartmouth |
||||
| 36th | 1997–2000 | Peter Stoffer | New Democratic | |
| 37th | 2000–2004 | |||
| Sackville—Eastern Shore | ||||
| 38th | 2004–2006 | Peter Stoffer | New Democratic | |
| 39th | 2006–2008 | |||
| 40th | 2008–2011 | |||
| 41st | 2011–2015 | |||
| Sackville—Preston—Chezzetcook | ||||
| 42nd | 2015–Present | Darrell Samson | Liberal | |
Election results
Sackville—Preston—Chezzetcook, 2013 Representation Order
| Canadian federal election, 2015 | ||||||||
|---|---|---|---|---|---|---|---|---|
| Party | Candidate | Votes | % | ±% | Expenditures | |||
| Liberal | Darrell Samson | 23,161 | 47.95 | +36.64 | $70,884.65 | |||
| New Democratic | Peter Stoffer | 16,613 | 34.39 | –19.90 | $56,102.19 | |||
| Conservative | Robert Strickland | 7,186 | 14.88 | –15.31 | $16,062.61 | |||
| Green | Mike Montgomery | 1,341 | 2.78 | –1.42 | $1,127.68 | |||
| Total valid votes/Expense limit | 48,301 | 100.00 | $201,426.67 | |||||
| Total rejected ballots | 180 | 0.37 | ||||||
| Turnout | 48,481 | 71.93 | ||||||
| Eligible voters | 67,401 | |||||||
| Liberal gain from New Democratic | Swing | +28.27 | ||||||
| Source: Elections Canada[3][4] | ||||||||
| 2011 federal election redistributed results[5] | |||
|---|---|---|---|
| Party | Vote | % | |
| New Democratic | 21,174 | 54.30 | |
| Conservative | 11,772 | 30.19 | |
| Liberal | 4,409 | 11.31 | |
| Green | 1,637 | 4.20 | |
| Others | 3 | 0.01 | |
Sackville—Eastern Shore, 2003 Representation Order
| Canadian federal election, 2011 | ||||||||
|---|---|---|---|---|---|---|---|---|
| Party | Candidate | Votes | % | ±% | Expenditures | |||
| New Democratic | Peter Stoffer | 22,483 | 54.07 | -7.36 | $41,167.28 | |||
| Conservative | Adam Mimnagh | 12,662 | 30.45 | +9.71 | $24,555.96 | |||
| Liberal | Scott Hemming | 4,673 | 11.24 | -1.46 | $18,619.07 | |||
| Green | John Percy | 1,762 | 4.24 | -0.91 | $828.54 | |||
| Total valid votes/Expense limit | 41,580 | 100.0 | $83,710.01 | |||||
| Total rejected, unmarked and declined ballots | 246 | 0.59 | +0.23 | |||||
| Turnout | 41,826 | 59.47 | +0.95 | |||||
| Eligible voters | 70,329 | |||||||
| New Democratic hold | Swing | -8.54 | ||||||
| Sources:[6][7] | ||||||||
| Canadian federal election, 2008 | ||||||||
|---|---|---|---|---|---|---|---|---|
| Party | Candidate | Votes | % | ±% | Expenditures | |||
| New Democratic | Peter Stoffer | 24,279 | 61.43 | +8.48 | $45,646.87 | |||
| Conservative | David Montgomery | 8,198 | 20.74 | -1.16 | $18,400.92 | |||
| Liberal | Carolyn Scott | 5,018 | 12.70 | -10.29 | $27,348.88 | |||
| Green | Noreen Hartlen | 2,034 | 5.15 | +2.90 | $399.04 | |||
| Total valid votes/Expense limit | 39,524 | 100.0 | $80,209 | |||||
| Total rejected, unmarked and declined ballots | 142 | 0.36 | +0.10 | |||||
| Turnout | 39,666 | 58.52 | -3.92 | |||||
| Eligible voters | 67,786 | |||||||
| New Democratic hold | Swing | +4.82 | ||||||
| Canadian federal election, 2006 | ||||||||
|---|---|---|---|---|---|---|---|---|
| Party | Candidate | Votes | % | ±% | Expenditures | |||
| New Democratic | Peter Stoffer | 22,848 | 52.95 | +7.18 | $55,364.52 | |||
| Liberal | Bill Fleming | 9,921 | 22.99 | -5.67 | $30,450.85 | |||
| Conservative | Paul Francis | 9,450 | 21.90 | +0.55 | $59,102.04 | |||
| Green | Richard MacDonald | 933 | 2.16 | -0.41 | none listed | |||
| Total valid votes/Expense limit | 43,152 | 100.0 | $75,334 | |||||
| Total rejected, unmarked and declined ballots | 125 | 0.29 | -0.17 | |||||
| Turnout | 43,277 | 62.44 | +1.89 | |||||
| Eligible voters | 69,311 | |||||||
| New Democratic hold | Swing | +6.42 | ||||||
| Canadian federal election, 2004 | ||||||||
|---|---|---|---|---|---|---|---|---|
| Party | Candidate | Votes | % | ±% | Expenditures | |||
| New Democratic | Peter Stoffer | 17,925 | 45.77 | +9.87 | $41,208.92 | |||
| Liberal | Dale Stevens | 11,222 | 28.66 | -4.40 | $51,797.99 | |||
| Conservative | Steve Streatch | 8,363 | 21.35 | -8.24 | $66,799.41 | |||
| Green | David Fullerton | 1,007 | 2.57 | – | none listed | |||
| Progressive Canadian | Greg Moors | 645 | 1.65 | – | none listed | |||
| Total valid votes/Expense limit | 39,162 | 100.0 | $72,023 | |||||
| Total rejected, unmarked and declined ballots | 181 | 0.46 | ||||||
| Turnout | 39,343 | 60.55 | +0.89 | |||||
| Eligible voters | 64,979 | |||||||
| New Democratic notional hold | Swing | +7.14 | ||||||
| Changes from 2000 are based on redistributed results. Conservative Party change is based on the combination of Canadian Alliance and Progressive Conservative Party totals. | ||||||||
| 2000 federal election redistributed results | |||
|---|---|---|---|
| Party | Vote | % | |
| New Democratic | 12,886 | 35.90 | |
| Liberal | 11,866 | 33.06 | |
| Progressive Conservative | 6,459 | 18.00 | |
| Alliance | 4,161 | 11.59 | |
| Others | 519 | 1.45 | |
Sackville—Musquodoboit Valley—Eastern Shore
| Canadian federal election, 2000 | ||||||||
|---|---|---|---|---|---|---|---|---|
| Party | Candidate | Votes | % | ±% | ||||
| New Democratic | Peter Stoffer | 13,619 | 34.48 | +4.11 | ||||
| Liberal | Bruce Stephen | 12,864 | 32.56 | +6.30 | ||||
| Progressive Conservative | Wade Marshall | 7,589 | 19.21 | -11.06 | ||||
| Alliance | Bill Stevens | 4,773 | 12.08 | -0.51 | ||||
| Marijuana | Melanie Patriquen | 658 | 1.67 | |||||
| Total valid votes | 39,503 | 100.00 | ||||||
Changes for the Canadian Alliance from 1997 are based on the results of its predecessor, the Reform Party.
| Canadian federal election, 1997 | ||||||||
|---|---|---|---|---|---|---|---|---|
| Party | Candidate | Votes | % | |||||
| New Democratic | Peter Stoffer | 12,433 | 30.37 | |||||
| Progressive Conservative | Ken Streatch | 12,392 | 30.27 | |||||
| Liberal | Beverley Peters | 10,750 | 26.26 | |||||
| Reform | Rob Cuthbert | 5,155 | 12.59 | |||||
| Natural Law | Bernard Wayne Gormley | 211 | 0.52 | |||||
| Total valid votes | 40,941 | 100.00 | ||||||
See also
References
- "(Code 12008) Census Profile". 2011 census. Statistics Canada. 2012. Retrieved 2011-03-03.
Notes
- 1 2 Statistics Canada: 2012
- ↑ http://www.bcstats.gov.bc.ca/data/cen06/profiles/detail_b/FED12008.pdf Sackville-Eastern Shore's census profile
- ↑ "October 19, 2015 Election Results — Sackville—Preston—Chezzetcook (Validated results)". Elections Canada. 21 October 2015. Retrieved 24 October 2015.
- ↑ Elections Canada – Preliminary Election Expenses Limits for Candidates
- ↑ Pundits' Guide to Canadian Elections
- ↑ Elections Canada – Official voting results, Forty-first general election, 2011
- ↑ Elections Canada – Candidate's electoral campaign return, 41st general election