Presentacion, Camarines Sur
| Presentacion | |
|---|---|
| Municipality | |
| Municipality of Presentacion | |
 | |
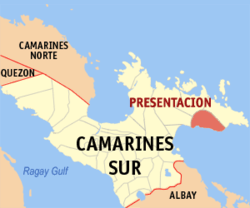 Map of Camarines Sur with Presentacion highlighted | |
.svg.png) Presentacion Location within the Philippines | |
| Coordinates: 13°43′N 123°45′E / 13.72°N 123.75°ECoordinates: 13°43′N 123°45′E / 13.72°N 123.75°E | |
| Country |
|
| Region | Bicol Region (Region V) |
| Province | Camarines Sur |
| District | 4th district |
| Barangays | 18 (see Barangays) |
| Government [1] | |
| • Type | Sangguniang Bayan |
| • Mayor | Manghay Deleña |
| • Vice Mayor | Emon Goyena |
| • Electorate | 13,520 voters (2016) |
| Area [2] | |
| • Total | 143.80 km2 (55.52 sq mi) |
| Population (2015 census)[3] | |
| • Total | 20,996 |
| • Density | 150/km2 (380/sq mi) |
| Time zone | UTC+8 (PST) |
| ZIP code | 4424 |
| PSGC | 051729000 |
| IDD : area code | +63 (0)54 |
| Climate type | Tropical rainforest climate |
| Income class | 4th municipal income class |
| Revenue (₱) | 70,351,983.32 (2016) |
| Poverty incidence | 48.81 (2012)[4] |
| Native languages |
Central Bikol Tagalog |
Presentacion, officially the Municipality of Presentacion, is a 4th class municipality in the province of Camarines Sur, Philippines. According to the 2015 census, it has a population of 20,996 people.[3]
It is formerly known as Parubcan.
Barangays
Presentacion is politically subdivided into 18 barangays.
- Ayugao
- Bagong Sirang
- Baliguian
- Bantugan
- Bicalen
- Bitaogan
- Buenavista
- Bulalacao
- Cagnipa
- Lagha
- Lidong
- Liwacsa
- Maangas
- Pagsangaan
- Patrociño (Dalhugan)
- Pili
- Sta. Maria (Poblacion)
- Tanauan
Demographics
| Population census of Presentacion | ||||||||||||||||||||||||||||||||||
|---|---|---|---|---|---|---|---|---|---|---|---|---|---|---|---|---|---|---|---|---|---|---|---|---|---|---|---|---|---|---|---|---|---|---|
|
| |||||||||||||||||||||||||||||||||
| Source: Philippine Statistics Authority[3][5][6][7] | ||||||||||||||||||||||||||||||||||
In the 2015 census, the population of Presentacion, Camarines Sur, was 20,996 people,[3] with a density of 150 inhabitants per square kilometre or 390 inhabitants per square mile.
Climate
| Climate data for Presentacion, Camarines Sur | |||||||||||||
|---|---|---|---|---|---|---|---|---|---|---|---|---|---|
| Month | Jan | Feb | Mar | Apr | May | Jun | Jul | Aug | Sep | Oct | Nov | Dec | Year |
| Average high °C (°F) | 30 (86) |
30 (86) |
32 (90) |
33 (91) |
35 (95) |
35 (95) |
35 (95) |
34 (93) |
35 (95) |
33 (91) |
31 (88) |
31 (88) |
33 (91) |
| Average low °C (°F) | 27 (81) |
27 (81) |
28 (82) |
30 (86) |
31 (88) |
31 (88) |
31 (88) |
30 (86) |
30 (86) |
29 (84) |
28 (82) |
28 (82) |
29 (85) |
| Average precipitation mm (inches) | 151.1 (5.949) |
198.89 (7.8303) |
106.28 (4.1843) |
60.08 (2.3654) |
63.62 (2.5047) |
85.76 (3.3764) |
117.53 (4.6272) |
46.99 (1.85) |
52.23 (2.0563) |
740.22 (29.1425) |
522.7 (20.579) |
618 (24.33) |
2,763.4 (108.7951) |
| Average rainy days | 24 | 28 | 18 | 23 | 23 | 25 | 29 | 21 | 26 | 28 | 29 | 31 | 305 |
| Source: World Weather Online[8] | |||||||||||||
See also
References
- ↑ "Municipality". Quezon City, Philippines: Department of the Interior and Local Government. Retrieved 31 May 2013.
- ↑ "Province: Camarines Sur". PSGC Interactive. Quezon City, Philippines: Philippine Statistics Authority. Retrieved 12 November 2016.
- 1 2 3 4 Census of Population (2015). "Region V (Bicol Region)". Total Population by Province, City, Municipality and Barangay. PSA. Retrieved 20 June 2016.
- ↑ "PSA Releases the 2012 Municipal and City Level Poverty Estimates". Quezon City, Philippines: Philippine Statistics Authority. Archived from the original on 28 January 2017. Retrieved 28 January 2017.
- ↑ Census of Population and Housing (2010). "Region V (Bicol Region)". Total Population by Province, City, Municipality and Barangay. NSO. Retrieved 29 June 2016.
- ↑ Censuses of Population (1903–2007). "Region V (Bicol Region)". Table 1. Population Enumerated in Various Censuses by Province/Highly Urbanized City: 1903 to 2007. NSO.
- ↑ "Province of Camarines Sur". Municipality Population Data. Local Water Utilities Administration Research Division. Retrieved 17 December 2016.
- ↑ "Presentacion, Camarines Sur: Average Temperatures and Rainfall". World Weather Online. Retrieved 29 October 2017.
External links
- Philippine Standard Geographic Code
- Philippine Census Information
- Official Site of the Province of Camarines Sur
Places adjacent to Presentacion, Camarines Sur | ||||||||||
|---|---|---|---|---|---|---|---|---|---|---|
| ||||||||||
Pili (capital) | |
| Municipalities | |
| Component city | |
| Independent component city |
|
This article is issued from
Wikipedia.
The text is licensed under Creative Commons - Attribution - Sharealike.
Additional terms may apply for the media files.