Pinamungajan
| Pinamungajan | |
|---|---|
| Municipality | |
| Municipality of Pinamungajan | |
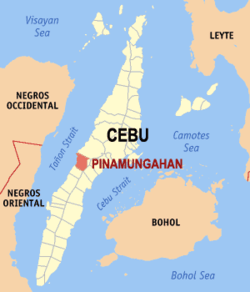 Map of Cebu with Pinamungajan highlighted | |
.svg.png) Pinamungajan Location within the Philippines | |
| Coordinates: 10°16′N 123°35′E / 10.27°N 123.58°ECoordinates: 10°16′N 123°35′E / 10.27°N 123.58°E | |
| Country |
|
| Region | Central Visayas (Region VII) |
| Province | Cebu |
| District | 3rd district of Cebu |
| Founded | 1815 |
| Barangays | 26 (see Barangays) |
| Government [1] | |
| • Type | Sangguniang Bayan |
| • Mayor | Glenn Baricuatro |
| • Vice Mayor | Maria Honeylette Lingad |
| • Congressman | Gwendolyn Garcia |
| • Electorate | 40,737 voters (2016) |
| Area [2] | |
| • Total | 109.16 km2 (42.15 sq mi) |
| Population (2015 census)[3] | |
| • Total | 65,955 |
| • Density | 600/km2 (1,600/sq mi) |
| Time zone | UTC+8 (PST) |
| ZIP code | 6039 |
| PSGC | 072237000 |
| IDD : area code | +63 (0)32 |
| Climate type | Tropical climate |
| Income class | 2nd municipal income class |
| Revenue (₱) | 126,849,798.20 (2016) |
| Native languages |
Cebuano Tagalog |
| Website |
pinamungajan |
Pinamungajan, officially the Municipality of Pinamungajan, (Cebuano: Lungsod sa Pinamungajan; Tagalog: Bayan ng Pinamungajan), is a 2nd class municipality in the province of Cebu, Philippines. According to the 2015 census, it has a population of 65,955 people.[3]
It is bordered to the north by the City of Toledo, to the west is the Tañon Strait, to the east is the city of Naga and the town of San Fernando, and to the south is the town of Aloguinsan.
The municipality, also known as Pinamungahan, was established in the 1815 under the Spanish colonial government in the country. The municipality got its name from the diligent and hardworking people, working hand-in-hand especially during the agricultural harvest season – "Pinamungajan", which originated from the Visayan word pinamuhuan, meant a worker share for his effort during a farm harvest. Over time the Pinamuhuan eventually changed to the current name of the municipality.
Barangays
Pinamungajan comprises 26 barangays:
| PSGC | Barangay | Population | ±% p.a. | |||
|---|---|---|---|---|---|---|
| 2015[3] | 2010[4] | |||||
| 072237001 | Anislag | 2.4% | 1,597 | 1,434 | 2.07% | |
| 072237002 | Anopog | 5.8% | 3,797 | 3,116 | 3.84% | |
| 072237003 | Binabag | 3.2% | 2,142 | 2,032 | 1.01% | |
| 072237004 | Buhingtubig | 2.7% | 1,763 | 1,691 | 0.80% | |
| 072237005 | Busay | 1.7% | 1,117 | 1,128 | −0.19% | |
| 072237006 | Butong | 3.1% | 2,035 | 1,848 | 1.85% | |
| 072237007 | Cabiangon | 1.5% | 1,000 | 891 | 2.22% | |
| 072237008 | Camugao | 3.1% | 2,048 | 2,007 | 0.39% | |
| 072237009 | Duangan | 2.1% | 1,400 | 1,264 | 1.96% | |
| 072237010 | Guimbawian | 2.9% | 1,894 | 1,698 | 2.10% | |
| 072237011 | Lamac | 9.0% | 5,953 | 4,470 | 5.61% | |
| 072237012 | Lut‑od | 4.7% | 3,112 | 2,213 | 6.71% | |
| 072237013 | Mangoto | 3.9% | 2,602 | 2,172 | 3.50% | |
| 072237014 | Opao | 0.8% | 503 | 511 | −0.30% | |
| 072237015 | Pandacan | 8.9% | 5,890 | 5,291 | 2.06% | |
| 072237016 | Poblacion | 10.2% | 6,754 | 5,925 | 2.52% | |
| 072237017 | Punod | 2.7% | 1,781 | 1,870 | −0.92% | |
| 072237018 | Rizal | 3.7% | 2,418 | 2,341 | 0.62% | |
| 072237019 | Sacsac | 2.3% | 1,533 | 1,415 | 1.54% | |
| 072237020 | Sambagon | 1.9% | 1,233 | 1,074 | 2.66% | |
| 072237021 | Sibago | 3.4% | 2,261 | 1,830 | 4.11% | |
| 072237022 | Tajao | 10.5% | 6,915 | 5,648 | 3.93% | |
| 072237023 | Tangub | 1.3% | 880 | 1,000 | −2.40% | |
| 072237024 | Tanibag | 3.0% | 2,002 | 1,686 | 3.32% | |
| 072237025 | Tupas | 1.3% | 864 | 817 | 1.07% | |
| 072237026 | Tutay | 3.7% | 2,461 | 2,625 | −1.22% | |
| Total | 65,955 | 57,997 | 2.48% | |||
Demographics
| Population census of Pinamungajan | ||
|---|---|---|
| Year | Pop. | ±% p.a. |
| 1903 | 11,435 | — |
| 1918 | 17,443 | +2.86% |
| 1939 | 22,327 | +1.18% |
| 1948 | 20,364 | −1.02% |
| 1960 | 22,092 | +0.68% |
| 1970 | 26,194 | +1.72% |
| 1975 | 27,075 | +0.67% |
| 1980 | 31,394 | +3.00% |
| 1990 | 40,026 | +2.46% |
| 1995 | 44,009 | +1.79% |
| 2000 | 51,715 | +3.52% |
| 2007 | 54,859 | +0.82% |
| 2010 | 57,997 | +2.04% |
| 2015 | 65,955 | +2.48% |
| Source: Philippine Statistics Authority[3][4][5][6] | ||
Tourist Attractions
- Campolabo Sandbar
- Hidden Valley Wave Pool Resort
- Odlom Falls
- Kamangon Cave
- Sinungkulan Falls
References
- ↑ "Municipality". Quezon City, Philippines: Department of the Interior and Local Government. Retrieved 31 May 2013.
- ↑ "Province: Cebu". PSGC Interactive. Quezon City, Philippines: Philippine Statistics Authority. Retrieved 12 November 2016.
- 1 2 3 4 Census of Population (2015). "Region VII (Central Visayas)". Total Population by Province, City, Municipality and Barangay. PSA. Retrieved 20 June 2016.
- 1 2 Census of Population and Housing (2010). "Region VII (Central Visayas)". Total Population by Province, City, Municipality and Barangay. NSO. Retrieved 29 June 2016.
- ↑ Censuses of Population (1903–2007). "Region VII (Central Visayas)". Table 1. Population Enumerated in Various Censuses by Province/Highly Urbanized City: 1903 to 2007. NSO.
- ↑ "Province of Cebu". Municipality Population Data. Local Water Utilities Administration Research Division. Retrieved 17 December 2016.
External links
Places adjacent to Pinamungajan | ||||||||||
|---|---|---|---|---|---|---|---|---|---|---|
| ||||||||||
Cebu City (capital) | |
| Municipalities |
|
| Component cities | |
| Highly urbanized cities | (Administratively independent from the province but grouped under Cebu by the Philippine Statistics Authority. However, qualified voters in Mandaue are allowed to vote in elections for Cebu provincial officials as part of the 6th Sangguniang Panlalawigan district.) |