List of largest power stations in the United States
This article lists the largest power stations in the United States, in terms of Terawatt-hours produced annually based on 2014 numbers. [1]
| Rank | Station | State | Annual generation (TWh) | Capacity (MW) | Type | Capacity factor % | Picture |
|---|---|---|---|---|---|---|---|
| 1. | Palo Verde | Arizona | 32.846 | 3,942 | Nuclear | 98 | |
| 2. | Browns Ferry | Alabama | 26.738 | 3,297 | Nuclear | 73.5 | 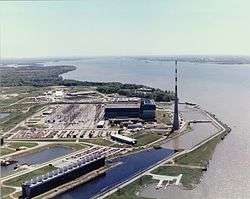 |
| 3. | Oconee | South Carolina | 21.193 | 2,500 | Nuclear | 92.5 | .jpg) |
| 4. | South Texas Nuclear Generating Station | Texas | 20.651 | 2,760 | Nuclear | 91.7 | |
| 5. | Grand Coulee Dam | Washington | 20.266 | 7,079 | Hydroelectric | 36[2] |  |
| 6. | Braidwood | Illinois | 20.263 | 2,500 | Nuclear | 94.1 | |
| 7. | West County Energy Center | Florida | 19.764 | 3,750[3] | Natural gas | 60 | |
| 8. | Byron Nuclear Generating Station | Illinois | 19.252 | 2,452 | Nuclear | 88.2 | |
| 9. | Limerick | Pennsylvania | 19.077 | 2,268 | Nuclear | 95.9 | 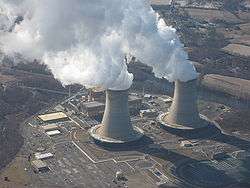 |
| 10. | Scherer Power Plant | Georgia | 18.894 | 3,520 | Coal | 61.2 | 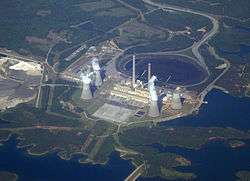 |
See also
- List of largest power stations in the world
- List of coal power stations
- List of power stations in the United States
- List of the largest nuclear power stations in the United States
- List of the largest coal power stations in the United States
- List of largest hydroelectric power stations in the United States
- Electricity sector of the United States
References
- ↑ Conca, James. "The Ten Biggest Power Plants In America -- Not What You Think". Forbes.com. Retrieved 2017-02-24.
- ↑ "Dams and Energy Sectors Interdependency Study" (PDF). Energy.gov. September 2011. Retrieved 2017-02-24.
- ↑ "FPL - Clean Energy - West County Energy Center". Fpl.com. Retrieved 2017-02-24.
This article is issued from
Wikipedia.
The text is licensed under Creative Commons - Attribution - Sharealike.
Additional terms may apply for the media files.