List of United States light rail systems by ridership
The following is a list of all light rail systems in the United States, ranked by ridership. Also included are those urban streetcar/trolley systems that are providing regular public transit service (i.e. operating year-round and at least five days/week). This list does not include statistics for metro/rapid transit systems (see: the List of United States rapid transit systems by ridership for those). Daily and annual ridership figures are based on "average weekday unlinked passenger trips" (where transfers between lines are counted as two separate passenger "boardings" or "trips"). The annual ridership figures for 2017 and average weekday ridership figures for the fourth quarter (Q4) of 2017 come from the American Public Transportation Association's (APTA) Ridership Reports statistics for the fourth quarter (Q4) of 2017,[1] unless otherwise noted (e.g. NJ Transit systems). References with supplementary (i.e. non-APTA) ridership figures are included in the System column.
List
| System | Largest city served |
Annual Ridership (2017)[1] |
Avg. daily weekday boardings (Q4 2017)[1] |
System length |
Avg. daily boardings per mile (Q4 2016) |
Year opened |
Stations | Lines | Year last expanded | |
|---|---|---|---|---|---|---|---|---|---|---|
| 1 | Metro Rail light rail:[note 1] Blue, Expo, Gold & Green Lines |
Los Angeles | 67,921,600 | 219,900 | 88.1 miles (141.8 km)[2] | 2,496 | 1990[2] | 80[2] | 4[2] | 2016[2] |
| 2 | MBTA light rail:[note 1] Green Line & Ashmont–Mattapan High Speed Line[note 2] |
Boston | 67,029,600 | 204,000 | 26 miles (42 km)[3] | 7,846 | 1897;[4] 1929 |
74[3] | 5[3] | 2004; n/a |
| 3 | Muni Metro[note 1][5] (incl. E Embarcadero[note 2] & F Market[6][7][note 2]) |
San Francisco | 51,482,600 | 162,500 | 35.7 miles (57.5 km)[8] | 4,552 | 1912;[9] 1980[8] |
152[7][8] | 9[6][8] | 2007 |
| 4 | MAX Light Rail[note 3] | Portland | 49,173,700 | 119,700 | 60 miles (97 km) | 1,995 | 1986 | 97 | 5 | 2015 |
| 5 | San Diego Trolley[note 3] (incl. Silver Line[10][note 2]) |
San Diego | 37,215,800 | 112,100 | 53.5 miles (86.1 km)[11] | 2,095 | 1981[11] | 53[11] | 4[10][11] | 2005[11] |
| 6 | DART[note 3] | Dallas | 29,759,200 | 98,700 | 93 miles (150 km)[12] | 1,061 | 1996[13] | 64[12] | 4[14] | 2016[13] |
| 7 | Denver RTD:[note 3] C, D, E, F, H, R, W, and L |
Denver | 24,871,200 | 67,500 | 58.5 miles (94.1 km)[15] | 1,153 | 1994[16] | 62[15] | 8 | 2017[17] |
| 8 | SEPTA light rail:[18][note 1] Subway–Surface Lines, Suburban Trolley Lines & Girard Ave Trolley[note 2] |
Philadelphia | 24,243,200 | 80,100 | 68.4 miles (110.1 km)[19][20] | 1,171 | 1906 | >100[19] | 8[19][20] | 2005 |
| 9 | METRO Light Rail[note 3] | Minneapolis-St. Paul | 23,811,200 | 71,900 | 21.8 miles (35.1 km)[21][22] | 3,298 | 2004[21] | 37[21][22] | 2[21][22] | 2014[22] |
| 10 | Central Link[note 3] | Seattle | 23,186,633[23] | 71,058[23] | 20.4 miles (32.8 km)[24] | 3,483 | 2009 | 16[24] | 1[24] | 2016[25] |
| 11 | TRAX (UTA) and S Line[note 3] | Salt Lake City | 18,823,500 | 63,000 | 46.8 miles (75.3 km)[26][27] | 1,346 | 1999[28] | 56[29] | 4[29] | 2013 |
| 12 | METRORail | Houston | 18,808,000 | 61,100 | 23.8 miles (38.3 km)[30][31] | 2,567 | 2004[31] | 44[30] | 3[30] | 2017[30] |
| 13 | Valley Metro Rail[32] | Phoenix | 16,269,000 | 48,900 | 26.3 miles (42.3 km)[33] | 1,859 | 2008[34] | 35[35] | 1[34] | 2016[36] |
| 14 | Hudson–Bergen Light Rail [note 1][37] |
Jersey City | 15,476,386[37] | 51,939[37] | 17 miles (27 km)[37] | 3,055 | 2000 | 24[38] | 3[38] | 2011 |
| 15 | MetroLink | St. Louis | 14,115,400 | 41,400 | 46 miles (74 km)[39] | 900 | 1993[40] | 37[39] | 2[41] | 2006[42] |
| 16 | Sacramento RT Light Rail | Sacramento | 11,216,500 | 37,800 | 42.9 miles (69.0 km)[43] | 881 | 1987[43] | 53[43] | 3[43] | 2015[43] |
| 17 | Santa Clara VTA Light Rail[note 3] |
San Jose | 8,669,600 | 26,900 | 42.2 miles (67.9 km)[44] | 637 | 1987[44] | 62[44] | 3[44] | 2005[44] |
| 18 | RTA Streetcars in New Orleans[note 2] |
New Orleans | 8,097,500 | 20,400 | 26.9 miles (43.3 km)[45] | 914 | 1835 | streetcar-like surface stops | 5[45] | 2018[45][46] |
| 19 | The T: Pittsburgh Light Rail |
Pittsburgh | 7,751,500 | 21,237[note 4] | 26.2 miles (42.2 km)[47] | 811 | 1984[note 5] | 53[47] | 2[47] | 2012[47] |
| 20 | Baltimore Light Rail[note 1] | Baltimore | 7,353,900 | 23,900 | 33 miles (53 km)[48] | 724 | 1992 | 33[48] | 3[48] | 1997 |
| 21 | San Francisco cable car system[note 2][note 6] |
San Francisco | 5,799,300 | 14,300 | 5.2 miles (8.4 km) | 2,750 | 1878[49] | streetcar-like surface stops | 3[7][50] | 1952 |
| 22 | Newark Light Rail[note 1][37] | Newark | 5,531,921[37] | 19,573[37] | 6.2 miles (10.0 km)[37] | 3,157 | 1935 | 16[38] | 2[38] | 2006 |
| 23 | Charlotte Area Transit System: Blue and Gold Lines |
Charlotte | 5,228,500 | 16,900 | 20.8 miles (33.5 km)[51][52] | 813 | 2007[53] | 31[51][52] | 2[51] | 2018[54] |
| 24 | Portland Streetcar[note 7] | Portland | 4,710,854[55][note 8] | 12,906[note 4][55][note 9] | 7.35 miles (11.83 km)[56] | 1,756 | 2001[56] | 76[56] | 2[56] | 2015[57] |
| 25 | Buffalo Metro Rail | Buffalo | 4,560,600 | 16,900 | 6.4 miles (10.3 km) | 2,641 | 1984 | 14[58] | 1[58] | n/a |
| 26 | River LINE[note 1][37] | Trenton- Camden |
2,713,160[37] | 8,633[37] | 34 miles (55 km)[37] | 254 | 2004 | 20[59] | 1[59] | 2013 |
| 27 | SPRINTER[note 3][60] | Oceanside -Escondido |
2,570,700 | 8,600 | 22 miles (35 km)[61] | 391 | 2008[61] | 15[61] | 1[61] | n/a |
| 28 | RTA Rapid Transit:[note 10] Blue and Green Lines |
Cleveland | 2,114,200 | 5,792[note 4] | 15.3 miles (24.6 km)[62] | 379 | 1913[63] | 34[62] | 2[62] | 1996[63] |
| 29 | KC Streetcar | Kansas City | 2,060,327[64] | 5,645[64][note 4] | 2.2 miles (3.5 km) | 2,566 | 2016 | 16[65] | 1 | n/a |
| 30 | Seattle Streetcar[note 3] | Seattle | 1,417,500 | 4,800 | 3.8 miles (6.1 km) | 1,263 | 2007 | 21 | 2 | 2016 |
| 31 | Q-Line | Detroit | 1,350,000 [66] | 3,699 [note 4][66] | 3.3 miles (5.3 km) | 1,121 | 2017 | 20 | 1 | n/a |
| 32 | Tide Light Rail | Norfolk | 1,308,700 | 4,100 | 7.4 miles (11.9 km)[67] | 554 | 2011[68] | 11[67] | 1[67] | n/a |
| 33 | DC Streetcar | Washington, D.C. | 1,184,800 | 3,700 | 2.4 miles (3.9 km) | 1,542 | 2016 | 8 | 1 | n/a |
| 34 | Tacoma Link[note 3] | Tacoma | 972,405[23] | 3,427[23] | 1.6 miles (2.6 km)[24] | 2,142 | 2003 | 5[24] | 1[24] | n/a[25] |
| 35 | Sun Link | Tucson | 900,539[69] | 2,467[69] | 3.9 miles (6.3 km)[70] | 632 | 2014 | 22[70] | 1[70] | n/a |
| 36 | Cincinnati Bell Connector[71] | Cincinnati | 578,641[72] | 1,585 [note 4][72] | 3.6 miles (5.8 km)[73] | 449 | 2016[74] | 18[73] | 1 | n/a |
| 37 | Atlanta Streetcar | Atlanta | 429,500 | 900 | 2.7 miles (4.3 km) | 333 | 2014 | 12 | 1 | n/a |
| 38 | TECO Line Streetcars[note 2] | Tampa | 282,100 | 400 | 2.7 miles (4.3 km)[75] | 148 | 2002 | 11[76] | 1[76] | 2010 |
| 39 | Dallas Streetcar | Dallas | 158,000[77] | 600 [77] | 2.45 miles (3.94 km) | 245 | 2015 | 6 | 1 | 2016 |
Gallery
 MBTA Green Line
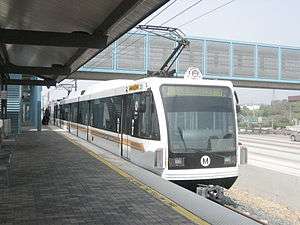 LACMTA Gold Line
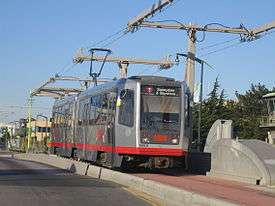 Muni Metro's T Third line
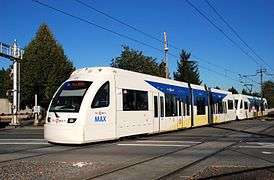
 DART Green Line
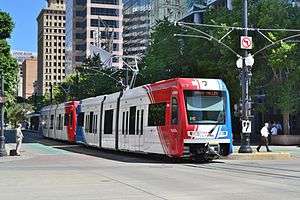
 METRO Blue Line
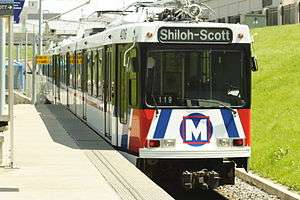 St. Louis MetroLink Train
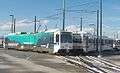
.jpg)
 Houston METRORail Red Line
.jpg) Seattle Link Light Rail
Seattle Link Light Rail Seattle Streetcar South Lake Union Line
Systems excluded from ridership table
The following light rail systems have been excluded from the ridership table above:
| System | Largest city served | Opened | Route length | Reason(s) for exclusion from Ridership table |
|---|---|---|---|---|
| Galveston Island Trolley | Galveston, TX | 1988[78] | 6.8 miles (10.9 km)[78] | Galveston's heritage streetcar trolley system is non-operational – it has suspended its service since September 2008 due to damage from Hurricane Ike. |
| Kenosha Streetcars | Kenosha, WI | 2000[79] | 2.0 miles (3.2 km)[79] | This heritage streetcar system is primarily a tourist system (e.g. does not operate daily, year-round), rather than a transit system; Kenosha's transit systems are too small to be tracked by APTA. |
| Metro Streetcar | Little Rock, AR | 2004[80] | 3.4 miles (5.5 km)[80] | This heritage streetcar system is primarily a tourist system, rather than a transit system; APTA does not provide ridership figures for this system. |
| River Street Streetcar | Savannah, GA | 2009 | 1.0 mile (1.6 km) | This heritage streetcar system is primarily a tourist system, rather than a transit system; APTA does not track this system. |
See also
- Light rail in the United States
- Light rail
- List of North American light rail systems by ridership
- Light rail in North America
- Streetcars in North America
- List of tram and light rail transit systems
- List of rail transit systems in the United States
- List of United States rapid transit systems by ridership
- List of North American rapid transit systems by ridership
- List of Latin American rail transit systems by ridership
- List of United States commuter rail systems by ridership
- List of United States local bus agencies by ridership
- Public transportation
Notes
- 1 2 3 4 5 6 7 8 This system also has a heavy rail rapid transit/metro portion (see List of metro systems), and connections to a commuter rail system; the ridership figures and statistics presented here represent the light rail portion of the system only.
- 1 2 3 4 5 6 7 8 This line or system is operated using heritage streetcars.
- 1 2 3 4 5 6 7 8 9 10 11 This system also has available connections to a commuter rail system; the ridership figures and statistics presented here represent the light rail portion of the system only.
- 1 2 3 4 5 6 This is the Average Daily Ridership figure, not an "Average Weekday Ridership" figure – it is averaged from the 2017 Total Ridership figure for this system.
- ↑ As current incarnation of light rail.
- ↑ May or may not qualify as "light rail" (or as a true "mass transit" system), but is included in this table for comparison purposes (and due to its ridership statistics being tracked by APTA).
- ↑ This system is owned by the City of Portland, which is not a member of APTA, and its ridership figures are not included in the APTA statistics for Portland.
- ↑ This annual ridership figure is for Fiscal Year 2017.
- ↑ FY2017
- ↑ This system also has a heavy rail rapid transit/metro portion (see List of metro systems); the ridership figures and statistics presented here represent the light rail portion of the system only.
References
- 1 2 3 "Transit Ridership Report Fourth Quarter 2017" (PDF). American Public Transportation Association. March 13, 2018. Retrieved 2017-05-14 – via http://www.apta.com/resources/statistics/Pages/ridershipreport.aspx.
- 1 2 3 4 5 "Metro – Facts at a Glance". Los Angeles County Metropolitan Transportation Authority (Metro). November 18, 2016. Retrieved 2017-05-19.
- 1 2 3 "About the T – Financials – Appendix: Statistical Profile" (PDF). Massachusetts Bay Transportation Authority. 2007. pp. 103–104. Retrieved 2013-07-13.
- ↑ "MTBA – About the MTBA – History – The Rapid Transit Commission and the BERY". Massachusetts Bay Transportation Authority. 2013. Retrieved 2013-08-07.
- ↑ "TEP Route Data & Proposed Changes". San Francisco Municipal Transportation Agency (SFMTA). Retrieved 2013-12-15.
- 1 2 "F Market & Wharves | SFMTA". San Francisco Municipal Transportation Agency. 2013. Retrieved 2013-08-25.
- 1 2 3 "Rider Information – Market Street Railway". Market Street Railway. Retrieved 2013-08-18.
- 1 2 3 4 "Muni Metro Light Rail | SFMTA". San Francisco Municipal Transportation Agency. 2013. Retrieved 2013-06-30.
- ↑ McKane, John; Perles, Anthony (1982). Inside Muni: The Properties and Operations of the Municipal Railway of San Francisco. Glendale, CA: Interurban Press. p. 174. ISBN 978-0-916374-49-5.
- 1 2 "Vintage Trolley". San Diego Metropolitan Transit System. Retrieved 2015-12-30.
- 1 2 3 4 5 "San Diego Trolley Fact Sheet" (PDF). San Diego Metropolitan Transit System. February 2013. Retrieved 2015-12-30 – via http://www.sdmts.com/about-mts.
- 1 2 "Facts about Dallas Area Rapid Transit (DART)". Dallas Area Rapid Transit. February 26, 2013. Retrieved 2013-07-23.
- 1 2 "DART.org – DART History". Dallas Area Rapid Transit. 2015. Retrieved 2015-01-12.
- ↑ "DART.org – DART Schedules". Dallas Area Rapid Transit. 2013. Retrieved 2013-08-25.
- 1 2 "RTD – Facts & Figures". Regional Transportation District. February 2017. Retrieved 2017-04-17.
- ↑ "RTD – Facts & Figures – Central Corridor Light Rail Line". Regional Transportation District. January 2013. Retrieved 2013-07-23.
- ↑ "FasTracks: R Line". Regional Transportation District. February 2017. Retrieved 2017-06-28.
- ↑ "SEPTA – Trolley Lines". Southeastern Pennsylvania Transportation Authority. Retrieved 2013-06-28.
- 1 2 3 "SEPTA – Spring 2012 Route Statistics" (PDF). Southeastern Pennsylvania Transportation Authority. 2012. Archived from the original (PDF) on 2013-05-24. Retrieved 2013-06-28.
- 1 2 "SEPTA – Media Guide" (PDF). Southeastern Pennsylvania Transportation Authority. 2013. Retrieved 2013-07-17.
- 1 2 3 4 "METRO Blue Line – Facts About Trains and Construction". Metro Transit. 2013. Archived from the original on 2014-02-14. Retrieved 2014-06-15.
- 1 2 3 4 "Metro Green Line Fact Sheet". Metropolitan Council. June 14, 2014. Retrieved 2014-06-15.
- 1 2 3 4 Fourth Quarter 2017 Service Delivery Quarterly Performance Report (PDF) (Report). Sound Transit. February 22, 2018. Retrieved 2018-05-14.
- 1 2 3 4 5 6 "Schedules – SoundTransit". Sound Transit. 2016. Retrieved 2016-03-29.
- 1 2 Lindblom, Mike (September 22, 2016). "Angle Lake Station Opens Saturday with celebration". The Seattle Times. Retrieved November 2, 2017.
- ↑ "Front Lines 2015 Map" (PDF). Utah Transit Authority. Archived from the original (PDF) on 2013-11-25. Retrieved 2013-07-02.
- ↑ Vo-Duc, Viviane (5 September 2013). "New streetcar S-line set to open Dec. 8 in Sugar House". deseretnews.com.
- ↑ "UTA History – Fact Sheet History 2012" (PDF). Utah Transit Authority. April 2013. Retrieved 2013-08-11.
- 1 2 "TRAX and FrontRunner Map". Utah Transit Authority. Archived from the original (PDF) on 2013-06-20. Retrieved 2013-08-25.
- 1 2 3 4 "METRORail". Metropolitan Transit Authority of Harris County, Texas. 2015-10-07. Retrieved 2015-08-11.
- 1 2 "Houston Facts 2014" (PDF). METRO. 2014. Retrieved 2015-08-11.
- ↑ "Ridership Reports". Valley Metro. 2013. Retrieved 2013-12-30.
- ↑ "Northwest Light Rail Extension Opens". Valley Metro. Mar 19, 2016. Retrieved Mar 29, 2016.
- 1 2 "Light Rail System 2011 Facts and Figures" (PDF). Valley Metro. August 14, 2012. Archived from the original (PDF) on June 3, 2013. Retrieved 2013-07-15.
- ↑ "Valley Metro Expands Safe Place". Valley Metro. Mar 21, 2016. Retrieved Mar 29, 2016.
- ↑ "Northwest light rail extension opens in Phoenix Saturday". Azcentral.com. Retrieved 2017-01-24.
- 1 2 3 4 5 6 7 8 9 10 11 12 "NJ TRANSIT FACTS AT A GLANCE Fiscal Year 2017". New Jersey Transit. Retrieved 2018-05-14.
- 1 2 3 4 "Hudson-Bergen – Light Rail" (PDF). NJ Transit. March 2013. Retrieved 2013-07-14.
- 1 2 "Procurement Information". Bi-State Development Agency (Metro). 2010. Archived from the original on 2013-08-18. Retrieved 2013-08-11.
- ↑ "History – The 1990s – MetroLink". Bi-State Development Agency (Metro). 2010. Archived from the original on 2013-08-23. Retrieved 2013-08-11.
- ↑ "Procurement Information" (PDF). Bi-State Development Agency (Metro). Archived from the original (PDF) on 2016-03-28. Retrieved 2013-08-25.
- ↑ "History – 2000 to Today – MetroLink". Bi-State Development Agency (Metro). 2010. Retrieved 2013-08-25.
- 1 2 3 4 5 "Sacramento Regional Transit District: Fact Sheet" (PDF). Sacramento Regional Transit District. May 2016. Retrieved 2016-06-22.
- 1 2 3 4 5 "VTA Facts: Light Rail System Overview" (PDF). Santa Clara Valley Transportation Authority (VTA). November 14, 2012. Archived from the original (PDF) on August 20, 2013. Retrieved 2013-06-30.
- 1 2 3 "Agency Profile: New Orleans Regional Transit Authority" (PDF). National Transit Database. 2016. Retrieved 2018-10-05.
- ↑ "RTA will open its Cemeteries Transit Center to streetcars this Sunday". Curbed New Orleans. Retrieved 2018-10-05.
- 1 2 3 4 "Port Authority of Allegheny County – Company Info & Projects – Agency Profile". Port Authority of Allegheny County (PAT). 2013. Retrieved 2013-07-15.
- 1 2 3 "Visitors Ride Guide" (PDF). Maryland Transit Administration. Retrieved 2013-07-14 – via http://mta.maryland.gov/content/visitors.
- ↑ "Cable Cars | SFMTA". San Francisco Municipal Transportation Agency. 2013. Retrieved 2013-06-30.
- ↑ "Routes & Stops | SFMTA – Cable Cars". San Francisco Municipal Transportation Agency. 2013. Retrieved 2013-08-25.
- 1 2 3 "LYNX Home". Charlotte Area Transit System (CATS). Retrieved 2013-08-07.
- 1 2 "LYNX Blue Line Extension Service Update". City of Charlotte Government.
- ↑ "LYNX Blue Line Recognizes Ridership Success During Week of Five-Year Anniversary". Charlotte Area Transit System (CATS). November 28, 2012. Retrieved 2013-08-07.
- ↑ Becker, Mark (16 March 2018). "LYNX BLUE LINE OPENS: Riders pack Blue Line Extension from uptown to UNCC".
- 1 2 "Portland Streetcar Ridership Counts July 2015 - Present (By Fiscal Year)" (PDF). Portland Streetcar. April 2018. Retrieved 2018-05-14.
- 1 2 3 4 "Streetcar History | Portland Streetcar". Portland Streetcar, Inc. 2012. Archived from the original on 2013-12-03. Retrieved 2013-11-28.
- ↑ "Loop Service - Portland Streetcar". 6 August 2015.
- 1 2 "Metro Rail 7 Day Timetable" (PDF). NTFA-Metro. July 2, 2013. Archived from the original (PDF) on October 2, 2013. Retrieved 2013-08-07.
- 1 2 "River Line – Light Rail" (PDF). NJ Transit. March 2013. Retrieved 2013-07-14.
- ↑ "SPRINTER Fact Sheet" (PDF). North County Transit District. January 2013. Retrieved 2013-07-28.
- 1 2 3 4 "Nctd sprinter". North County Transit District (San Diego). 2013. Retrieved 2013-06-30.
- 1 2 3 "2012 Annual Report – Greater Cleveland Regional Transit Authority". Greater Cleveland Regional Transit Authority. December 31, 2012. Retrieved 2013-07-21.
- 1 2 "About RTA: History of Public Transit in Greater Cleveland". Greater Cleveland Regional Transit Authority. 2012. Retrieved 2013-07-21.
- 1 2 "RIDERSHIP and PERFORMANCE" (PDF). KC Streetcar. Retrieved 2018-05-14.
- ↑ "The KC Streetcar - FAQs". Retrieved 2017-12-08.
- 1 2 "QLINE ON THE MOVE: A ONE-YEAR REPORT ON DETROIT'S STREETCAR" (PDF). qlinedetroit.com. 2018. Retrieved 2018-05-14.
- 1 2 3 "The Tide – Hampton Roads Transit". Hampton Roads Transit. 2013. Retrieved 2013-07-15.
- ↑ "Light Rail Service to Begin August 19, 2011". Hampton Roads Transit. Archived from the original on January 2, 2014. Retrieved 2013-08-10.
- 1 2 http://www.sunlinkstreetcar.com/documents/June%202017%20MOR%20(1).pdf
- 1 2 3 "Why do we need a streetcar? – The streetcar route". Sun Link Tucson Streetcar. Retrieved 2015-04-02.
- ↑ "Cincinnati Bell Connector". City of Cincinnati. 2016. Retrieved 2016-09-10.
- 1 2 "5 reasons why the Cincinnati streetcar's numbers are crashing, with no fixes in sight". Cincinnati Enquirer. March 5, 2018. Retrieved 2018-05-15.
- 1 2 "Design & Route". City of Cincinnati. 2016. Retrieved 2016-09-10.
- ↑ Coolidge, Sharon (September 9, 2016). "It's a go: Streetcar finally opens". The Cincinnati Enquirer. Retrieved 2016-09-10.
- ↑ "TECO Line Streetcar System – Streetcar System". TECOline Streetcar System. 2012. Retrieved 2013-07-02.
- 1 2 "Downtown Network Map" (PDF). Hillsborough Area Transit Authority (HART). February 2013. Retrieved 2013-07-02.
- 1 2 "City should keep an eye on ridership as it weighs adding $1 fare for DART streetcar". Dallas News. April 23, 2018. Retrieved 2018-05-15.
- 1 2 "Island Transit Information". Island Transit. Retrieved 2013-08-21.
- 1 2 "Streetcar Route Map" (PDF). Kenosha Streetcars Today. Retrieved 2013-07-14 – via http://www.kenoshastreetcarsociety.org/today.
- 1 2 "River Rail – Central Arkansas Transit Authority". Central Arkansas Transit Authority (CATA). Archived from the original on 2013-09-02. Retrieved 2013-08-18.