List of Louisiana parishes by French-speaking population
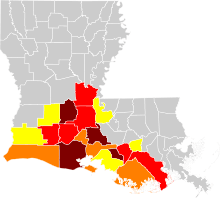
French spread in Louisiana. Parishes marked in yellow are those where 4–10% of the population speak French or Cajun French at home, orange 10–15%, red 15–20%, brown 20–30%.
The list of Louisiana parishes by French-speaking population was created from the 2000 Census of the United States.[1] Census collects data on languages spoken at home by inhabitants of Louisiana five years of age or more. Responses "French" and "Cajun" are included.
Statewide, out of a population 5 years and older of 4,152,122, some 179,750 people reported French as their home language, while 14,365 reported "Cajun". A further 4,465 who reported French Creole are not counted below.
According to the 2010 US Census, there was a huge decline in the number of French speakers in Louisiana. It now stands at 115,183 which equates to 2.8% of the state population.[2]
Complete Parish Listing
| Name of parish | Total population 5 and older 2000 | French-speaking population 5 and older 2000 | Percentage French-speaking 2000 | French-speaking population 5 and older 2010 | Percentage French-speaking 2010 | Map |
|---|---|---|---|---|---|---|
| Lafayette¹ | 176,051 | 25,300 | 14.37% | 20,769 | 10% | 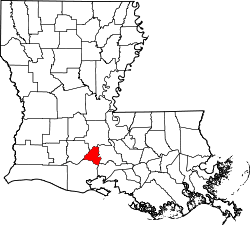 |
| Lafourche² | 83,518 | 15,984 | 19.12% | 13,525 | 15% | 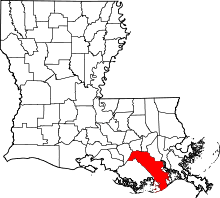 |
| St. Landry¹ | 80,668 | 13,475 | 16.70% | 7,841 | 10.08% | 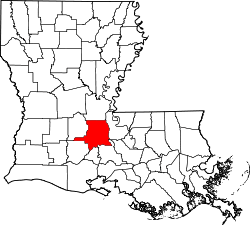 |
| Vermilion¹ | 49,842 | 12,410 | 24.89% | 9,766 | 18% | 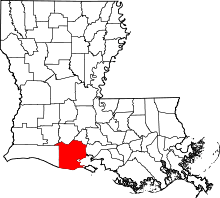 |
| St. Martin¹ | 44,779 | 12,290 | 27.44% | 8,675 | 18% | 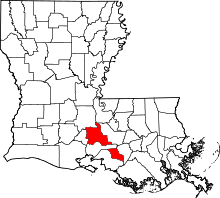 |
| Acadia¹ | 54,114 | 10,310 | 19.04% | 8,088 | 14% | 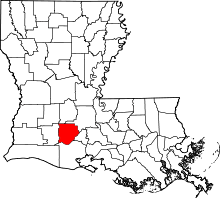 |
| Terrebonne² | 96,309 | 10,275 | 10.66% | 7,873 | 7.65% | 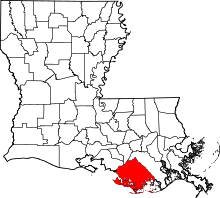 |
| Calcasieu² | 169,745 | 10,170 | 5.98% | 7,292 | 4.15% | 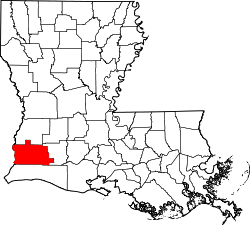 |
| Evangeline¹ | 32,454 | 8,345 | 25.71% | 5,740 | 18% | 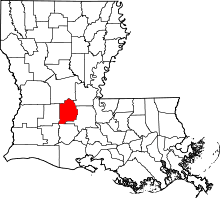 |
| Iberia¹ | 67,374 | 8,089 | 11.99% | 5,666 | 8.35% | 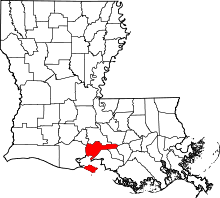 |
| East Baton Rouge | 382,741 | 7,925 | 2.07% | 4,195 | 4% | 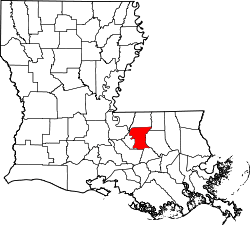 |
| Jefferson² | 424,600 | 7,763 | 1.82% | 4,165 | 1% | 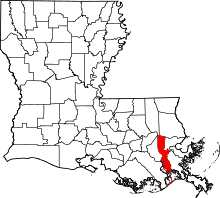 |
| Avoyelles² | 38,468 | 6,789 | 17.64% | 4,331 | 11.07% | 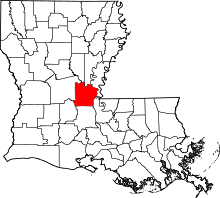 |
| Orleans | 450,894 | 5,805 | 1.28% |  | ||
| Jefferson Davis | 28,844 | 4,660 | 16.15% | 3,223 | 11.07% | 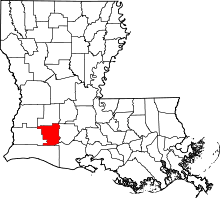 |
| Assumption² | 21,713 | 3,819 | 17.58% | 2,676 | 12.15% | 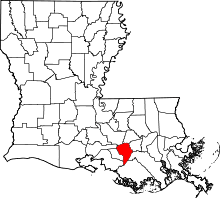 |
| St. Mary¹ | 49,345 | 2,685 | 5.43% | 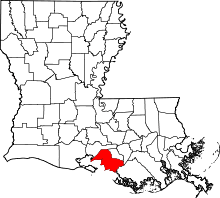 | ||
| Rapides | 116,866 | 2,189 | 1.86% | 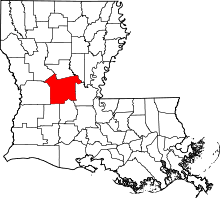 | ||
| St. Tammany | 177,092 | 2,160 | 1.21% | 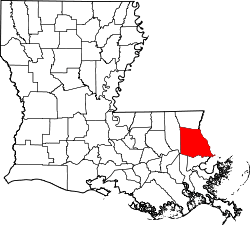 | ||
| Ascension² | 70,093 | 1,944 | 2.76% | 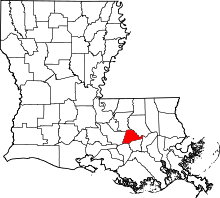 | ||
| Caddo | 233,812 | 1,944 | 0.82% | 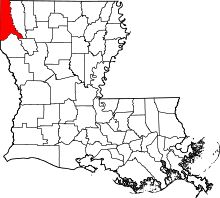 | ||
| Allen | 23,571 | 1,468 | 6.22% |  | ||
| Livingston | 84,694 | 1,344 | 1.58% |  | ||
| St. Charles² | 44,152 | 1,189 | 2.69% |  | ||
| Tangipahoa | 93,002 | 1,084 | 1.16% |  | ||
| Cameron² | 9,279 | 1,075 | 11.57% | 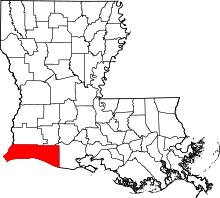 | ||
| Pointe Coupee² | 21,139 | 1,035 | 4.89% | 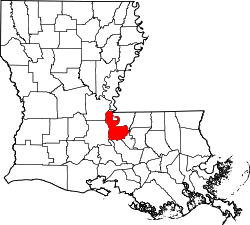 | ||
| Ouachita | 136,264 | 1,030 | 0.75% | 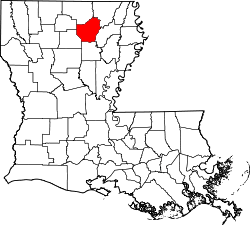 | ||
| Iberville² | 31,035 | 1,005 | 3.23% | 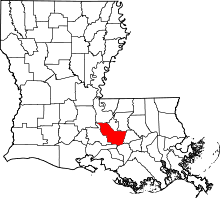 | ||
| St. James² | 19,684 | 980 | 4.97% | 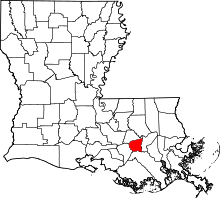 | ||
| St. Bernard | 62,812 | 915 | 1.44% |  | ||
| Plaquemines | 24,581 | 855 | 3.47% | 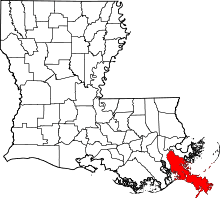 | ||
| St. John the Baptist² | 39,220 | 735 | 1.86% |  | ||
| West Baton Rouge² | 20,012 | 675 | 3.36% | 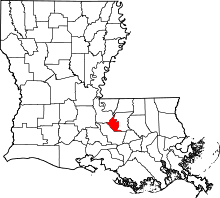 | ||
| East Feliciana | 19,853 | 574 | 2.88% | 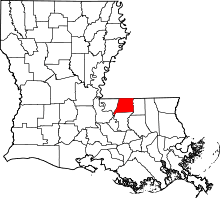 | ||
| Beauregard | 30,559 | 570 | 1.86% | 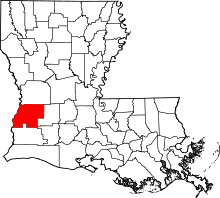 | ||
| Lincoln | 39,573 | 510 | 1.28% | 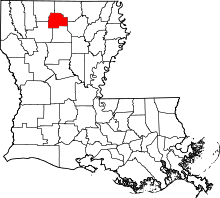 | ||
| Bossier | 90,587 | 474 | 0.51% | 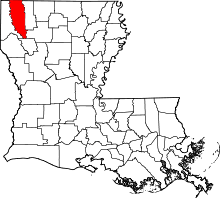 | ||
| Washington | 40,738 | 364 | 0.89% | 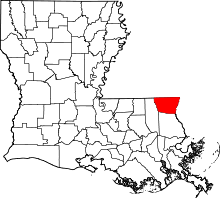 | ||
| Vernon | 47,048 | 350 | 0.74% | 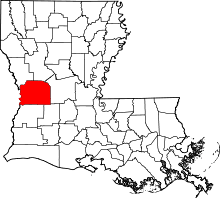 | ||
| Natchitoches | 36,082 | 339 | 0.93% | 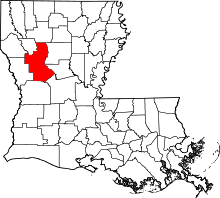 | ||
| Webster | 39,110 | 243 | 0.62% | 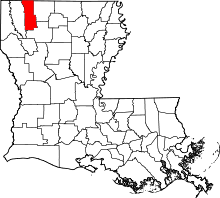 | ||
| Grant | 17,223 | 230 | 1.32% | 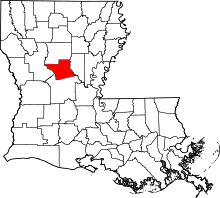 | ||
| De Soto | 23,607 | 230 | 0.97% | 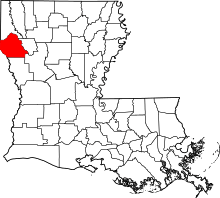 | ||
| Concordia | 18,698 | 190 | 1.01% | 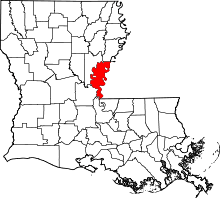 | ||
| Sabine | 21,830 | 190 | 0.86% | 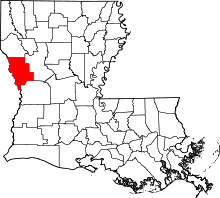 | ||
| La Salle | 13,281 | 167 | 1.25% |  | ||
| West Feliciana | 14,338 | 159 | 1.10% | 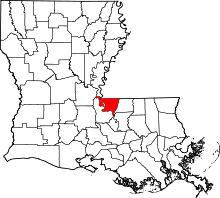 | ||
| Jackson | 14,363 | 148 | 1.03% | 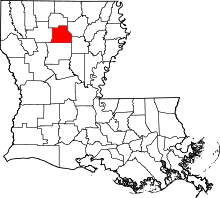 | ||
| Richland | 19,319 | 100 | 0.51% | 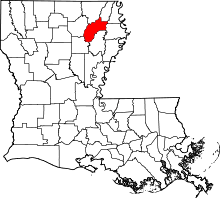 | ||
| Catahoula | 10,183 | 99 | 0.97% | 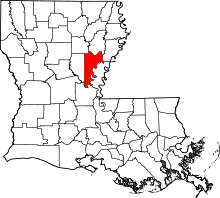 | ||
| Union | 21,129 | 95 | 0.44% | 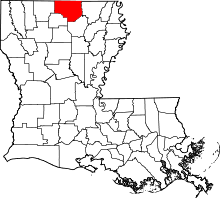 | ||
| West Carroll | 11,507 | 83 | 0.72% | 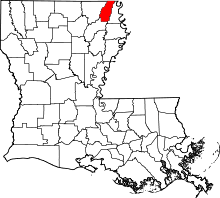 | ||
| Caldwell | 9,868 | 79 | 0.80% | 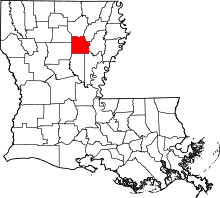 | ||
| Bienville | 14,699 | 79 | 0.53% | 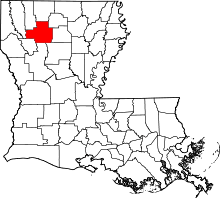 | ||
| Franklin | 19,649 | 79 | 0.40% | 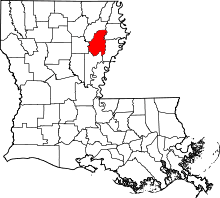 | ||
| Morehouse | 28,735 | 75 | 0.26% | 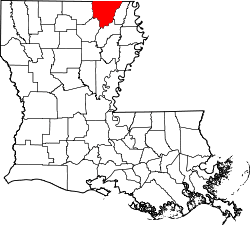 | ||
| Winn | 15,783 | 64 | 0.40% | 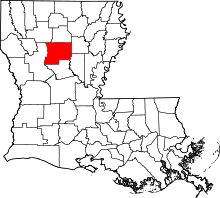 | ||
| East Carroll | 8,585 | 55 | 0.64% | 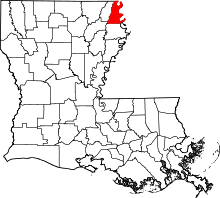 | ||
| Tensas | 6,144 | 35 | 0.56% | 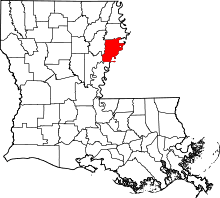 | ||
| Claiborne | 15,794 | 35 | 0.22% | 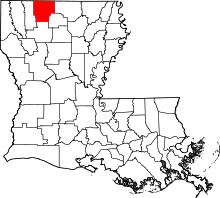 | ||
| St. Helena | 9,690 | 30 | 0.30% | 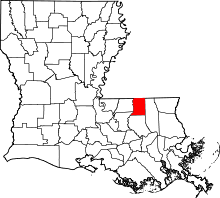 | ||
| Madison | 12,555 | 25 | 0.19% | 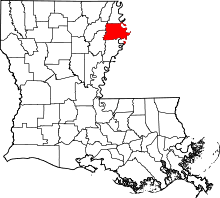 | ||
| Red River | 8,854 | 20 | 0.22% | 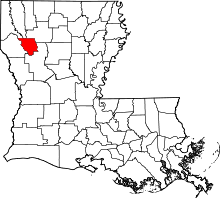 | ||
| Louisiana total | 4,152,122 | 194,115 | 4.66% | 115,183 | 2.8% | |
- ¹ Parishes of Cajun Heartland
- ² Other parishes of Acadiana
References
- ↑ "Language Map Data Center". Retrieved 2010-03-02.
- ↑ "Archived copy". Archived from the original on 2006-06-19. Retrieved 2007-10-22.
- ↑ "Archived copy". Archived from the original on 2013-08-15. Retrieved 2013-08-06.
See also
This article is issued from
Wikipedia.
The text is licensed under Creative Commons - Attribution - Sharealike.
Additional terms may apply for the media files.