Electoral system
The constituency was created as per the Political Reform Act 1977 and was first contested in the 1977 general election. The Act provided for the provinces of Spain to be established as multi-member districts in the Congress of Deputies,[1] with this regulation being maintained under the Spanish Constitution of 1978. Additionally, the Constitution requires for any modification of the provincial limits to be approved under an organic law, needing an absolute majority in the Cortes Generales.[2]
Voting is on the basis of universal suffrage, which comprises all nationals over eighteen and in full enjoyment of their political rights. The only exception was in 1977, when this was limited to nationals over twenty-one and in full enjoyment of their political and civil rights. Amendments to the electoral law in 2011 required for Spaniards abroad to apply for voting before being permitted to vote, a system known as "begged" or expat vote (Spanish: Voto rogado).[3] 348 seats are elected using the D'Hondt method and a closed list proportional representation, with a threshold of 3 percent of valid votes—which includes blank ballots—being applied in each constituency. Parties not reaching the threshold are not taken into consideration for seat distribution. Additionally, the use of the D'Hondt method may result in an effective threshold over three percent, depending on the district magnitude.[4] Each provincial constituency is entitled to an initial minimum of two seats, with the remaining 248 allocated among the constituencies in proportion to their populations. Ceuta and Melilla are allocated the two remaining seats, which are elected using plurality voting.[2][5][6][7]
The electoral law provides that parties, federations, coalitions and groupings of electors are allowed to present lists of candidates. However, groupings of electors are required to secure the signature of at least 1 percent of the electors registered in the constituency for which they are seeking election—0.1 percent and, at least, the signature of 500 electors, until 1985—. Also since 2011, parties, federations or coalitions who have not obtained a mandate in either House of Parliament at the preceding election are required to secure the signature of at least 0.1 percent of the electors registered in the constituency for which they are seeking election. Electors are barred from signing for more than one list of candidates. Concurrently, parties and federations intending to enter in coalition to take part jointly at an election are required to inform the relevant Electoral Commission within ten days of the election being called.[5][7]
Elections
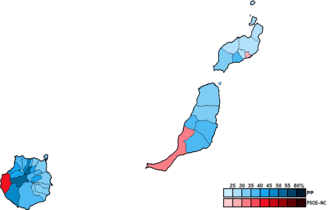
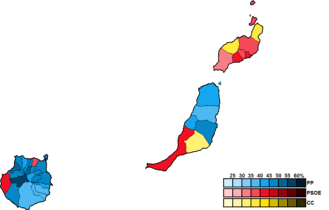
2016 general election
Summary of the 26 June 2016 Congress of Deputies election results in Las Palmas
| Parties and coalitions |
Popular vote |
Seats |
| Votes |
% |
±pp |
Total |
+/− |
|
People's Party (PP) |
170,316 | 33.89 | +5.72 |
3 | ±0 |
|
Spanish Socialist Workers' Party–New Canaries (PSOE–NCa) |
119,351 | 23.75 | +1.37 |
2 | ±0 |
|
United We Can (Podemos–IU–eQuo)1 |
113,256 | 22.54 | –6.88 |
2 | ±0 |
|
Citizens–Party of the Citizenry (C's) |
65,172 | 12.97 | +0.69 |
1 | ±0 |
|
Canarian Coalition–Canarian Nationalist Party (CCa–PNC) |
17,982 | 3.58 | –0.64 |
0 | ±0 |
|
|
Animalist Party Against Mistreatment of Animals (PACMA) |
6,730 | 1.34 | +0.30 |
0 | ±0 |
|
Zero Cuts–Green Group (Recortes Cero–GV) |
1,552 | 0.31 | +0.02 |
0 | ±0 |
|
Union, Progress and Democracy (UPyD) |
978 | 0.19 | –0.31 |
0 | ±0 |
|
Communist Party of the Canarian People (PCPC) |
900 | 0.18 | ±0.00 |
0 | ±0 |
|
Vox (Vox) |
882 | 0.18 | +0.03 |
0 | ±0 |
|
Unity of the People (UP)2 |
686 | 0.14 | –0.17 |
0 | ±0 |
|
Together for Canaries (JxC) |
537 | 0.11 | New |
0 | ±0 |
|
Humanist Party (PH) |
450 | 0.09 | ±0.00 |
0 | ±0 |
|
Internationalist Solidarity and Self-Management (SAIn) |
212 | 0.04 | –0.02 |
0 | ±0 |
| Blank ballots |
3,502 | 0.70 | –0.10 |
|
|
| Total |
502,506 | |
8 | ±0 |
|
| Valid votes |
502,506 | 98.73 | +0.17 |
|
| Invalid votes |
6,451 | 1.27 | –0.17 |
| Votes cast / turnout |
508,957 | 60.38 | –2.07 |
| Abstentions |
333,959 | 39.62 | +2.07 |
| Registered voters |
842,916 | |
|
| Sources[8] |
|
|
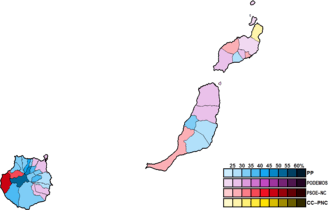
2015 general election
Summary of the 20 December 2015 Congress of Deputies election results in Las Palmas
| Parties and coalitions |
Popular vote |
Seats |
| Votes |
% |
±pp |
Total |
+/− |
|
People's Party (PP) |
145,372 | 28.17 | –22.86 |
3 | –2 |
|
We Can (Podemos) |
136,583 | 26.46 | New |
2 | +2 |
|
Spanish Socialist Workers' Party–New Canaries (PSOE–NCa) |
115,521 | 22.38 | –3.78 |
2 | ±0 |
|
Citizens–Party of the Citizenry (C's) |
63,385 | 12.28 | New |
1 | +1 |
|
Canarian Coalition–Canarian Nationalist Party (CCa–PNC) |
21,788 | 4.22 | –7.08 |
0 | –1 |
|
|
Canarian United Left–Popular Unity in Common (IUC–UPeC)1 |
15,262 | 2.96 | –1.27 |
0 | ±0 |
|
Animalist Party Against Mistreatment of Animals (PACMA) |
5,351 | 1.04 | +0.61 |
0 | ±0 |
|
Union, Progress and Democracy (UPyD) |
2,564 | 0.50 | –2.17 |
0 | ±0 |
|
Canaries Decides (LV–UP–ALTER)2 |
1,605 | 0.31 | +0.07 |
0 | ±0 |
|
Zero Cuts–Green Group (Recortes Cero–GV) |
1,478 | 0.29 | New |
0 | ±0 |
|
Communist Party of the Canarian People (PCPC) |
953 | 0.18 | –0.13 |
0 | ±0 |
|
Vox (Vox) |
774 | 0.15 | New |
0 | ±0 |
|
For a Fairer World (PUM+J) |
616 | 0.12 | –0.15 |
0 | ±0 |
|
Humanist Party (PH) |
439 | 0.09 | –0.13 |
0 | ±0 |
|
Internationalist Solidarity and Self-Management (SAIn) |
300 | 0.06 | –0.01 |
0 | ±0 |
| Blank ballots |
4,111 | 0.80 | –0.68 |
|
|
| Total |
516,102 | |
8 | ±0 |
|
| Valid votes |
516,102 | 98.56 | +0.33 |
|
| Invalid votes |
7,535 | 1.44 | –0.33 |
| Votes cast / turnout |
523,637 | 62.45 | +1.96 |
| Abstentions |
314,906 | 37.55 | –1.96 |
| Registered voters |
838,543 | |
|
| Sources[9] |
|
|
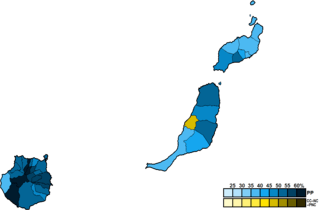
2011 general election
Summary of the 20 November 2011 Congress of Deputies election results in Las Palmas
| Parties and coalitions |
Popular vote |
Seats |
| Votes |
% |
±pp |
Total |
+/− |
|
People's Party (PP) |
240,897 | 51.03 | +11.33 |
5 | +1 |
|
Spanish Socialist Workers' Party (PSOE) |
123,486 | 26.16 | –16.40 |
2 | –2 |
|
Canarian Coalition–New Canaries–Canarian Nationalist Party (CC–NC–PNC)1 |
53,329 | 11.30 | –2.35 |
1 | +1 |
|
Green and Red Canaries: Plural Left (IUC–CxI–PSyEP)2 |
19,971 | 4.23 | +3.14 |
0 | ±0 |
|
|
Union, Progress and Democracy (UPyD) |
13,208 | 2.80 | +2.44 |
0 | ±0 |
|
Equo (eQuo) |
5,414 | 1.15 | New |
0 | ±0 |
|
Animalist Party Against Mistreatment of Animals (PACMA) |
2,012 | 0.43 | +0.31 |
0 | ±0 |
|
Communist Party of the Peoples of Spain (PCPE) |
1,460 | 0.31 | +0.17 |
0 | ±0 |
|
For a Fairer World (PUM+J) |
1,288 | 0.27 | +0.19 |
0 | ±0 |
|
Unity of the People (UP) |
1,138 | 0.24 | +0.15 |
0 | ±0 |
|
Humanist Party (PH) |
1,051 | 0.22 | +0.14 |
0 | ±0 |
|
Canarian Nationalist Alternative (ANC) |
987 | 0.21 | +0.14 |
0 | ±0 |
|
Communist Unification of Spain (UCE) |
541 | 0.11 | New |
0 | ±0 |
|
Internationalist Solidarity and Self-Management (SAIn) |
316 | 0.07 | +0.02 |
0 | ±0 |
| Blank ballots |
6,990 | 1.48 | +0.67 |
|
|
| Total |
472,088 | |
8 | ±0 |
|
| Valid votes |
472,088 | 98.23 | –1.00 |
|
| Invalid votes |
8,515 | 1.77 | +1.00 |
| Votes cast / turnout |
480,603 | 60.49 | –6.32 |
| Abstentions |
313,919 | 39.51 | +6.32 |
| Registered voters |
794,522 | |
|
| Sources[10] |
|
|
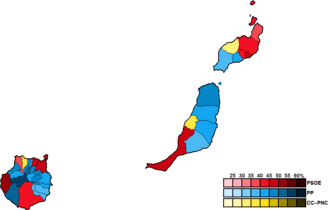
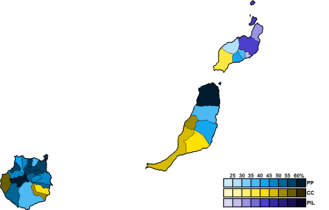
2008 general election
Summary of the 9 March 2008 Congress of Deputies election results in Las Palmas
| Parties and coalitions |
Popular vote |
Seats |
| Votes |
% |
±pp |
Total |
+/− |
|
Spanish Socialist Workers' Party (PSOE) |
215,560 | 42.56 | +8.64 |
4 | +1 |
|
People's Party (PP) |
201,067 | 39.70 | –2.51 |
4 | ±0 |
|
New Canaries–Canarian Centre (NC–CCN) |
38,024 | 7.51 | New |
0 | ±0 |
|
Canarian Coalition–Nationalist Party–Lanzarote Independents (CC–PNC–PIL) |
31,103 | 6.14 | –11.92 |
0 | –1 |
|
|
Canarian United Left–Alternative (IUC) |
5,532 | 1.09 | –0.90 |
0 | ±0 |
|
The Greens (LV) |
2,886 | 0.57 | New |
0 | ±0 |
|
Union, Progress and Democracy (UPyD) |
1,827 | 0.36 | New |
0 | ±0 |
|
The Greens–Green Group (LV–GV) |
1,231 | 0.24 | –1.03 |
0 | ±0 |
|
Communist Party of the Canarian People (PCPC) |
712 | 0.14 | –0.07 |
0 | ±0 |
|
Anti-Bullfighting Party Against Mistreatment of Animals (PACMA) |
631 | 0.12 | New |
0 | ±0 |
|
Unity of the People (UP) |
454 | 0.09 | New |
0 | ±0 |
|
Humanist Party (PH) |
429 | 0.08 | –0.03 |
0 | ±0 |
|
For a Fairer World (PUM+J) |
411 | 0.08 | New |
0 | ±0 |
|
Social Democratic Party (PSD) |
387 | 0.08 | New |
0 | ±0 |
|
Canarian Nationalist Alternative (ANC) |
376 | 0.07 | New |
0 | ±0 |
|
Internationalist Solidarity and Self-Management (SAIn) |
235 | 0.05 | New |
0 | ±0 |
|
National Democracy (DN) |
219 | 0.04 | –0.01 |
0 | ±0 |
|
Movement for the Unity of the Canarian People (MUPC) |
211 | 0.04 | New |
0 | ±0 |
|
Spanish Alternative (AES) |
207 | 0.04 | New |
0 | ±0 |
|
Citizens for Blank Votes (CenB) |
207 | 0.04 | New |
0 | ±0 |
|
Citizens–Party of the Citizenry (C's) |
195 | 0.04 | New |
0 | ±0 |
|
Family and Life Party (PFyV) |
191 | 0.04 | New |
0 | ±0 |
|
Spanish Phalanx of the CNSO (FE–JONS) |
174 | 0.03 | –0.03 |
0 | ±0 |
|
Authentic Phalanx (FA) |
109 | 0.02 | –0.03 |
0 | ±0 |
| Blank ballots |
4,078 | 0.81 | –0.41 |
|
|
| Total |
506,456 | |
8 | ±0 |
|
| Valid votes |
506,456 | 99.23 | –0.10 |
|
| Invalid votes |
3,935 | 0.77 | +0.10 |
| Votes cast / turnout |
510,391 | 66.81 | –0.91 |
| Abstentions |
253,566 | 33.19 | +0.91 |
| Registered voters |
763,957 | |
|
| Sources[11] |
2004 general election
Summary of the 14 March 2004 Congress of Deputies election results in Las Palmas
| Parties and coalitions |
Popular vote |
Seats |
| Votes |
% |
±pp |
Total |
+/− |
|
People's Party (PP) |
208,995 | 42.21 | –5.84 |
4 | ±0 |
|
Spanish Socialist Workers' Party (PSOE) |
167,926 | 33.92 | +15.52 |
3 | +2 |
|
Canarian Coalition (CC) |
89,420 | 18.06 | –7.72 |
1 | –1 |
|
|
The Greens–Canarian United Left–Citizens' Alternative 25 May (LV–IU–AC25M) |
9,876 | 1.99 | –0.50 |
0 | ±0 |
|
The Greens–Green Group (LV–GV) |
6,301 | 1.27 | New |
0 | ±0 |
|
Canarian Popular Alternative (APCa) |
1,204 | 0.24 | New |
0 | ±0 |
|
Communist Party of the Canarian People (PCPC) |
1,044 | 0.21 | +0.04 |
0 | ±0 |
|
Alternative for Gran Canaria (AxGC) |
957 | 0.19 | New |
0 | ±0 |
|
Democratic and Social Centre (CDS) |
788 | 0.16 | +0.06 |
0 | ±0 |
|
Humanist Party (PH) |
554 | 0.11 | –0.03 |
0 | ±0 |
|
Nationalist Maga Alternative (AMAGA) |
468 | 0.09 | New |
0 | ±0 |
|
Republican Left (IR) |
337 | 0.07 | New |
0 | ±0 |
|
National Democracy (DN) |
307 | 0.06 | New |
0 | ±0 |
|
Spanish Phalanx of the CNSO (FE–JONS) |
288 | 0.06 | New |
0 | ±0 |
|
Authentic Phalanx (FA) |
248 | 0.05 | New |
0 | ±0 |
|
The Phalanx (FE) |
220 | 0.04 | –0.07 |
0 | ±0 |
|
Republican Social Movement (MSR) |
155 | 0.03 | New |
0 | ±0 |
| Blank ballots |
6,049 | 1.22 | +0.32 |
|
|
| Total |
495,137 | |
8 | +1 |
|
| Valid votes |
495,137 | 99.33 | +0.10 |
|
| Invalid votes |
3,355 | 0.67 | –0.10 |
| Votes cast / turnout |
498,492 | 67.72 | +6.14 |
| Abstentions |
237,665 | 32.28 | –6.14 |
| Registered voters |
736,157 | |
|
| Sources[12] |
2000 general election
Summary of the 12 March 2000 Congress of Deputies election results in Las Palmas
| Parties and coalitions |
Popular vote |
Seats |
| Votes |
% |
±pp |
Total |
+/− |
|
People's Party (PP) |
210,774 | 48.05 | +5.64 |
4 | +1 |
|
Canarian Coalition (CC) |
113,075 | 25.78 | +1.76 |
2 | ±0 |
|
Spanish Socialist Workers' Party–Progressives (PSOE–p) |
80,695 | 18.40 | –7.45 |
1 | –1 |
|
|
Canarian United Left (IUC) |
10,941 | 2.49 | –3.24 |
0 | ±0 |
|
Party of Independents from Lanzarote (PIL) |
10,323 | 2.35 | New |
0 | ±0 |
|
The Greens of Canaries (LV) |
4,982 | 1.14 | New |
0 | ±0 |
|
Progressives of Canaries Unity (UP–CAN) |
980 | 0.22 | New |
0 | ±0 |
|
Communist Party of the Canarian People (PCPC) |
752 | 0.17 | ±0.00 |
0 | ±0 |
|
Humanist Party (PH) |
630 | 0.14 | +0.04 |
0 | ±0 |
|
The Phalanx (FE) |
478 | 0.11 | New |
0 | ±0 |
|
Centrist Union–Democratic and Social Centre (UC–CDS) |
437 | 0.10 | +0.02 |
0 | ±0 |
|
Pensionist Assembly of the Canaries (TPC) |
319 | 0.07 | New |
0 | ±0 |
|
Natural Law Party (PLN) |
301 | 0.07 | New |
0 | ±0 |
| Blank ballots |
3,969 | 0.90 | +0.26 |
|
|
| Total |
438,656 | |
7 | ±0 |
|
| Valid votes |
438,656 | 99.23 | –0.29 |
|
| Invalid votes |
3,390 | 0.77 | +0.29 |
| Votes cast / turnout |
442,046 | 61.58 | –9.65 |
| Abstentions |
275,834 | 38.42 | +9.65 |
| Registered voters |
717,880 | |
|
| Sources[13] |
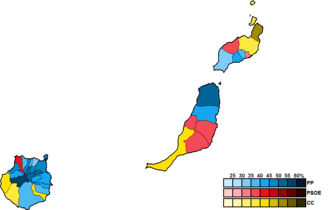
1996 general election
Summary of the 3 March 1996 Congress of Deputies election results in Las Palmas
| Parties and coalitions |
Popular vote |
Seats |
| Votes |
% |
±pp |
Total |
+/− |
|
People's Party (PP) |
194,812 | 42.41 | +4.30 |
3 | ±0 |
|
Spanish Socialist Workers' Party (PSOE) |
118,769 | 25.85 | +1.01 |
2 | ±0 |
|
Canarian Coalition (CC) |
110,338 | 24.02 | –0.47 |
2 | ±0 |
|
Canarian United Left (IUC) |
26,305 | 5.73 | +0.40 |
0 | ±0 |
|
|
The Greens–Green Group (LV–GV) |
1,823 | 0.40 | New |
0 | ±0 |
|
Popular Front of the Canary Islands (FREPIC) |
1,496 | 0.33 | New |
0 | ±0 |
|
Communist Party of the Canarian People (PCPC) |
765 | 0.17 | –0.04 |
0 | ±0 |
|
Nationalist Canarian Party (PCN) |
722 | 0.16 | New |
0 | ±0 |
|
Green Left of the Canary Islands (Izegzawen) |
609 | 0.13 | New |
0 | ±0 |
|
Humanist Party (PH) |
473 | 0.10 | +0.04 |
0 | ±0 |
|
Centrist Union (UC) |
362 | 0.08 | –0.89 |
0 | ±0 |
| Blank ballots |
2,919 | 0.64 | –0.08 |
|
|
| Total |
459,393 | |
7 | ±0 |
|
| Valid votes |
459,393 | 99.52 | +0.34 |
|
| Invalid votes |
2,205 | 0.48 | –0.34 |
| Votes cast / turnout |
461,598 | 71.23 | +0.26 |
| Abstentions |
186,449 | 28.77 | –0.26 |
| Registered voters |
648,047 | |
|
| Sources[14] |
1993 general election
Summary of the 6 June 1993 Congress of Deputies election results in Las Palmas
| Parties and coalitions |
Popular vote |
Seats |
| Votes |
% |
±pp |
Total |
+/− |
|
People's Party (PP) |
160,131 | 38.11 | +17.41 |
3 | +1 |
|
Spanish Socialist Workers' Party (PSOE) |
104,367 | 24.84 | –7.21 |
2 | –1 |
|
Canarian Coalition (CC)1 |
102,913 | 24.49 | +22.70 |
2 | +2 |
|
Canarian United Left (IUC) |
22,382 | 5.33 | –4.77 |
0 | ±0 |
|
Party of Gran Canaria (PGC) |
15,246 | 3.63 | New |
0 | ±0 |
|
|
Democratic and Social Centre (CDS) |
4,064 | 0.97 | –23.31 |
0 | –2 |
|
The Greens (LV) |
2,452 | 0.58 | –0.27 |
0 | ±0 |
|
The Ecologists (LE) |
1,460 | 0.35 | –0.38 |
0 | ±0 |
|
Insular Group of Gran Canaria Party (AIGC) |
1,009 | 0.24 | New |
0 | ±0 |
|
Communist Party of the Canarian People (PCPC) |
884 | 0.21 | –0.07 |
0 | ±0 |
|
Ruiz-Mateos Group–European Democratic Alliance (ARM–ADE) |
634 | 0.15 | –1.60 |
0 | ±0 |
|
Workers' Socialist Party (PST) |
563 | 0.13 | –0.30 |
0 | ±0 |
|
Coalition for a New Socialist Party (CNPS) |
326 | 0.08 | New |
0 | ±0 |
|
Tagoror Party (Tagoror) |
278 | 0.07 | –0.06 |
0 | ±0 |
|
Humanist Party (PH) |
262 | 0.06 | –0.10 |
0 | ±0 |
|
Natural Law Party (PLN) |
189 | 0.04 | New |
0 | ±0 |
|
Coalition for Free Canaries (CCL) |
0 | 0.00 | New |
0 | ±0 |
| Blank ballots |
3,029 | 0.72 | +0.22 |
|
|
| Total |
420,189 | |
7 | ±0 |
|
| Valid votes |
420,189 | 99.18 | –0.01 |
|
| Invalid votes |
3,462 | 0.82 | +0.01 |
| Votes cast / turnout |
423,651 | 70.97 | +7.43 |
| Abstentions |
173,333 | 29.03 | –7.43 |
| Registered voters |
596,984 | |
|
| Sources[15] |
|
|
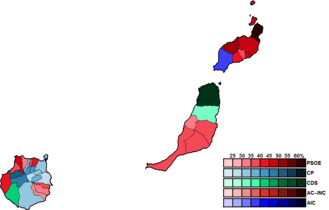
1989 general election
Summary of the 29 October 1989 Congress of Deputies election results in Las Palmas
| Parties and coalitions |
Popular vote |
Seats |
| Votes |
% |
±pp |
Total |
+/− |
|
Spanish Socialist Workers' Party (PSOE) |
113,675 | 32.05 | –0.55 |
3 | ±0 |
|
Democratic and Social Centre (CDS) |
86,121 | 24.28 | +3.14 |
2 | ±0 |
|
People's Party (PP)1 |
73,443 | 20.70 | –7.40 |
2 | ±0 |
|
United Left–United Canarian Left (IU–ICU) |
35,818 | 10.10 | +4.52 |
0 | ±0 |
|
Canarian Nationalist Assembly (ACN)2 |
13,244 | 3.73 | –2.39 |
0 | ±0 |
|
|
Independents of Gran Canaria (IGC) |
6,371 | 1.80 | New |
0 | ±0 |
|
Canarian Independent Groups (AIC) |
6,333 | 1.79 | –0.19 |
0 | ±0 |
|
Ruiz-Mateos Group (Ruiz-Mateos) |
6,211 | 1.75 | New |
0 | ±0 |
|
The Greens–Green List (LV–LV) |
2,999 | 0.85 | New |
0 | ±0 |
|
The Ecologist Greens (LVE) |
2,576 | 0.73 | New |
0 | ±0 |
|
Workers' Socialist Party (PST) |
1,523 | 0.43 | –0.10 |
0 | ±0 |
|
Seven Green Stars (SEV) |
1,411 | 0.40 | New |
0 | ±0 |
|
Communist Party of the Canarian People (PCPC) |
979 | 0.28 | New |
0 | ±0 |
|
Workers' Party of Spain–Communist Unity (PTE–UC) |
810 | 0.23 | New |
0 | ±0 |
|
Humanist Party (PH) |
574 | 0.16 | New |
0 | ±0 |
|
Lanzarote Assembly (Tagoror) |
472 | 0.13 | New |
0 | ±0 |
|
Spanish Phalanx of the CNSO (FE–JONS) |
391 | 0.11 | –0.09 |
0 | ±0 |
|
Communist Party of Spain (Marxist–Leninist) (PCE (m–l))3 |
0 | 0.00 | –0.28 |
0 | ±0 |
| Blank ballots |
1,782 | 0.50 | +0.07 |
|
|
| Total |
354,733 | |
7 | ±0 |
|
| Valid votes |
354,733 | 99.19 | +1.56 |
|
| Invalid votes |
2,884 | 0.81 | –1.56 |
| Votes cast / turnout |
357,617 | 63.54 | –7.41 |
| Abstentions |
205,188 | 36.46 | +7.41 |
| Registered voters |
562,805 | |
|
| Sources[16] |
|
|
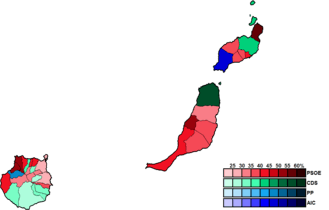
1986 general election
Summary of the 22 June 1986 Congress of Deputies election results in Las Palmas
| Parties and coalitions |
Popular vote |
Seats |
| Votes |
% |
±pp |
Total |
+/− |
|
Spanish Socialist Workers' Party (PSOE) |
113,905 | 32.60 | –0.02 |
3 | ±0 |
|
People's Coalition (AP–PDP–PL)1 |
98,173 | 28.10 | –1.04 |
2 | ±0 |
|
Democratic and Social Centre (CDS) |
73,842 | 21.14 | +15.26 |
2 | +2 |
|
Canarian Assembly–Canarian Nationalist Left (AC–INC) |
21,393 | 6.12 | +2.35 |
0 | ±0 |
|
United Canarian Left (ICU) |
19,508 | 5.58 | New |
0 | ±0 |
|
|
Democratic Reformist Party (PRD) |
7,793 | 2.23 | New |
0 | ±0 |
|
Canarian Independent Groups (AIC) |
6,927 | 1.98 | New |
0 | ±0 |
|
Workers' Socialist Party (PST) |
1,851 | 0.53 | +0.01 |
0 | ±0 |
|
Communist Unification of Spain (UCE) |
1,415 | 0.41 | +0.23 |
0 | ±0 |
|
Internationalist Socialist Workers' Party (POSI) |
1,389 | 0.40 | New |
0 | ±0 |
|
Republican Popular Unity (UPR)2 |
967 | 0.28 | +0.09 |
0 | ±0 |
|
Spanish Phalanx of the CNSO (FE–JONS) |
692 | 0.20 | New |
0 | ±0 |
|
Union of the Democratic Centre (UCD) |
n/a | n/a | –13.69 |
0 | –1 |
| Blank ballots |
1,519 | 0.43 | –0.09 |
|
|
| Total |
349,374 | |
7 | +1 |
|
| Valid votes |
349,374 | 97.63 | +0.97 |
|
| Invalid votes |
8,469 | 2.37 | –0.97 |
| Votes cast / turnout |
357,843 | 70.95 | –5.86 |
| Abstentions |
146,504 | 29.05 | +5.86 |
| Registered voters |
504,347 | |
|
| Sources[17] |
|
|
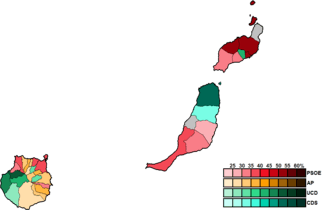
1982 general election
Summary of the 28 October 1982 Congress of Deputies election results in Las Palmas
| Parties and coalitions |
Popular vote |
Seats |
| Votes |
% |
±pp |
Total |
+/− |
|
Spanish Socialist Workers' Party (PSOE) |
109,366 | 32.62 | +18.16 |
3 | +2 |
|
People's Alliance–People's Democratic Party (AP–PDP)1 |
97,701 | 29.14 | +26.15 |
2 | +2 |
|
Union of the Democratic Centre (UCD) |
45,905 | 13.69 | –46.02 |
1 | –3 |
|
Canarian Convergence (CC) |
25,792 | 7.69 | New |
0 | ±0 |
|
Democratic and Social Centre (CDS) |
19,705 | 5.88 | New |
0 | ±0 |
|
Canarian People's Union (UPC) |
16,241 | 4.84 | –8.47 |
0 | –1 |
|
Canarian Assembly–Canarian Coordinator (AC–CC) |
12,625 | 3.77 | New |
0 | ±0 |
|
|
Workers' Socialist Party (PST) |
1,746 | 0.52 | New |
0 | ±0 |
|
Canarian Nationalist Party (PNC) |
1,051 | 0.31 | New |
0 | ±0 |
|
New Force (FN)2 |
758 | 0.23 | –0.54 |
0 | ±0 |
|
Communist Party of Spain (Marxist–Leninist) (PCE (m-l)) |
625 | 0.19 | New |
0 | ±0 |
|
Communist Unification of Spain (UCE) |
602 | 0.18 | New |
0 | ±0 |
|
Spanish Solidarity (SE) |
574 | 0.17 | New |
0 | ±0 |
|
Revolutionary Communist League (LCR) |
443 | 0.13 | –0.16 |
0 | ±0 |
|
Communist League–Internationalist Socialist Workers' Coalition (LC (COSI)) |
417 | 0.12 | New |
0 | ±0 |
|
United Canarian People (PCU) |
0 | 0.00 | New |
0 | ±0 |
|
Socialist Party (PS) |
0 | 0.00 | New |
0 | ±0 |
| Blank ballots |
1,748 | 0.52 | +0.16 |
|
|
| Total |
335,299 | |
6 | ±0 |
|
| Valid votes |
335,299 | 96.66 | –0.31 |
|
| Invalid votes |
11,574 | 3.34 | +0.31 |
| Votes cast / turnout |
346,873 | 76.81 | +6.32 |
| Abstentions |
104,707 | 23.19 | –6.32 |
| Registered voters |
451,580 | |
|
| Sources[18] |
|
|
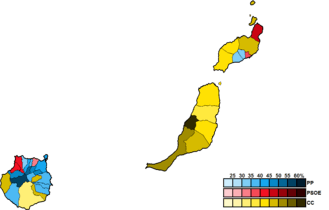
1979 general election
Summary of the 1 March 1979 Congress of Deputies election results in Las Palmas
| Parties and coalitions |
Popular vote |
Seats |
| Votes |
% |
±pp |
Total |
+/− |
|
Union of the Democratic Centre (UCD) |
171,842 | 59.71 | –6.29 |
4 | –1 |
|
Spanish Socialist Workers' Party (PSOE)1 |
41,616 | 14.46 | –2.01 |
1 | ±0 |
|
Canarian People's Union (UPC) |
38,304 | 13.31 | New |
1 | +1 |
|
Party of the Canarian Country (PDPCan) |
10,099 | 3.51 | New |
0 | ±0 |
|
|
Democratic Coalition (CD)2 |
8,607 | 2.99 | –2.63 |
0 | ±0 |
|
Communist Party of the Canaries (PCC–PCE) |
8,245 | 2.86 | +0.23 |
0 | ±0 |
|
National Union (UN) |
2,218 | 0.77 | New |
0 | ±0 |
|
Party of Labour of Spain (PTE)3 |
1,315 | 0.46 | –0.06 |
0 | ±0 |
|
Workers' Revolutionary Organization (ORT) |
1,165 | 0.40 | New |
0 | ±0 |
|
Republican Left (IR) |
1,019 | 0.35 | New |
0 | ±0 |
|
Revolutionary Communist League (LCR) |
826 | 0.29 | New |
0 | ±0 |
|
Carlist Party (PC) |
774 | 0.27 | New |
0 | ±0 |
|
Union for the Freedom of Speech (ULE) |
736 | 0.26 | New |
0 | ±0 |
| Blank ballots |
1,024 | 0.36 | +0.06 |
|
|
| Total |
287,790 | |
6 | ±0 |
|
| Valid votes |
287,790 | 96.97 | –1.11 |
|
| Invalid votes |
8,993 | 3.03 | +1.11 |
| Votes cast / turnout |
296,783 | 70.49 | –8.75 |
| Abstentions |
124,220 | 29.51 | +8.75 |
| Registered voters |
421,003 | |
|
| Sources[19] |
|
|
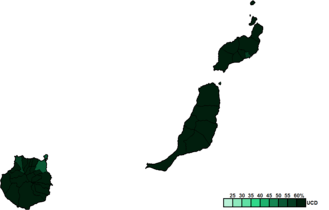
1977 general election
Summary of the 15 June 1977 Congress of Deputies election results in Las Palmas
| Parties and coalitions |
Popular vote |
Seats |
| Votes |
% |
±pp |
Total |
+/− |
|
Union of the Democratic Centre (UCD) |
187,254 | 66.00 | n/a |
5 | n/a |
|
Spanish Socialist Workers' Party (PSOE) |
39,616 | 13.96 | n/a |
1 | n/a |
|
United Canarian People (PCU) |
17,717 | 6.25 | n/a |
0 | n/a |
|
People's Alliance (AP) |
15,944 | 5.62 | n/a |
0 | n/a |
|
|
Communist Party of the Canaries (PCC–PCE) |
7,467 | 2.63 | n/a |
0 | n/a |
|
People's Socialist Party–Socialist Unity (PSP–US) |
7,130 | 2.51 | n/a |
0 | n/a |
|
Socialist Party of Canaries (PSCan) |
2,384 | 0.84 | n/a |
0 | n/a |
|
Canarian People's Party (PPCan) |
1,882 | 0.66 | n/a |
0 | n/a |
|
Democratic Left Front (FDI) |
1,476 | 0.52 | n/a |
0 | n/a |
|
Spanish Social Reform (RSE) |
1,154 | 0.41 | n/a |
0 | n/a |
|
Spanish Phalanx of the CNSO (Authentic) (FE–JONS(A)) |
817 | 0.29 | n/a |
0 | n/a |
| Blank ballots |
857 | 0.30 | n/a |
|
|
| Total |
283,698 | |
6 | n/a |
|
| Valid votes |
283,698 | 98.08 | n/a |
|
| Invalid votes |
5,562 | 1.92 | n/a |
| Votes cast / turnout |
289,260 | 79.24 | n/a |
| Abstentions |
75,803 | 20.76 | n/a |
| Registered voters |
365,063 | |
|
| Sources[20] |
.png)