Demographics of French Guiana
| Historical population estimates and average annual growth rate | ||
|---|---|---|
| Year | Pop. | ±% p.a. |
| 1790 | 14,520 | — |
| 1839 | 20,940 | +0.75% |
| 1857 | 25,561 | +1.11% |
| 1891 | 33,500 | +0.80% |
| Source: INSEE estimates | ||
| Census population and average annual growth rate | ||
|---|---|---|
| Year | Pop. | ±% p.a. |
| 1936 | 37,005 | — |
| 1946 | 25,499 | −3.66% |
| 1954 | 27,863 | +1.11% |
| 1961 | 33,505 | +2.67% |
| 1967 | 44,392 | +4.80% |
| 1974 | 55,125 | +3.14% |
| 1982 | 73,022 | +3.58% |
| 1990 | 114,678 | +5.80% |
| 1999 | 156,790 | +3.54% |
| 2009 | 224,469 | +3.65% |
| Source:[1] | ||
Population
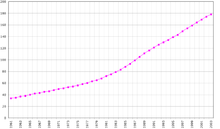
According to INSEE the population of French Guiana was 239,450 of January 1, 2012.[2] The population is very young: 44% are below the age of 20, while only 1.7% are 75 years or older. The age distribution is a reflection of the high fertility rates of French Guiana.
Nationality
On January 1, 2010, 64.5% of the population had French nationality, while 35.5% had a foreign nationality.[3] Of these, Surinamese (13.8% of the total population), Haitians (8.8%) and Brazilians (8.7%) were the largest groups. Smaller groups included people with nationality of Guyana (1.7%), Colombia (1.0%), China (0.5%), the Dominican Republic (0.4%) and Peru (0.2%).
Vital statistics
The total fertility rate in French Guiana has remained high and is today considerably higher than in metropolitan France, and also higher than the average of the French overseas departments. It is largely responsible for the high population growth of French Guiana.[4][5]
| Average population (x 1000) | Live births | Deaths | Natural change | Crude birth rate (per 1000) | Crude death rate (per 1000) | Natural change (per 1000) | Total fertility rate | |
|---|---|---|---|---|---|---|---|---|
| 1936 | 24 | 355 | 554 | - 199 | 14.8 | 23.1 | -8.3 | |
| 1937 | 24 | 408 | 487 | - 79 | 17.0 | 20.3 | -3.3 | |
| 1938 | 24 | 381 | 649 | - 268 | 15.9 | 27.0 | -11.2 | |
| 1939 | 24 | 333 | 499 | - 166 | 13.9 | 20.8 | -6.9 | |
| 1940 | 24 | 436 | 505 | - 69 | 18.2 | 21.0 | -2.9 | |
| 1941 | 24 | 437 | 626 | - 189 | 18.2 | 26.1 | -7.9 | |
| 1942 | 24 | 453 | 733 | - 280 | 18.9 | 30.5 | -11.7 | |
| 1943 | 24 | 422 | 702 | - 280 | 17.6 | 29.3 | -11.7 | |
| 1944 | 24 | 474 | 627 | - 153 | 19.8 | 26.1 | -6.4 | |
| 1945 | 24 | 620 | 539 | 81 | 25.8 | 22.5 | 3.4 | |
| 1946 | 24 | 515 | 596 | - 81 | 21.5 | 24.8 | -3.4 | |
| 1947 | 24 | 539 | 623 | - 84 | 22.5 | 26.0 | -3.5 | |
| 1948 | 25 | 529 | 547 | - 18 | 21.2 | 21.9 | -0.7 | |
| 1949 | 25 | 607 | 471 | 136 | 24.3 | 18.8 | 5.4 | |
| 1950 | 25 | 590 | 384 | 206 | 23.6 | 15.4 | 8.2 | |
| 1951 | 26 | 558 | 383 | 175 | 21.5 | 14.7 | 6.7 | |
| 1952 | 27 | 781 | 462 | 319 | 30.0 | 17.8 | 12.3 | |
| 1953 | 27 | 720 | 426 | 294 | 26.7 | 15.8 | 10.9 | |
| 1954 | 28 | 900 | 378 | 522 | 32.1 | 13.5 | 18.6 | |
| 1955 | 29 | 941 | 377 | 564 | 32.6 | 13.0 | 19.5 | |
| 1956 | 29 | 949 | 411 | 538 | 32.1 | 13.9 | 18.2 | |
| 1957 | 30 | 993 | 426 | 567 | 33.0 | 14.2 | 18.8 | |
| 1958 | 31 | 940 | 404 | 536 | 30.9 | 13.3 | 17.6 | |
| 1959 | 31 | 1 043 | 460 | 583 | 34.1 | 15.0 | 19.1 | |
| 1960 | 32 | 1 026 | 451 | 575 | 31.4 | 13.8 | 17.6 | |
| 1961 | 34 | 1 066 | 487 | 579 | 31.8 | 14.5 | 17.3 | |
| 1962 | 35 | 1 041 | 410 | 631 | 30.1 | 11.8 | 18.2 | |
| 1963 | 36 | 1 118 | 446 | 672 | 31.1 | 12.4 | 18.7 | |
| 1964 | 38 | 1 213 | 399 | 814 | 32.0 | 10.5 | 21.5 | |
| 1965 | 39 | 1 161 | 403 | 758 | 29.0 | 10.1 | 19.0 | |
| 1966 | 41 | 1 244 | 401 | 843 | 29.5 | 9.5 | 20.0 | |
| 1967 | 43 | 1 281 | 376 | 905 | 29.2 | 8.6 | 20.6 | |
| 1968 | 45 | 1 390 | 408 | 982 | 30.4 | 8.9 | 21.5 | |
| 1969 | 47 | 1 424 | 431 | 993 | 30.0 | 9.1 | 20.9 | |
| 1970 | 49 | 1 584 | 385 | 1 199 | 32.2 | 7.8 | 24.4 | |
| 1971 | 50 | 1 600 | 400 | 1 200 | 31.4 | 7.8 | 23.5 | |
| 1972 | 52 | 1 670 | 399 | 1 271 | 31.7 | 7.6 | 24.1 | |
| 1973 | 54 | 1 473 | 418 | 1 055 | 27.1 | 7.7 | 19.4 | |
| 1974 | 55 | 1 529 | 435 | 1 094 | 27.4 | 7.8 | 19.6 | |
| 1975 | 57 | 1 476 | 408 | 1 068 | 25.6 | 7.1 | 18.5 | |
| 1976 | 59 | 1 439 | 415 | 1 024 | 24.2 | 7.0 | 17.2 | |
| 1977 | 61 | 1 476 | 463 | 1 013 | 24.0 | 7.5 | 16.4 | |
| 1978 | 63 | 1 568 | 470 | 1 098 | 24.5 | 7.4 | 17.2 | |
| 1979 | 65 | 1 704 | 454 | 1 250 | 25.7 | 6.9 | 18.9 | |
| 1980 | 68 | 1 933 | 468 | 1 465 | 28.1 | 6.8 | 21.3 | |
| 1981 | 71 | 2 092 | 428 | 1 664 | 29.3 | 6.0 | 23.3 | |
| 1982 | 74 | 2 379 | 492 | 1 887 | 31.6 | 6.5 | 25.1 | |
| 1983 | 78 | 2 314 | 489 | 1 825 | 28.9 | 6.1 | 22.8 | |
| 1984 | 83 | 2 319 | 491 | 1 828 | 27.3 | 5.8 | 21.5 | |
| 1985 | 87 | 2 482 | 501 | 1 981 | 27.6 | 5.6 | 22.0 | |
| 1986 | 93 | 2 392 | 491 | 1 901 | 25.2 | 5.2 | 20.0 | |
| 1987 | 99 | 2 700 | 550 | 2 150 | 27.2 | 5.6 | 21.7 | |
| 1988 | 105 | 3 000 | 550 | 2 450 | 28.5 | 5.2 | 23.2 | |
| 1989 | 111 | 3 300 | 550 | 2 750 | 29.6 | 4.9 | 24.7 | |
| 1990 | 117 | 3 606 | 594 | 3 012 | 30.8 | 5.1 | 25.7 | |
| 1991 | 122 | 3 922 | 583 | 3 339 | 32.2 | 4.8 | 27.4 | |
| 1992 | 126 | 4 045 | 568 | 3 477 | 32.0 | 4.5 | 27.5 | |
| 1993 | 131 | 4 113 | 578 | 3 535 | 31.5 | 4.4 | 27.1 | |
| 1994 | 135 | 4 235 | 625 | 3 610 | 31.5 | 4.6 | 26.8 | |
| 1995 | 139 | 4 264 | 548 | 3 716 | 30.7 | 3.9 | 26.7 | |
| 1996 | 143 | 4 367 | 544 | 3 823 | 30.4 | 3.8 | 26.6 | |
| 1997 | 148 | 4 453 | 568 | 3 885 | 30.1 | 3.8 | 26.2 | |
| 1998 | 153 | 4 696 | 614 | 4 082 | 30.6 | 4.0 | 26.6 | |
| 1999 | 159 | 4 907 | 648 | 4 259 | 30.9 | 4.1 | 26.8 | 3.87 |
| 2000 | 165 | 5 149 | 634 | 4 515 | 31.2 | 3.8 | 27.4 | 3.93 |
| 2001 | 172 | 5 137 | 678 | 4 459 | 29.9 | 3.9 | 25.9 | 3.79 |
| 2002 | 179 | 5 276 | 665 | 4 611 | 29.4 | 3.7 | 25.7 | 3.73 |
| 2003 | 187 | 5 553 | 721 | 4 832 | 29.7 | 3.9 | 25.8 | 3.77 |
| 2004 | 195 | 5 312 | 719 | 4 593 | 27.3 | 3.7 | 23.6 | 3.47 |
| 2005 | 202 | 5 998 | 705 | 5 293 | 29.7 | 3.5 | 26.2 | 3.79 |
| 2006 | 208 | 6 276 | 711 | 5 565 | 30.1 | 3.4 | 26.7 | 3.80 |
| 2007 | 216 | 6 386 | 690 | 5 696 | 29.8 | 3.2 | 26.6 | 3.73 |
| 2008 | 222 | 6 247 | 762 | 5 485 | 28.4 | 3.5 | 24.9 | 3.57 |
| 2009 | 227 | 6 171 | 699 | 5 472 | 27.4 | 3.1 | 24.3 | 3.49 |
| 2010 | 233 | 6 083 | 773 | 5 310 | 26.3 | 3.3 | 23.0 | 3.37 |
| 2011 | 239 | 6 259 | 714 | 5 545 | 26.4 | 3.0 | 23.4 | 3.42 |
| 2012 | 242 | 6 609 | 789 | 5 820 | 27.2 | 3.2 | 23.9 | 3.60 |
| 2013 | 248 | 6 474 | 767 | 5 707 | 26.1 | 3.1 | 23.0 | 3.47 |
| 2014 | 255 | 6 591 | 786 | 5 805 | 25.9 | 3.1 | 22.8 | 3.47 |
| 2015 | 260 | 6 806 | 834 | 5 972 | 26.2 | 3.2 | 23.0 | 3.54 |
| 2016 | 7 270 | 901 | 6 369 | 26.9 | 3.3 | 23.6 | 3.62 |
Structure of the population
[6] Structure of the population (01.01.2010) (Provisional estimates) :
| Age Group | Male | Female | Total | % |
|---|---|---|---|---|
| Total | 113 824 | 116 617 | 230 441 | 100 |
| 0-4 | 14 591 | 13 849 | 28 440 | 12,34 |
| 5-9 | 14 090 | 13 618 | 27 708 | 12,02 |
| 10-14 | 12 843 | 12 024 | 24 867 | 10,79 |
| 15-19 | 10 729 | 10 672 | 21 401 | 9,29 |
| 20-24 | 7 728 | 8 478 | 16 206 | 7,03 |
| 25-29 | 7 281 | 9 109 | 16 390 | 7,11 |
| 30-34 | 7 692 | 8 676 | 16 368 | 7,10 |
| 35-39 | 7 877 | 8 865 | 16 742 | 7,27 |
| 40-44 | 7 415 | 7 650 | 15 065 | 6,54 |
| 45-49 | 6 698 | 6 582 | 13 280 | 5,76 |
| 50-54 | 5 397 | 5 148 | 10 545 | 4,58 |
| 55-59 | 4 207 | 4 107 | 8 314 | 3,61 |
| 60-64 | 2 931 | 2 684 | 5 615 | 2,44 |
| 65-69 | 1 740 | 1 693 | 3 433 | 1,49 |
| 70-74 | 1 083 | 1 260 | 2 343 | 1,02 |
| 75-79 | 752 | 974 | 1 726 | 0,75 |
| 80-84 | 433 | 619 | 1 052 | 0,46 |
| 85-89 | 225 | 402 | 627 | 0,27 |
| 90-94 | 77 | 144 | 221 | 0,10 |
| 95+ | 35 | 63 | 98 | 0,04 |
| Age group | Male | Female | Total | Percent |
|---|---|---|---|---|
| 0-14 | 41 524 | 39 491 | 81 015 | 35,16 |
| 15-64 | 67 955 | 71 971 | 139 926 | 60,72 |
| 65+ | 4 345 | 5 155 | 9 500 | 4,12 |
Infant mortality rate
The infant mortality in French Guiana is higher than in metropolitan France:[7]
- 2007-2009: 12.0
- 2008-2010: 11.6
- 2009-2011: 10.1
Life expectancy
At birth, life expectancy is 76.2 years for male children, and 82.8 for female (figures for 2011).[1]
Ethnic groups
Estimates of the percentages of French Guiana ethnic composition vary, a situation compounded by the large proportion of immigrants.
Creoles, or Mulattoes (people of mixed African and French ancestry), are the largest ethnic group, though estimates vary as to the exact percentage, depending upon whether the large Haitian community is included as well. Generally the Creole population is judged to be about 60 to 70% of the total population if Haitians (comprising roughly one-third of Creoles) are included, and 30 to 50% without.
Roughly 14% of the population is of European ancestry. The vast majority of these are of French heritage, though there are also people of Dutch, British, Spanish and Portuguese ancestry.
The main Asian communities are the Chinese (about 3-4%, primarily from Zhejiang province in mainland China and Hong Kong) and Hmong from Laos (1-2%). There are also smaller groups from various Caribbean islands, mainly Saint Lucia as well as Dominica. Other Asian groups include East Indians, Lebanese and Vietnamese.
The main groups living in the interior are the Maroons (formerly called "Bush Negroes") who are from African descent, and Amerindians. The Maroons, descendants of escaped African slaves, live primarily along the Maroni River. The main Maroon groups are the Saramaca, Aucan (both of whom also live in Suriname), and Boni (Aluku).
The main Amerindian groups (forming about 3%–4% of the population) are the Arawak, Carib, Emerillon (now called Teko), Galibi (now called the Kaliña), Palikur, Wayampi and Wayana. As of the late 1990s, there was evidence of an uncontacted group of Wayampi.
Languages
French and Guianese Creole French are the most widely spoken languages. There are also several native languages, including Arawak (Arawak and Palikur), Carib (Kalina and Wayana), and Tupi-Guarani (Teko and Wayampi).[8] Other languages spoken include Hakka Chinese and Javanese.[8] The official language, like for all overseas departments and territories of France, is French.
Religion
The dominant religion of French Guiana is Roman Catholicism; the Maroons and Amerindian people maintain their own religions. The Hmong people are also mainly Catholic owing to the influence of missionaries who helped bring them to French Guiana.[9]
References
- 1 2 "Résultats de la recherche - Insee". Insee.fr. Retrieved 1 August 2017.
- ↑ "Résultats de la recherche - Insee". Insee.fr. Retrieved 1 August 2017.
- ↑ "Résultats de la recherche". Insee.fr. Retrieved 1 August 2017.
- ↑ "TABLEAU P3D – INDICATEURS GÉNÉRAUX DE LA POPULATION PAR DÉPARTEMENT ET RÉGION". Insee.fr (in French). Retrieved 2017-07-09.
- ↑ "United Nations Statistics Division - Demographic and Social Statistics". Unstats.un.org. Retrieved 1 August 2017.
- ↑ "United Nations Statistics Division - Demographic and Social Statistics". Unstats.un.org. Retrieved 1 August 2017.
- ↑ "Résultats de la recherche - Insee". Insee.fr. Retrieved 1 August 2017.
- 1 2 "French Guiana". Ethnologue.com. Retrieved 1 August 2017.
- ↑ Danny Palmerlee (2007). South America. Lonely Planet. ISBN 1-74104-443-X.