Demographics of Argentina
| Demographics of Argentina | |
|---|---|
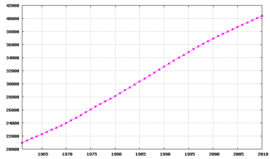 Population of Argentina, 1961–2010 | |
| Population | 43,847,430[1] |
| Growth rate | 1.036% (2010 est.)[2] |
| Birth rate | 17.75 births/1,000 population (2010 est.) |
| Death rate | 7.39 deaths/1,000 population (July 2010 est.) |
| Life expectancy | 77.14 years |
| • male | 73.9 years |
| • female | 80.54 years (2012 est.) |
| Fertility rate | 2.29 children born/woman (2012 est.) |
| Infant mortality rate | 10.52 deaths/1,000 live births |
| Net migration rate | 0 migrant(s)/1,000 population (2012 est.) |
| Age structure | |
| 0–14 years | 25.2% (male 5,450,679/ female 5,200,704) |
| 15–64 years | 63.6% (male 13,400,997/ female 13,440,948) |
| 65 and over | 11.1% (male 1,940,810/ female 2,758,356) (2012 est.) |
| Sex ratio | |
| Total | 0.97 male(s)/female (2011 est.) |
| At birth | 1.05 male(s)/female |
| Under 15 | 1.05 male(s)/female |
| 15–64 years | 1 male(s)/female |
| 65 and over | 0.7 male(s)/female |
| Nationality | |
| Nationality | Argentine |
| Language | |
| Official | Spanish language |
| Spoken | English, Italian, German, Welsh, Yiddish, Portuguese, Guarani, Quechua, Mapudungun and many others are also spoken varying by region |
This article is about the demographic features of Argentina, including population density, ethnicity, economic status and other aspects of the population.
In the 2001 census [INDEC], Argentina had a population of 36,260,130 inhabitants, and preliminary results from the 2010 census [INDEC] census were of 40,091,359 inhabitants.[3][4] Argentina ranks third in South America in total population and 33rd globally. Population density is of 15 persons per square kilometer of land area, well below the world average of 50 persons. The population growth rate in 2008 was estimated to be 0.92% annually, with a birth rate of 16.32 live births per 1,000 inhabitants and a mortality rate of 7.54 deaths per 1,000 inhabitants.
The proportion of people under 15, at 24.6%, is somewhat below the world average (28%), and the cohort of people 65 and older is relatively high, at 10.8%. The percentage of senior citizens in Argentina has long been second only to Uruguay in Latin America and well above the world average, which is currently 7%.
Argentina's population has long had one of Latin America's lowest birth rates and population growth rates (recently, about 1% a year), but it enjoys a comparatively low infant mortality rate. The median age is approximately 30 years and life expectancy at birth is of 76 years. According to an official cultural consumption survey conducted in 2006, 42.3% of Argentines speak English (though only 15.4% of those claimed to have a high level of English comprehension), 8.3% speak Portuguese[5] and 6.9% speak Italian.[6]
| Historical population | ||
|---|---|---|
| Year | Pop. | ±% |
| 1650 | 298,000 | — |
| 1778 | 420,900 | +41.2% |
| 1800 | 551,500 | +31.0% |
| 1809 | 609,200 | +10.5% |
| 1825 | 766,400 | +25.8% |
| 1839 | 926,300 | +20.9% |
| 1857 | 1,299,600 | +40.3% |
| 1869 | 1,897,000 | +46.0% |
| 1895 | 4,123,800 | +117.4% |
| 1914 | 8,162,000 | +97.9% |
| 1947 | 15,900,000 | +94.8% |
| 1960 | 20,616,000 | +29.7% |
| 1970 | 23,400,000 | +13.5% |
| 1980 | 27,949,480 | +19.4% |
| 1991 | 32,615,528 | +16.7% |
| 2001 | 36,260,130 | +11.2% |
| 2010 | 40,117,096 | +10.6% |
| 2017 | 44,044,811 | +9.8% |
| Source: [7][8] | ||
Cities
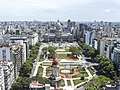
Argentina is highly urbanized,[2] with the ten largest metropolitan areas accounting for half of the population, and fewer than one in ten living in rural areas. About 3 million people live in Buenos Aires proper, and the Greater Buenos Aires metropolitan area totals around 13 million, making it one of the largest urban areas in the world.[9] The metropolitan areas of Córdoba and Rosario have around 1.3 million inhabitants each,[9] and six other cities (Mendoza, Tucumán, La Plata, Mar del Plata, Salta and Santa Fe)[9][10] have at least half a million people each.
The population is unequally distributed amongst the provinces, with about 60% living in the Pampa region (21% of the total area), including 15 million people in Buenos Aires Province, and 3 million each in Córdoba Province, Santa Fe Province and the Autonomous City of Buenos Aires. Seven other provinces each have about one million people: Mendoza, Tucumán, Entre Ríos, Salta, Chaco, Corrientes and Misiones. Tucumán is the most densely populated (with 60 inhabitants/km², the only Argentine province more densely populated than the world average), while the southern province of Santa Cruz has less than 1 inhabitant/km².
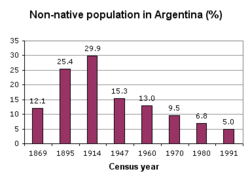
In the mid-19th century, a large wave of immigration started to arrive to Argentina due to new Constitutional policies that encouraged immigration, and issues in the countries the immigrants came from such as wars, poverty, hunger, famines, pursuit of a better life, among other reasons. The main immigration sources were from Europe, the countries from the Near and Middle East, Russia and Japan. In fact, the immigration torrent was so strong that Argentina eventually received the second-largest number of immigrants in the world, second only to the US and ahead of such immigration receptor countries such as Canada, Brazil, Australia, etc.[11][12]
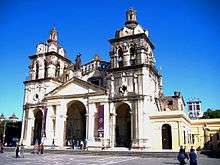
Most of these European immigrants settled in the cities which offered jobs, education and other opportunities enabling them to enter the middle class. Many also settled in the growing small towns along the expanding railway system and since the 1930s many rural workers have moved to the big cities.[13] Urban areas reflect the influence of European immigration, and most of the larger ones feature boulevards and diagonal avenues inspired by the redevelopment of Paris. Argentine cities were originally built in a colonial Spanish grid style, centered on a plaza overlooked by a cathedral and important government buildings. Many still retain this general layout, known as a damero, meaning checkerboard, since it is based on a pattern of square blocks. The city of La Plata, designed at the end of the 19th century by Pedro Benoit, combines the checkerboard layout with added diagonal avenues at fixed intervals, and was the first in South America with electric street illumination.[14]
Largest cities
| Rank | Name | Province | Pop. | Rank | Name | Province | Pop. | ||
|---|---|---|---|---|---|---|---|---|---|
 Buenos Aires 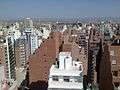 Córdoba |
1 | Buenos Aires | (Autonomous city) | 13,834,000 | 11 | Resistencia | Chaco | 409,000 | 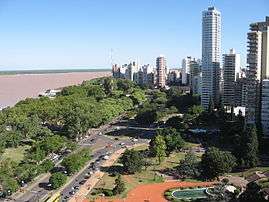 Rosario  Mendoza |
| 2 | Córdoba | Córdoba | 1,519,000 | 12 | Santiago del Estero | Santiago del Estero | 406,000 | ||
| 3 | Rosario | Santa Fe | 1,429,000 | 13 | Corrientes | Corrientes | 383,000 | ||
| 4 | Mendoza | Mendoza | 1,082,000 | 14 | Posadas | Misiones | 355,000 | ||
| 5 | Tucumán | Tucumán | 868,000 | 15 | San Salvador de Jujuy | Jujuy | 338,000 | ||
| 6 | La Plata | Buenos Aires | 836,000 | 16 | Neuquén | Neuquén | 309,000 | ||
| 7 | Mar del Plata | Buenos Aires | 633,000 | 17 | Bahía Blanca | Buenos Aires | 307,000 | ||
| 8 | Salta | Salta | 625,000 | 18 | Paraná | Entre Ríos | 274,000 | ||
| 9 | Santa Fe | Santa Fe | 530,000 | 19 | Formosa | Formosa | 258,000 | ||
| 10 | San Juan | San Juan | 513,000 | 20 | San Luis | San Luis | 218,000 | ||
Provinces and districts
| Flag | Province/District | Capital | Official Language | Population (2010)[16] | Rank | Area (km²) | Rank | Density (/km²)[16] | Rank |
|---|---|---|---|---|---|---|---|---|---|
| Buenos Aires City | – | 2,891,082 | 4 | 203 | 24 | 14,241.8 | 1 | ||
| Buenos Aires Province | La Plata | 15,594,428 | 1 | 307,571 | 1 | 50.7 | 3 | ||
| Catamarca Province | San Fernando del Valle de Catamarca | 367,820 | 20 | 102,602 | 11 | 3.6 | 20 | ||
| Chaco Province | Resistencia | 1,053,466 | 10 | 99,633 | 12 | 10.6 | 11 | ||
| Chubut Province | Rawson | Spanish, Welsh | 506,668 | 18 | 224,686 | 3 | 2.3 | 22 | |
| Córdoba Province | Córdoba | 3,304,825 | 2 | 165,321 | 5 | 20.0 | 6 | ||
| Corrientes Province | Corrientes | Spanish, Guaraní | 993,338 | 11 | 88,199 | 16 | 11.3 | 10 | |
| Entre Ríos Province | Paraná | 1,236,300 | 7 | 78,781 | 17 | 15.7 | 7 | ||
| Formosa Province | Formosa | 527,895 | 17 | 72,066 | 19 | 7.3 | 14 | ||
| Jujuy Province | San Salvador de Jujuy | 672,260 | 14 | 53,219 | 20 | 12.6 | 8 | ||
| La Pampa Province | Santa Rosa | 316,940 | 22 | 143,440 | 8 | 2.2 | 23 | ||
| La Rioja Province | La Rioja | 331,847 | 21 | 89,680 | 14 | 3.7 | 19 | ||
| Mendoza Province | Mendoza | 1,741,610 | 5 | 148,827 | 7 | 11.7 | 9 | ||
| Misiones Province | Posadas | 1,097,829 | 9 | 29,801 | 21 | 36.8 | 4 | ||
| Neuquén Province | Neuquén | 550,334 | 16 | 94,078 | 13 | 5.8 | 17 | ||
| Río Negro Province | Viedma | 633,374 | 15 | 203,013 | 4 | 3.1 | 21 | ||
| Salta Province | Salta | 1,215,207 | 8 | 155,488 | 6 | 7.8 | 12 | ||
| San Juan Province | San Juan | 680,427 | 13 | 89,651 | 15 | 7.6 | 13 | ||
| San Luis Province | San Luis | 431,588 | 19 | 76,748 | 18 | 5.6 | 18 | ||
| Santa Cruz Province | Río Gallegos | 272,524 | 23 | 243,943 | 2 | 1.1 | 24 | ||
| Santa Fe Province | Santa Fe de la Vera Cruz | 3,200,736 | 3 | 133,007 | 10 | 24.1 | 5 | ||
| Santiago del Estero Province | Santiago del Estero | 896,461 | 12 | 136,351 | 9 | 6.6 | 15 | ||
| Tierra del Fuego Province | Ushuaia | 126,190 | 24 | 21,263a | 23 | 5.8a | 16 | ||
| Tucumán Province | San Miguel de Tucumán | 1,448,200 | 6 | 22,524 | 22 | 64.3 | 2 |
a Not including claims to the Falkland Islands and the Argentine Antarctica.
Historical Total Fertility Rates and Crude Birth Rates
Sources: Pantelides and National Institute of Statistics and Census of Argentina[8]
| Years | 1869 | 1895 | 1914 | 1947 | 1960 | 1970 | 1980 | 1991 | 2000-2015 |
|---|---|---|---|---|---|---|---|---|---|
| Total Fertility Rates (children/woman) | 6.8 | 7.0 | 5.3 | 3.2 | 3.1 | 3.1 | 3.3 | 2.9 | 2.4 |
| Crude Birth Rates | 49.1 | 44.5 | 36.5 | 26.3 | 23.6 | 23.2 | 24.8 | 19.5 |
Vital statistics
The table below gives an overview of the number of birth and deaths in Argentina during the past century. Several sources were combined to construct the table.[17][18][19] The number of births in 2010 (756,176) was the highest number ever recorded. The number of deaths in 2010 also was the highest ever record. However, as the population of Argentina showed a sixfold increase during the past century, the birth and death rates in 2010 (18.7 and 7.9, respectively) were rather low in a historical perspective.
| Average population | Live births | Deaths | Natural change | Crude birth rate (per 1000) |
Crude death rate (per 1000) |
Natural change (per 1000) |
Total fertility rates[20] | |
|---|---|---|---|---|---|---|---|---|
| 1910 | 6 800 000 | 260 000 | 129 000 | 131 000 | 38.3 | 18.9 | 19.4 | |
| 1911 | 7 070 000 | 268 000 | 129 000 | 139 000 | 37.9 | 18.2 | 19.7 | |
| 1912 | 7 470 000 | 288 000 | 127 000 | 161 000 | 38.6 | 17.0 | 21.6 | |
| 1913 | 7 840 000 | 298 000 | 127 000 | 171 000 | 38.0 | 16.2 | 21.8 | |
| 1914 | 8 000 000 | 294 000 | 123 000 | 171 000 | 36.7 | 15.4 | 21.3 | |
| 1915 | 8 150 000 | 288 000 | 129 000 | 159 000 | 35.3 | 15.8 | 19.5 | |
| 1916 | 8 300 000 | 293 000 | 142 000 | 151 000 | 35.3 | 17.1 | 18.2 | |
| 1917 | 8 450 000 | 284 000 | 136 000 | 148 000 | 33.6 | 16.1 | 17.5 | |
| 1918 | 8 600 000 | 283 000 | 157 000 | 126 000 | 32.9 | 18.2 | 14.7 | |
| 1919 | 8 750 000 | 286 000 | 161 000 | 125 000 | 32.7 | 18.4 | 14.3 | |
| 1920 | 8 970 000 | 290 000 | 139 000 | 151 000 | 32.3 | 15.5 | 16.8 | |
| 1921 | 9 220 000 | 302 000 | 146 000 | 156 000 | 32.8 | 15.8 | 17.0 | |
| 1922 | 9 520 000 | 315 000 | 133 000 | 182 000 | 33.1 | 14.0 | 19.1 | |
| 1923 | 9 890 000 | 336 000 | 146 000 | 190 000 | 34.0 | 14.8 | 19.2 | |
| 1924 | 10 220 000 | 335 000 | 146 000 | 189 000 | 32.8 | 14.3 | 18.5 | |
| 1925 | 10 500 000 | 334 000 | 148 000 | 186 000 | 31.8 | 14.1 | 17.7 | |
| 1926 | 10 800 000 | 337 000 | 147 000 | 190 000 | 31.2 | 13.6 | 17.6 | |
| 1927 | 11 130 000 | 342 000 | 157 000 | 185 000 | 30.7 | 14.1 | 16.6 | |
| 1928 | 11 440 000 | 352 000 | 151 000 | 201 000 | 30.8 | 13.2 | 17.6 | |
| 1929 | 11 750 000 | 355 000 | 162 000 | 193 000 | 30.2 | 13.8 | 16.4 | |
| 1930 | 12 050 000 | 355 000 | 153 000 | 202 000 | 29.5 | 12.7 | 16.8 | |
| 1931 | 12 290 000 | 350 000 | 156 000 | 194 000 | 28.5 | 12.7 | 15.8 | |
| 1932 | 12 520 000 | 352 000 | 139 000 | 213 000 | 28.1 | 11.1 | 17.0 | |
| 1933 | 12 730 000 | 332 000 | 150 000 | 182 000 | 26.1 | 11.8 | 14.3 | |
| 1934 | 12 940 000 | 319 661 | 143 065 | 176 596 | 24.7 | 11.1 | 13.6 | |
| 1935 | 13 150 000 | 322 002 | 162 768 | 159 234 | 24.5 | 12.4 | 12.1 | |
| 1936 | 13 370 000 | 318 651 | 150 092 | 168 559 | 23.8 | 11.2 | 12.6 | |
| 1937 | 13 610 000 | 319 024 | 154 275 | 164 749 | 23.4 | 11.3 | 12.1 | |
| 1938 | 14 202 000 | 325 412 | 161 555 | 163 857 | 22.9 | 11.4 | 11.5 | |
| 1939 | 14 397 000 | 329 393 | 149 153 | 180 240 | 22.9 | 10.4 | 12.5 | |
| 1940 | 14 591 000 | 339 029 | 151 856 | 187 173 | 23.2 | 10.4 | 12.8 | |
| 1941 | 14 796 000 | 340 339 | 148 947 | 191 392 | 23.0 | 10.1 | 12.9 | |
| 1942 | 15 004 000 | 338 199 | 150 030 | 188 169 | 22.5 | 10.0 | 12.5 | |
| 1943 | 15 216 000 | 358 977 | 150 166 | 208 811 | 23.6 | 9.9 | 13.7 | |
| 1944 | 15 441 000 | 380 950 | 154 093 | 226 857 | 24.7 | 10.0 | 14.7 | |
| 1945 | 15 674 000 | 388 191 | 157 785 | 230 406 | 24.8 | 10.1 | 14.7 | |
| 1946 | 15 912 000 | 387 496 | 149 895 | 237 601 | 24.4 | 9.4 | 14.9 | |
| 1947 | 16 109 000 | 398 468 | 158 059 | 240 409 | 24.7 | 9.7 | 15.0 | |
| 1948 | 16 284 000 | 413 132 | 152 648 | 260 484 | 25.4 | 9.4 | 16.0 | |
| 1949 | 16 671 000 | 419 656 | 150 604 | 269 052 | 25.2 | 9.0 | 16.1 | |
| 1950 | 17 150 000 | 438 766 | 154 540 | 284 226 | 25.6 | 9.0 | 16.6 | 3.2 |
| 1951 | 17 506 000 | 444 326 | 156 406 | 287 920 | 25.4 | 9.0 | 16.5 | |
| 1952 | 17 865 000 | 446 156 | 153 887 | 292 269 | 25.0 | 8.6 | 16.4 | |
| 1953 | 18 224 000 | 459 734 | 162 217 | 297 517 | 25.3 | 8.9 | 16.4 | |
| 1954 | 18 580 000 | 457 559 | 156 347 | 301 212 | 24.6 | 8.4 | 16.2 | |
| 1955 | 18 931 000 | 461 293 | 167 357 | 293 936 | 24.4 | 8.8 | 15.5 | |
| 1956 | 19 277 000 | 474 142 | 161 321 | 312 821 | 24.6 | 8.4 | 16.2 | |
| 1957 | 19 618 000 | 478 368 | 179 578 | 298 790 | 24.4 | 9.2 | 15.2 | |
| 1958 | 19 955 000 | 472 865 | 166 235 | 306 630 | 23.7 | 8.3 | 15.4 | |
| 1959 | 20 291 000 | 476 211 | 173 409 | 302 802 | 23.5 | 8.5 | 14.9 | |
| 1960 | 20 625 000 | 473 038 | 179 266 | 293 772 | 22.9 | 8.7 | 14.2 | 3,1 |
| 1961 | 20 961 000 | 476 259 | 176 477 | 299 782 | 22.7 | 8.4 | 14.3 | |
| 1962 | 21 297 000 | 490 414 | 184 013 | 306 401 | 23.0 | 8.6 | 14.4 | |
| 1963 | 21 633 000 | 491 109 | 187 492 | 303 617 | 22.7 | 8.7 | 14.0 | |
| 1964 | 21 966 000 | 496 256 | 193 141 | 303 115 | 22.6 | 8.8 | 13.8 | |
| 1965 | 22 297 000 | 481 814 | 196 467 | 285 347 | 21.6 | 8.8 | 12.8 | |
| 1966 | 22 622 000 | 479 396 | 194 450 | 284 946 | 21.2 | 8.6 | 12.6 | |
| 1967 | 22 945 000 | 480 317 | 195 265 | 285 052 | 20.9 | 8.5 | 12.4 | |
| 1968 | 23 273 000 | 493 354 | 213 313 | 280 041 | 21.2 | 9.2 | 12.0 | |
| 1969 | 23 617 000 | 580 699 | 222 937 | 357 762 | 24.6 | 9.4 | 15.2 | |
| 1970 | 23 983 000 | 544 521 | 222 113 | 322 408 | 22.7 | 9.3 | 13.5 | 3.2 |
| 1971 | 24 376 000 | 564 787 | 225 000 | 339 787 | 23.2 | 9.2 | 14.0 | |
| 1972 | 24 792 000 | 559 398 | 228 000 | 331 398 | 22.6 | 9.2 | 13.4 | |
| 1973 | 25 222 000 | 561 500 | 231 000 | 330 500 | 22.3 | 9.2 | 13.1 | |
| 1974 | 25 654 000 | 590 000 | 234 000 | 356 000 | 23.0 | 9.1 | 13.9 | |
| 1975 | 26 079 000 | 620 000 | 237 000 | 383 000 | 23.8 | 9.1 | 14.7 | 3.4 |
| 1976 | 26 493 000 | 656 768 | 240 764 | 416 004 | 24.8 | 9.1 | 15.7 | |
| 1977 | 26 899 000 | 661 222 | 234 430 | 426 792 | 24.6 | 8.7 | 15.9 | |
| 1978 | 27 303 000 | 665 000 | 233 482 | 431 518 | 24.4 | 8.6 | 15.8 | |
| 1979 | 27 712 000 | 647 864 | 234 926 | 412 938 | 23.4 | 8.5 | 14.9 | |
| 1980 | 28 131 000 | 697 775 | 241 125 | 456 650 | 24.8 | 8.6 | 16.3 | 3.2 |
| 1981 | 28 562 000 | 680 292 | 241 904 | 438 388 | 23.8 | 8.5 | 15.4 | |
| 1982 | 29 001 000 | 663 429 | 234 926 | 428 503 | 22.9 | 8.1 | 14.8 | |
| 1983 | 29 448 000 | 655 876 | 233 071 | 422 805 | 22.3 | 7.9 | 14.4 | |
| 1984 | 29 900 000 | 635 323 | 255 591 | 379 732 | 21.3 | 8.6 | 12.7 | |
| 1985 | 30 354 000 | 650 783 | 241 377 | 409 406 | 21.5 | 8.0 | 13.5 | 3.0 |
| 1986 | 30 811 000 | 675 388 | 241 004 | 434 384 | 22.0 | 7.8 | 14.1 | |
| 1987 | 31 270 000 | 668 136 | 249 882 | 418 254 | 21.4 | 8.0 | 13.4 | |
| 1988 | 31 729 000 | 680 605 | 254 953 | 425 652 | 21.5 | 8.1 | 13.5 | |
| 1989 | 32 187 000 | 667 058 | 252 302 | 414 756 | 20.8 | 7.9 | 12.9 | |
| 1990 | 32 642 000 | 678 644 | 259 683 | 418 961 | 20.9 | 8.0 | 12.9 | 2.8 |
| 1991 | 33 094 000 | 694 776 | 255 609 | 439 167 | 21.0 | 7.7 | 13.3 | |
| 1992 | 33 540 000 | 678 761 | 262 287 | 416 474 | 20.2 | 7.8 | 12.4 | |
| 1993 | 33 982 000 | 667 518 | 267 286 | 400 232 | 19.6 | 7.9 | 11.8 | |
| 1994 | 34 420 000 | 673 787 | 257 431 | 416 356 | 19.6 | 7.5 | 12.1 | |
| 1995 | 34 855 000 | 658 735 | 268 997 | 389 738 | 18.9 | 7.7 | 11.2 | |
| 1996 | 35 287 000 | 675 437 | 268 715 | 406 722 | 19.1 | 7.6 | 11.5 | |
| 1997 | 35 715 000 | 692 357 | 270 910 | 421 447 | 19.4 | 7.6 | 11.8 | |
| 1998 | 36 135 000 | 683 301 | 280 180 | 403 121 | 18.9 | 7.8 | 11.2 | |
| 1999 | 36 541 000 | 686 748 | 289 543 | 397 205 | 18.8 | 7.9 | 10.9 | |
| 2000 | 36 931 000 | 701 878 | 277 148 | 424 730 | 19.0 | 7.5 | 11.5 | |
| 2001 | 37 302 000 | 683 495 | 285 941 | 397 554 | 18.3 | 7.7 | 10.7 | |
| 2002 | 37 657 000 | 694 684 | 291 190 | 403 494 | 18.4 | 7.7 | 10.7 | |
| 2003 | 38 001 000 | 697 952 | 302 064 | 395 888 | 18.4 | 7.9 | 10.4 | |
| 2004 | 38 341 000 | 736 261 | 294 051 | 442 210 | 19.2 | 7.7 | 11.5 | |
| 2005 | 38 681 000 | 721 220 | 293 529 | 427 691 | 18.6 | 7.6 | 11.1 | |
| 2006 | 39 024 000 | 696 451 | 292 313 | 404 138 | 17.8 | 7.5 | 10.4 | |
| 2007 | 39 368 000 | 700 792 | 315 852 | 384 940 | 17.8 | 8.0 | 9.8 | |
| 2008 | 39 714 000 | 746 460 | 301 801 | 444 659 | 18.8 | 7.6 | 11.2 | |
| 2009 | 40 062 000 | 745 336 | 304 525 | 440 811 | 18.6 | 7.6 | 11.0 | 2.380 |
| 2010 | 40 412 000 | 756 176 | 318 602 | 437 574 | 18.7 | 7.9 | 10.8 | 2.392 |
| 2011 | 40 900 000 | 758 042 | 319 059 | 438 983 | 18.5 | 7.8 | 10.7 | 2.379 |
| 2012[21] | 41 282 000 | 738 318 | 319 539 | 418 779 | 17.9 | 7.7 | 10.2 | 2.27 |
| 2013 | 41 690 000 | 754 603 | 326 197 | 428 406 | 18.1 | 7.8 | 10.3 | |
| 2014 | 42 669 000 | 777 012 | 325 539 | 451 437 | 18.2 | 7.6 | 10.6 | |
| 2015 | 43 131 000 | 770 040 | 333 407 | 436 633 | 17.9 | 7.7 | 10.2 | 2.28 |
| 2016 | 43 590 000 | 728 035 | 352 992 | 375 043 | 16.7 | 8.2 | 8.5 |
Structure of the population
According to the 2017 revision of the World Population Prospects[1] the total population was 43,847,430 in 2016, compared to only 17,150,000 in 1950. The proportion of children below the age of 15 in 2010 was 24.9%, 64.5% was between 15 and 65 years of age, while 10.6% was 65 years or older .[22]

| Total population | Proportion aged 0–14 (%) |
Proportion aged 15–64 (%) |
Proportion aged 65+ (%) | |
|---|---|---|---|---|
| 1950 | 17 150 000 | 30.5 | 65.3 | 4.2 |
| 1955 | 18 929 000 | 30.7 | 64.4 | 4.8 |
| 1960 | 20 619 000 | 30.7 | 63.7 | 5.5 |
| 1965 | 22 283 000 | 30.2 | 63.7 | 6.2 |
| 1970 | 23 973 000 | 29.3 | 63.8 | 6.9 |
| 1975 | 26 067 000 | 29.2 | 63.3 | 7.5 |
| 1980 | 28 106 000 | 30.3 | 61.5 | 8.2 |
| 1985 | 30 389 000 | 30.8 | 60.6 | 8.6 |
| 1990 | 32 730 000 | 30.6 | 60.4 | 9.0 |
| 1995 | 34 995 000 | 29.1 | 61.4 | 9.5 |
| 2000 | 37 057 000 | 27.9 | 62.2 | 9.9 |
| 2005 | 39 145 000 | 26.9 | 63.0 | 10.1 |
| 2010 | 41 223 000 | 25.8 | 63.8 | 10.4 |
| 2015 | 43 417 000 | 25.1 | 64.0 | 10.9 |
Structure of the population (01.07.2010 ) (Estimates- Data refer to projections based on 2001 Population Census):[23]
| Age Group | Male | Female | Total | % |
|---|---|---|---|---|
| Total | 19,846,671 | 20,672,280 | 40,518,951 | 100 |
| 0–4 | 1,740,485 | 1,679,188 | 3,419,673 | 8.44 |
| 5–9 | 1,689,364 | 1,632,628 | 3,321,992 | 8.20 |
| 10–14 | 1,735,344 | 1,679,302 | 3,414,646 | 8.43 |
| 15–19 | 1,751,386 | 1,698,173 | 3,449,559 | 8.51 |
| 20–24 | 1,697,550 | 1,652,173 | 3,349,723 | 8.27 |
| 25–29 | 1,618,705 | 1,591,188 | 3,209,903 | 7.92 |
| 30–34 | 1,628,149 | 1,620,658 | 3,248,807 | 8.02 |
| 35–39 | 1,353,587 | 1,358,431 | 2,712,018 | 6.69 |
| 40–44 | 1,179,076 | 1,194,181 | 2,373,257 | 5.86 |
| 45–49 | 1,093,940 | 1,131,951 | 2,225,891 | 5.49 |
| 50–54 | 991,757 | 1,076,899 | 2,068,656 | 5.11 |
| 55–59 | 906,470 | 996,927 | 1,903,397 | 4.70 |
| 60–64 | 760,092 | 867,044 | 1,627,136 | 4.02 |
| 65–69 | 602,756 | 726,318 | 1,329,074 | 3.28 |
| 70–74 | 456,960 | 614,371 | 1,071,331 | 2.64 |
| 75–79 | 331,313 | 513,715 | 845,028 | 2.09 |
| 80+ | 309,737 | 639,123 | 948,860 | 2.34 |
| Age group | Male | Female | Total | Percent |
|---|---|---|---|---|
| 0–14 | 5,165,193 | 4,991,118 | 10,156,311 | 25.07 |
| 15–64 | 12,980,712 | 13,187,635 | 26,168,347 | 64.58 |
| 65+ | 1,700,766 | 2,493,527 | 4,194,293 | 10.35 |
Structure of the population (01.07.2013) (Estimates) :
| Age Group | Male | Female | Total | % |
|---|---|---|---|---|
| Total | 20,409,830 | 21,250,587 | 41,660,417 | 100 |
| 0–4 | 1,749,655 | 1,687,476 | 3,437,131 | 8.25 |
| 5–9 | 1,715,945 | 1,657,086 | 3,373,031 | 8.10 |
| 10–14 | 1,700,757 | 1,645,030 | 3,345,787 | 8.03 |
| 15–19 | 1,744,462 | 1,690,668 | 3,435,130 | 8.25 |
| 20–24 | 1,730,871 | 1,683,204 | 3,414,075 | 8.20 |
| 25–29 | 1,656,747 | 1,621,991 | 3,278,738 | 7.87 |
| 30–34 | 1,622,019 | 1,607,268 | 3,229,287 | 7.75 |
| 35–39 | 1,524,110 | 1,527,463 | 3,051,573 | 7.32 |
| 40–44 | 1,261,322 | 1,275,243 | 2,536,565 | 6.09 |
| 45–49 | 1,124,926 | 1,154,104 | 2,279,030 | 5.47 |
| 50–54 | 1,032,385 | 1,099,746 | 2,132,131 | 5.12 |
| 55–59 | 929,866 | 1,033,655 | 1,963,521 | 4.71 |
| 60–64 | 811,871 | 927,818 | 1,739,689 | 4.18 |
| 65–69 | 646,847 | 782,142 | 1,428,989 | 3.43 |
| 70–74 | 484,152 | 642,176 | 1,126,328 | 2.70 |
| 75–79 | 340,769 | 524,101 | 864,870 | 2.08 |
| 80+ | 333,126 | 691,416 | 1,024,542 | 2.46 |
| Age group | Male | Female | Total | Percent |
|---|---|---|---|---|
| 0–14 | 5,166,357 | 4,989,592 | 10,155,949 | 24.38 |
| 15–64 | 13,438,579 | 13,621,160 | 27,059,739 | 64.95 |
| 65+ | 1,804,894 | 2,639,835 | 4,444,729 | 10.67 |
UN estimates
The Population Departement of the United Nations prepared the following estimates of vital statistics of Argentina. [22]
| Period | Live births per year |
Deaths per year |
Natural change per year |
CBR* | CDR* | NC* | TFR* | IMR* | Life expectancy total |
Life expectancy males |
Life expectancy females |
|---|---|---|---|---|---|---|---|---|---|---|---|
| 1950–1955 | 457,600 | 163,800 | 293,800 | 25.4 | 9.1 | 16.3 | 3.15 | 66 | 62.5 | 60.4 | 65.1 |
| 1955–1960 | 479,800 | 169,800 | 310,000 | 24.3 | 8.6 | 15.7 | 3.13 | 60 | 64.5 | 62.1 | 67.4 |
| 1960–1965 | 497,200 | 188,800 | 308,400 | 23.2 | 8.8 | 14.4 | 3.09 | 60 | 65.2 | 62.4 | 68.6 |
| 1965–1970 | 521,400 | 209,400 | 312,000 | 22.5 | 9.1 | 13.4 | 3.05 | 57 | 65.7 | 62.7 | 69.3 |
| 1970–1975 | 585,200 | 224,400 | 360,800 | 23.4 | 9.0 | 14.4 | 3.15 | 48 | 67.2 | 64.1 | 70.7 |
| 1975–1980 | 694,800 | 241,000 | 453,800 | 25.7 | 8.9 | 16.8 | 3.44 | 39 | 68.6 | 65.4 | 72.2 |
| 1980–1985 | 676,400 | 247,800 | 428,600 | 23.1 | 8.5 | 14.7 | 3.15 | 32 | 70.1 | 66.8 | 73.7 |
| 1985–1990 | 701,000 | 264,800 | 436,200 | 22.2 | 8.4 | 13.8 | 3.05 | 27 | 71.0 | 67.5 | 74.6 |
| 1990–1995 | 721,800 | 274,800 | 447,000 | 21.3 | 8.1 | 13.2 | 2.90 | 24 | 72.1 | 68.6 | 75.8 |
| 1995–2000 | 711,200 | 282,600 | 428,600 | 19.7 | 7.8 | 11.8 | 2.63 | 22 | 73.2 | 69.6 | 76.9 |
| 2000–2005 | 731,800 | 296,200 | 435,600 | 19.2 | 7.8 | 11.4 | 2.52 | 15 | 74.3 | 70.6 | 78.1 |
| 2005–2010 | 741,400 | 309,000 | 432,400 | 18.5 | 7.7 | 10.8 | 2.40 | 13 | 75.3 | 71.6 | 79.1 |
| 2010–2015 | 754,200 | 321,400 | 432,800 | 17.8 | 7.6 | 10.2 | 2.35 | 11 | 76.2 | 72.5 | 79.8 |
| 2015–2020 | 749,600 | 334,200 | 415,400 | 16.9 | 7.5 | 9.4 | 2.27 | 10 | 77.1 | 73.6 | 80.6 |
| * CBR = crude birth rate (per 1000); CDR = crude death rate (per 1000); NC = natural change (per 1000); IMR = infant mortality rate per 1000 births; TFR = total fertility rate (number of children per woman) | |||||||||||
Other demographics statistics
Between the 18th and 19th centuries, Argentina received more than 6.6 million immigrants, second only to the United States, which helped the country's population double every 20 years.[24]
Most Argentines are descended from several European ethnic groups, with more than 55% having Italian origins. The second-most common ethnic origin is Spanish. About 17% have French origins, and about 8% are descended from German immigrants. Argentina today has a large Arab population, most of whom are from Syria and Lebanon.There are also about 180,000 Asian people, mostly of Chinese and Korean origins.[24]
The Argentine government estimates there are 750,000 residents without official documents, many of whom immigrated from Paraguay, Peru, and Bolivia.[24]
Argentina's population continues to grow but at a slower rate because of its steadily declining birth rate. Argentina's fertility decline began earlier than in the rest of Latin America, occurring most rapidly between the early 20th century and the 1950s and then becoming more gradual.[25]
Life expectancy has been improving, most notably among the young and the poor.[25]
Demographic statistics according to the World Population Review.[24]
- One birth every 42 seconds
- One death every 2 minutes
- One net migrant every 111 minutes
- Net gain of one person every 1 minutes
Demographic statistics according to the CIA World Factbook, unless otherwise indicated.[25]
- Population
- 44,293,293 (July 2017 est.)
- Ethnic groups
European (mostly Spanish and Italian descent) and mestizo (mixed European and Amerindian ancestry) 97.2%, Amerindian 2.4%, African 0.4% (2010 est.)
- Age structure
- 0-14 years: 24.59% (male 5,612,766/female 5,278,857)
- 15-24 years: 15.28% (male 3,460,276/female 3,307,227)
- 25-54 years: 39.38% (male 8,707,818/female 8,733,370)
- 55-64 years: 9.13% (male 1,963,923/female 2,081,796)
- 65 years and over: 11.62% (male 2,159,811/female 2,987,449) (2017 est.)
- Total fertility rate
- 2.26 children born/woman (2017 est.) Country comparison to the world: 93rd
- Median age
- total: 31.7 years Country comparison to the world: 105th
- male: 30.5 years
- female: 32.9 years (2017 est.)
- Population growth rate
- 0.91% (2017 est.) Country comparison to the world: 121st
- Birth rate
- 16.7 births/1,000 population (2017 est.) Country comparison to the world: 110th
- Death rate
- 7.5 deaths/1,000 population (2017 est.)
- Net migration rate
- -0.1 migrant(s)/1,000 population (2017 est.) Country comparison to the world: 102nd
- Life expectancy at birth
- total population: 77.3 years. Country comparison to the world: 74th
- male: 74.2 years
- female: 80.6 years (2017 est.)
- Infant mortality rate
- total: 9.8 deaths/1,000 live births Country comparison to the world: 139th
- male: 10.7 deaths/1,000 live births
- female: 8.8 deaths/1,000 live births (2017 est.)
- Languages
Spanish (official), Italian, English, German, French, indigenous (Mapudungun, Quechua)
- Religions
Nominally Roman Catholic 92% (less than 20% practicing), Protestant 2%, Jewish 2%, other 4%
- Population distribution
- One-third of the population lives in Buenos Aires; pockets of agglomeration occur throughout the northern and central parts of the country; Patagonia to the south remains sparsely populated
- Dependency ratios
- total dependency ratio: 56.5
- youth dependency ratio: 39.4
- elderly dependency ratio: 17.1
- potential support ratio: 5.8 (2015 est.)
- Urbanization
- urban population: 91.9% of total population (2018)
- rate of urbanization: 1.07% annual rate of change (2015-20 est.)
- School life expectancy (primary to tertiary education)
- total: 17 years
- male: 16 years
- female: 18 years (2014)
- Unemployment, youth ages 15-24
- total: 18.3%. Country comparison to the world: 73rd
- male: 15.6%
- female: 22.8% (2014 est.)
- Sex ratio
- at birth: 1.06 male(s)/female
- 0-14 years: 1.06 male(s)/female
- 15-24 years: 1.05 male(s)/female
- 25-54 years: 1 male(s)/female
- 55-64 years: 0.94 male(s)/female
- 65 years and over: 0.71 male(s)/female
- total population: 0.98 male(s)/female (2017 est.)
Ethnic groups
Indigenous peoples
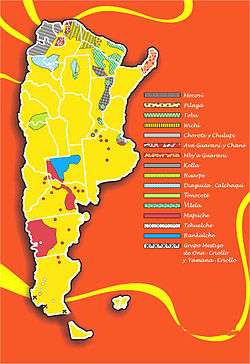
According to the data of INDEC's Complementary Survey of Indigenous Peoples (ECPI) 2004–2005, 600,000 officially recognized indigenous persons (about 1.4% of the total population) reside in Argentina. The most numerous of these communities are the Mapuches, who live mostly in the south, the Kollas and Wichís, from the northwest, and the Guaranis and Qom, who live mostly in the northeast.[27] In the census of 2010, 955,032 people self recognized as indigenous or descendants of indigenous peoples, thus representing 2.4% of the national population. This is without prejudice that more than half of the population has at least one indigenous ancestor, although in most cases family memory lost that origin.
| Ethnic group |
Survey 2004–2005 | |
|---|---|---|
| Number | % | |
| Aonikenk | 10,590 | 1.8 |
| Atacama | 3,044 | 0.5 |
| Avá-Guaraní | 21,807 | 3.6 |
| Aymara | 4,104 | 0.7 |
| Chané | 4,376 | 0.7 |
| Charrúa | 4,511 | 0.7 |
| Chorote | 2,613 | 0.4 |
| Chulupí | 553 | 0.1 |
| Comechingón | 10,863 | 1.8 |
| Diaguita/diaguita calchaquí | 31,753 | 5.3 |
| Guaraní | 22,059 | 3.7 |
| Het | 736 | 0.1 |
| Huarpe | 14,633 | 2.4 |
| Kolla | 70,505 | 11.7 |
| Lule | 854 | 0.1 |
| Mapuche | 113,680 | 18.8 |
| Mbyá | 8,223 | 1.4 |
| Mocoví | 15,837 | 2.6 |
| Omaguaca | 1,553 | 0.3 |
| Pilagá | 4,465 | 0.7 |
| Puelche | 1,585 | 0.3 |
| Qom | 69,452 | 11.5 |
| Quechua | 6,739 | 1.1 |
| Rankulche | 10,149 | 1.7 |
| Sanavirón | 563 | 0.1 |
| Selknam | 696 | 0.1 |
| Tapiete | 524 | 0.1 |
| Tonocoté | 4,779 | 0.8 |
| Wichí | 40,036 | 6.6 |
| Others | 3,864 | 0.6 |
| Not specified | 102,247 | 16.0 |
Immigration to Argentina
European settlement
As with other areas of new settlement such as Canada, Australia, the United States, Brazil, New Zealand and Uruguay, Argentina is considered a country of immigrants.[28] When it is considered that Argentina was second only to the United States (27 million of immigrants) in the number of immigrants received, even ahead of such other areas of new settlement like Canada, Brazil and Australia;[11][12] and that the country was scarcely populated following its independence, the impact of the immigration to Argentina becomes evident.
In the last national census, based on self-identification, 952,032 Argentines (2.4% of the population) declared to be Amerindians[27] Most of the 6.2 million European immigrants arriving between 1850 and 1950, regardless of origin, settled in several regions of the country. Due to this large-scale European immigration, Argentina's population more than doubled.
The majority of these European immigrants came from Italy, Spain, Germany, France, Switzerland, Wales, Ireland, Scotland, Poland, Albania, Yugoslavia, Czechoslovakia, the Austro-Hungarian Empire, the Ottoman Empire, Russia, Ukraine, Denmark, Sweden, Finland, Norway, Belgium, Luxemburg, the Netherlands, Portugal, Romania, Bulgaria, Armenia, Greece, Lithuania, Estonia, Latvia and several other regions.
Italian population in Argentina arrived mainly from the northern Italian regions varying between Piedmont, Veneto and Lombardy, later from Campania and Calabria;[29] Many Argentines have the gentilic of an Italian city, place, street or occupation of the immigrant as last name, many of them were not necessarily born Italians, but once they did the roles of immigration in Italy the name usually changed. Spanish immigrants were mainly Galicians and Basques.[30][31] Thousands of immigrants also came from France (notably Béarn and the Northern Basque Country), Germany, though most to Mexico. Switzerland, Denmark, Sweden, Norway, Ireland, Greece, Portugal, Finland, Russia and the United Kingdom.[32] The Welsh settlement in Patagonia, known as Y Wladfa, began in 1865; mainly along the coast of Chubut Province. In addition to the main colony in Chubut, a smaller colony was set up in Santa Fe and another group settled at Coronel Suárez, southern Buenos Aires Province.[33] Of the 50,000 Patagonians of Welsh descent, about 5,000 are Welsh speakers.[34] The community is centered on the cities of Gaiman, Trelew and Trevelin.[35]
Recent immigrants
.png)
According to the INDEC 1,531,940 of the Argentine resident population in 2001 were born outside Argentina, representing 4.22% of the total Argentine resident population.[37][38] In 2010, 1,805,957 of the Argentine resident population were born outside Argentina, representing 4.50% of the total Argentine resident population.[37][38][39][40]
Illegal immigration has been a recent factor in Argentine demographics. Most illegal immigrants come from Bolivia and Paraguay, countries which border Argentina to the north. Smaller numbers arrive from Peru and Ecuador. The Argentine government estimates that 750,000 inhabitants lack official documents and has launched a program called Patria Grande ("Greater Homeland")[41] to encourage illegal immigrants to regularize their status; so far over 670,000 applications have been processed under the program.[42]
| Rank (2010) | Country of birth | census 2010 | census 2001 | census 1990 |
|---|---|---|---|---|
| 1 | 550,713 | 325,046 | 254,115 | |
| 2 | 345,272 | 233,464 | 145,670 | |
| 3 | 191,147 | 212,429 | 247,987 | |
| 4 | 177,000 | 50,250 | 15,939 | |
| 4 | 157,514 | 88,260 | 15,939 | |
| 5 | 147,499 | 216,718 | 356,923 | |
| 6 | 116,592 | 117,564 | 135,406 | |
| 7 | 94,030 | 134,417 | 244,212 | |
| 8 | 41,330 | 34,712 | 33,966 | |
| 9 | 8,929 | 4,184 | 2,297 | |
| 10 | 8,416 | 10,362 | 15,451 | |
| 11 | 7,321 | 8,290 | 8,371 | |
| 12 | 6,995 | 6,578 | 6,309 | |
| 13 | 4,036 | 4,753 | 5,674 | |
| 14 | 2,875 | 3,511 | 1,870 | |
| 15 | 1,337 | 2,350 | N/D | |
| 16 | 933 | 1,619 | 3,171 | |
| Other countries | 121,018 | 127,683 | 150,849 | |
| TOTAL | 1,805,957 | 1,531,940 | 1,628,210 | |
Languages
The official language of Argentina is Spanish, and it is spoken by practically the entire population in several different accents. The most common variation of Spanish in Argentina is the River Plate Spanish (Spanish: Castellano Rioplatense), and it is so named because it evolved in the central areas around the Río de la Plata basin. Its distinctive feature is widespread voseo, the use of the pronoun vos instead of tú for the second person singular.
Non-indigenous minority languages
Many Argentines also speak other European languages (Italian, Portuguese, French, Welsh, German, Swedish and Croatian, as examples) due to the vast number of immigrants from Europe that came to Argentina.[2]
English language is a required subject in many schools, and there are also many private English-teaching academies and institutions. Young people have become accustomed to English through movies and the Internet, and knowledge of the language is also required in most jobs, so most middle-class children and teenagers now speak, read and/or understand it with various degrees of proficiency. According to an official cultural consumption survey conducted in 2006, 42.3% of Argentines claim to speak some English (though only 15.4% of those claimed to have a high level of English comprehension).[5]
Standard German is spoken by around 500,000[43][44] Argentines of German ancestry, though the number may be as high as 3,800,000 according to some sources.[45] German is the third or fourth most spoken language in Argentina.
There are sources of around one million Levantine Arabic speakers in Argentina,[43] as a result of immigration from the Middle East, mostly from Syria and Lebanon. More than 30000 Argentinian citizens speak Albanian, due to the great Albanian community living in the country since decades.
There is a prosperous community of Argentine Welsh-speakers of approximately 25,000[46] in the province of Chubut, in the Patagonia region, who descend from 19th century immigrants.
Religion
The Constitution guarantees freedom of religion, but until 1994 the President and Vice President had to be Catholic. The society, culture, and politics of Argentina are deeply imbued with Roman Catholicism.
Estimates for the number of Roman Catholics vary from 70% of the population,[47] to as much as 90%.[48] The CIA Factbook lists 92% of the country is Catholic, but only 20% are practicing regularly or weekly at a church service.[2] The Jewish population is about 300,000 (around 0.75% of the population), the community numbered about 400,000 after World War II, but the appeal of Israel and economic and cultural pressures at home led many to leave; recent instability in Israel has resulted in a modest reversal of the trend since 2003.[48][49] Muslim Argentines number about 500,000–600,000, or approximately 1.5% of the population; 93% of them are Sunni.[48] Buenos Aires is home to one of the largest mosques in Latin America. A recent study found that approximately 11% of Argentines are non-religious, including those who believe in God, though not religion, agnostics (4%) and atheists (5%). Overall, 24% attended religious services regularly. Protestants were the only group in which a majority regularly attended services.[50]
Gallery
.png) Population distribution by province.
Population distribution by province.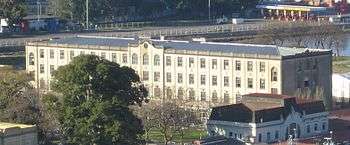 Built in 1906 to welcome hundreds of newcomers daily, the Hotel de Inmigrantes is now a national museum.
See also
References
- 1 2 "World Population Prospects: The 2017 Revision". ESA.UN.org (custom data acquired via website). United Nations Department of Economic and Social Affairs, Population Division. Retrieved 10 September 2017.
- 1 2 3 4 "Argentina". The World Factbook. Central Intelligence Agency.
- ↑ "Proyecciones provinciales de población por sexo y grupos de edad 2001–2015" (PDF). Gustavo Pérez (in Spanish). INDEC. p. 16. Archived from the original (pdf) on 6 July 2011. Retrieved 2008-06-24.
- ↑ Censo 2010: Censo Nacional de Población, Hogares y Viviendas (in Spanish)
- 1 2 Página/12, 27 December 2006. Los idiomas de los argentinos
- ↑ "Argentina". Ethnologue.com. Retrieved 15 January 2018.
- ↑ "Portal población". INDEC. Retrieved 23 February 2018.
- 1 2 Ramiro A. Flores Cruz, El crecimiento de la población argentina (PDF), pp. 2, 10
- 1 2 3 "Major Cities". Government of Argentina. Archived from the original on 19 September 2009. Retrieved 2009-09-03.
- ↑ "Ubicacion" (in Spanish). Directorate-General of Tourism, Municipality of the City of Salta. Archived from the original on 17 January 2010. Retrieved 2009-09-03.
- 1 2 "Wayback Machine" (PDF). 10 June 2007. Archived from the original (PDF) on 10 June 2007. Retrieved 15 January 2018.
- 1 2 Sánchez-Alonso, Blanca. "European Immigration into Latin America, 1870–1930" (PDF). Madrid: Universidad San Pablo-CEU. Archived from the original (PDF) on 14 August 2011.
- ↑ Rock, David. Argentina, 1516–1982. University of California Press, 1987.
- ↑ "EDELAP – 120 años de alumbrado público". Edelap.com.ar. Archived from the original on 13 May 2011. Retrieved 2010-04-25.
- ↑ "Encuesta Permanente de Hogares" (PDF). Indec. 23 August 2015. p. 3.
- 1 2 "Censo 2010 Argentina resultados definitivos: mapas". 200.51.91.231. Archived from the original on 1 September 2012. Retrieved 1 May 2012.
- ↑ B.R. Mitchell. International historical statistics: the Americas, 1750–2000.
- ↑ "Demographic Yearbook System". Unstats.un.org. Retrieved 15 January 2018.
- ↑ "Serie 5 – Estadísticas Vitales". Retrieved 2018-10-08. Dirección de Estadística e Información de Salud
- ↑ "Fecundidad", European Border Surveillance System
- ↑ "Archived copy" (PDF). Archived from the original (PDF) on 11 January 2014. Retrieved 30 January 2014.
- 1 2 "World Population Prospects - Population Division - United Nations". esa.un.org.
- ↑ "Demographic Yearbook System". Unstats.un.org. Retrieved 15 January 2018.
- 1 2 3 4 "Argentina Population 2018", World Population Review
- 1 2 3 "World Factbook SOUTH AMERICA : Argentina", The World Factbook, July 12, 2018
- 1 2 "SOUTH AMERICA :: ARGENTINA". CIA The World Factbook.
- 1 2 "Encuesta Complementaria de Pueblos Indígenas 2004–2005" (in Spanish). National Institute of Statistics and Census of Argentina.
- ↑ "About Argentina". Government of Argentina. Archived from the original on 19 September 2009. Retrieved 1 September 2009.
- ↑ "Federaciones Regionales". Feditalia.org.ar. Retrieved 2010-04-25.
- ↑ "Historical references". Cdtradition.net. Archived from the original on 8 January 2010. Retrieved 2010-04-25.
- ↑ "Monografías". Monografias.com. 7 May 2007. Retrieved 2010-04-25.
- ↑ Chavez, Lydia (23 June 1985). "New York Times: A bit of Britain in Argentina". Nytimes.com. Retrieved 2010-04-25.
- ↑ Birt, Paul W. (2005). "Welsh (in Argentina)". In Diarmuid Ó Néill (ed.). Rebuilding the Celtic Languages. Talybont: Y Lolfa. p. 146. ISBN 0-86243-723-7.
- ↑ "Wales and Argentina". Wales.com website. Welsh Assembly Government. 2008. Archived from the original on 16 July 2011. Retrieved 24 December 2010.
- ↑ Berresford Ellis, Peter (1983). The Celtic revolution: a study in anti-imperialism. Talybont: Y Lolfa. pp. 175–178. ISBN 0-86243-096-8.
- ↑ Población extranjera empadronada en el país por lugar de nacimiento Archived 13 November 2009 at the Wayback Machine. INDEC
- 1 2 Tendencias recientes de la inmigración internacional INDEC
- 1 2 Investigación de la Migración Internacional en Latinoamérica (IMILA) Archived 14 May 2008 at the Wayback Machine. Centro Latinoamericano y Caribeño de Demografía (CELADE). Comisión Económica para América Latina y el Caribe (CEPAL).
- ↑ Censo Nacional de Población, Hogares y Viviendas 2001 INDEC.
- ↑ "Cuadro P6. Total del país. Población total nacida en el extranjero por lugar de nacimiento, según sexo y grupos de edad. Año 2010" (Press release). INDEC. Archived from the original on 2 September 2011. Retrieved 2 September 2011.
- ↑ "Patria Grande". Patriagrande.gov.ar. Retrieved 2010-04-25.
- ↑ "Alientan la mudanza de extranjeros hacia el interior – Sociedad –". Perfil.com. Retrieved 2010-04-25.
- 1 2 Gordon, Raymond G., Jr. (ed.), 2005. Ethnologue: Languages of the World, Fifteenth edition. Dallas, Tex.: SIL International. Online version: Languages of Argentina, Retrieved on 2007-01-02.
- ↑ WorldLanguage website. Retrieved on 2007-01-29
- ↑ "Rápida recuperación económica tras la grave crisis". Swissinfo.org. Retrieved 15 January 2018.
- ↑ Gordon, Raymond G., Jr. (2005). "Language of Argentina". Ethnologue: Languages of the World, Fifteenth edition. SIL International. Retrieved 2008-08-21.
Welsh (25,000)
- ↑ Marita Carballo. Valores good food here al cambio del milenio ISBN 950-794-064-2. Cited in La Nación, 8 May 2005
- 1 2 3 "Argentina". International Religious Freedom Report. U.S. Department of State. 2006. Retrieved 2009-09-01.
- ↑ "Clarín". Clarin.com. 22 December 2003. Retrieved 2010-04-25.
- ↑ "Encuesta CONICET sobre creencias" (PDF). Retrieved 2010-04-25.
External links
| Africa | |||||||||||||||||||
|---|---|---|---|---|---|---|---|---|---|---|---|---|---|---|---|---|---|---|---|
| Americas |
| ||||||||||||||||||
| Asia | |||||||||||||||||||
| Europe |
| ||||||||||||||||||