Demographics of Paraguay
| Historical population | ||
|---|---|---|
| Year | Pop. | ±% |
| 1950 | 1,328,452 | — |
| 1962 | 1,819,103 | +36.9% |
| 1972 | 2,357,955 | +29.6% |
| 1982 | 3,029,830 | +28.5% |
| 1992 | 4,152,588 | +37.1% |
| 2002 | 5,163,198 | +24.3% |
| 2015 | 6,755,756 | +30.8% |
| Source: [1] | ||
This article discusses the demographic features of the population of Paraguay, including population density, ethnicity, education level, health of the populace, economic status, religious affiliations and other aspects of the population.faces
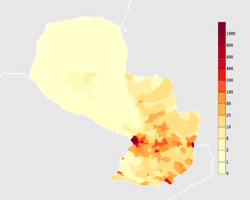
Paraguay's population is distributed unevenly through the country. The vast majority of the people live in the eastern region, most within 160 kilometres (99 mi) of Asunción, the capital and largest city, which borders on Argentina to the south and west. The Gran Chaco in the north-west, which accounts for about 60% of Paraguayan territory, is home to less than 2% of the population. The Paraguay government encouraged massive settlement of the vast Gran Chaco.
Ethnically, culturally, and socially, Paraguay has one of the most homogeneous populations in South America. About 95% of the people are mestizo (mixed Spanish and Guaraní Native American descent. Little trace is left of the original Guaraní culture except the language, which is spoken by 90% of the population. About 75% of all Paraguayans also speak Spanish. Guaraní and Spanish are official languages.
Some demographers contend that the total "mostly white" percentage has grown in the last century as a result of European immigration, and white people are now estimated at 20% or one-fifth of the country's population.
Not completely homogeneous, Paraguay has a history of other settlement, especially in the 20th century: Germans (the majority are Mennonites) with long-time Paraguayan dictator Alfredo Stroessner (President, 1954-1989) himself of German ancestry; Japanese with Okinawans; Koreans; ethnic Chinese; Arabs, Ukrainians; Poles; Southern Europeans; Jews; Brazilians; and Argentines are among those who have settled in Paraguay. There are also an estimated 234,000 Afro-Paraguayans, or 4% of the population.[2]
European and Middle Eastern immigrants began making their way to Paraguay in the decades following the Paraguayan War of 1864-1860 (from 1870 onward). Only 28,000 men and 200,000 women had survived the war, the reason why Paraguay had since then a high rate of illegitimate births. The government pursued a pro-immigration policy in an effort to increase population. Government records indicated that approximately 12,000 immigrants entered the port of Asunción between 1882 and 1907, of that total, almost 9,000 came from Italy, Germany, France, and Spain. Migrants also arrived from neighboring Spanish American countries, especially Argentina.
The immigrant ethnic groups kept their cultures and languages to some extent, especially Brazilians - known as "Brasiguayos".[3][4]
Official records gave an imprecise sense of the number of Brazilians who came to the country. According to the 1982 census, 99,000 Brazilians resided in Paraguay. Most analysts discounted this figure, however, and contended that between 300,000 and 350,000 Brazilians lived in the eastern border region.
Analysts also rejected government figures on the number of immigrants from South Korea, Hong Kong and Taiwan. The 1982 census reported that there were 2,700 Koreans in Paraguay, along with another 1,100 non-Japanese or non-Korean Asian immigrants. The actual number of Koreans and ethnic Chinese, however, was believed to be between 30,000 and 50,000. Virtually all Koreans and ethnic Chinese lived in Ciudad del Este or Asunción and played a major role in the importation and sale of electronic goods manufactured in Asia.
Paraguay became the site of radical and progressive colonies inspired by political thinkers of the late 19th and early 20th centuries. A group of radical socialist Australians in the 1890s voluntarily went to create a failed master-planned community, known as Nueva (New) Australia (1893 -1897); and Elisabeth Nietzsche, a German racial ideologist and sister of philosopher Friedrich Nietzsche came to Paraguay in her attempt to build a colony, Nueva Germania (Neues Deutschland) (founded 1886) devoted to a hypothetical pure white "Nordic" society.
Population
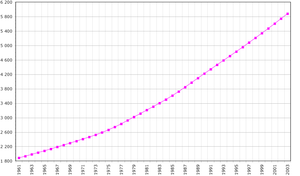
According to the 2017 revision of the World Population Prospects[5] the total population was 6,725,308 in 2016, compared to only 1,473,000 in 1950. The proportion of children below the age of 15 in 2010 was 33.5%, 61.4% was between 15 and 65 years of age, while 5.1% was 65 years or older .[6]
| Total population (x 1000) |
Proportion aged 0–14 (%) |
Proportion aged 15–64 (%) |
Proportion aged 65+ (%) | |
|---|---|---|---|---|
| 1950 | 1 473 | 47.0 | 50.1 | 2.9 |
| 1955 | 1 674 | 47.5 | 49.5 | 3.0 |
| 1960 | 1 906 | 47.8 | 49.0 | 3.2 |
| 1965 | 2 176 | 47.5 | 49.2 | 3.3 |
| 1970 | 2 483 | 46.1 | 50.4 | 3.5 |
| 1975 | 2 802 | 44.1 | 52.3 | 3.6 |
| 1980 | 3 195 | 42.5 | 53.8 | 3.8 |
| 1985 | 3 698 | 41.6 | 54.5 | 3.9 |
| 1990 | 4 244 | 41.4 | 54.6 | 4.0 |
| 1995 | 4 795 | 40.3 | 55.4 | 4.3 |
| 2000 | 5 344 | 38.2 | 57.5 | 4.4 |
| 2005 | 5 898 | 35.8 | 59.5 | 4.7 |
| 2010 | 6 455 | 33.5 | 61.4 | 5.1 |
Structure of the population[7]
Structure of the population (01.07.2013) (Projections based on the 2002 Population Census) :
| Age Group | Male | Female | Total | % |
|---|---|---|---|---|
| Total | 3 426 508 | 3 356 867 | 6 783 374 | 100 |
| 0–4 | 377 989 | 363 561 | 741 550 | 10,93 |
| 5–9 | 372 142 | 358 751 | 730 893 | 10,77 |
| 10–14 | 364 020 | 351 350 | 715 369 | 10,55 |
| 15–19 | 351 038 | 339 645 | 690 683 | 10,18 |
| 20–24 | 331 748 | 322 813 | 654 561 | 9,65 |
| 25–29 | 303 291 | 297 128 | 600 419 | 8,85 |
| 30–34 | 257 335 | 252 770 | 510 104 | 7,52 |
| 35–39 | 203 351 | 200 858 | 404 209 | 5,96 |
| 40–44 | 173 976 | 173 202 | 347 177 | 5,12 |
| 45–49 | 160 044 | 158 383 | 318 427 | 4,69 |
| 50–54 | 140 818 | 137 891 | 278 709 | 4,11 |
| 55–59 | 120 438 | 116 493 | 236 931 | 3,49 |
| 60–64 | 95 424 | 92 423 | 187 848 | 2,77 |
| 65–69 | 67 623 | 67 777 | 135 401 | 2,00 |
| 70–74 | 47 778 | 50 653 | 98 431 | 1,45 |
| 75–79 | 31 694 | 36 085 | 67 779 | 1,00 |
| 80+ | 27 800 | 37 082 | 64 882 | 0,96 |
| Age group | Male | Female | Total | Percent |
|---|---|---|---|---|
| 0–14 | 1 114 151 | 1 073 662 | 2 187 813 | 32,25 |
| 15–64 | 2 312 357 | 2 091 608 | 4 403 965 | 64,92 |
| 65+ | 174 895 | 191 597 | 366 492 | 5,40 |
Vital statistics
Registration of vital events is in Paraguay not complete. The Population Departement of the United Nations prepared the following estimates. [6]
| Period | Live births per year |
Deaths per year |
Natural change per year |
CBR* | CDR* | NC* | TFR* | IMR* | Life expectancy total |
Life expectancy males |
Life expectancy females |
|---|---|---|---|---|---|---|---|---|---|---|---|
| 1950–1955 | 70,000 | 14,000 | 56,000 | 44.3 | 8.9 | 35.4 | 6.50 | 73 | 62.6 | 60.5 | 64.6 |
| 1955–1960 | 76,000 | 15,000 | 61,000 | 42.7 | 8.6 | 34.1 | 6.50 | 70 | 63.2 | 61.1 | 65.1 |
| 1960–1965 | 84,000 | 16,000 | 68,000 | 41.3 | 8.0 | 33.3 | 6.45 | 62 | 64.3 | 62.3 | 66.3 |
| 1965–1970 | 92,000 | 18,000 | 74,000 | 39.5 | 7.6 | 31.8 | 6.15 | 59 | 65.0 | 63.0 | 66.9 |
| 1970–1975 | 94,000 | 19,000 | 75,000 | 35.6 | 7.1 | 28.6 | 5.35 | 53 | 65.9 | 63.7 | 68.0 |
| 1975–1980 | 108,000 | 21,000 | 87,000 | 36.1 | 6.9 | 29.2 | 5.20 | 51 | 66.5 | 64.3 | 68.7 |
| 1980–1985 | 129,000 | 24,000 | 105,000 | 37.3 | 6.8 | 30.4 | 5.20 | 49 | 67.0 | 64.9 | 69.3 |
| 1985–1990 | 139,000 | 26,000 | 113,000 | 34.9 | 6.6 | 28.3 | 4.77 | 47 | 67.6 | 65.4 | 69.9 |
| 1990–1995 | 145,000 | 28,000 | 117,000 | 32.0 | 6.2 | 25.8 | 4.31 | 43 | 68.5 | 66.3 | 70.8 |
| 1995–2000 | 148,000 | 30,000 | 118,000 | 29.3 | 5.9 | 23.3 | 3.88 | 39 | 69.4 | 67.2 | 71.7 |
| 2000–2005 | 151,000 | 32,000 | 119,000 | 26.9 | 5.6 | 21.3 | 3.48 | 36 | 70.7 | 68.7 | 72.9 |
| 2005–2010 | 153,000 | 34,000 | 119,000 | 24.8 | 5.5 | 19.3 | 3.08 | 32 | 71.7 | 69.7 | 73.9 |
| 2010–2015 | 161,000 | 38,000 | 123,000 | 23.9 | 5.7 | 18.2 | 2.89 | 30 | 72.2 | 70.0 | 74.5 |
| 2015–2020 | 165,000 | 43,000 | 122,000 | 22.6 | 5.8 | 16.8 | 2.72 | 28 | 72.7 | 70.4 | 75.1 |
| * CBR = crude birth rate (per 1000); CDR = crude death rate (per 1000); NC = natural change (per 1000); IMR = infant mortality rate per 1000 births; TFR = total fertility rate (number of children per woman) | |||||||||||
Births and deaths [8]
| Year | Population (x1000) | Live births | Deaths | Natural increase | Crude birth rate | Crude death rate | Rate of natural increase | TFR |
|---|---|---|---|---|---|---|---|---|
| 2012 | 118 549 | 22 807 | 95 752 | |||||
Total fertility rate
[9] Total Fertility Rate (Wanted Fertility Rate):
| Year | TFR (Total) |
|---|---|
| 1990 | 4.6 |
| 1995/96 | 4.3 |
| 1998 | 4.3 |
| 2004 | 2.9 |
| 2008 | 2,5 (2,2) |
Ethnic groups
Religions
Languages
CIA World Factbook demographic statistics
The following demographic statistics are from the CIA World Factbook, unless otherwise indicated.[11]
Median age
- male: 35.3 years
- female: 32.8 years (2007 est.)
Population growth rate
- 1.284% (2011 est.)
Sex ratio
- at birth: 1.05 male(s)/female
- under 15 years: 1.034 male(s)/female
- 15–64 years: 1.01 male(s)/female
- 65 years and over: 0.857 male(s)/female
- total population: 1.01 male(s)/female (2007 est.)
HIV/AIDS – adult prevalence rate
0.3% (2009 est.)
HIV/AIDS – people living with HIV/AIDS
13,000 (2009 est.)
HIV/AIDS – deaths
<500 (2009 est.)
Literacy
- definition: age 15 and over can read and write
- total population: 94%
- male: 94.9%
- female: 93% (2003 est.)
References
- ↑ "Evolución de la Población Total". DGEEC. Retrieved 27 July 2017.
- ↑ "Afro-Latino: A deeply rooted identity among U.S. Hispanics".
- ↑ Hilton, Ronald (2001-06-15). "BRAZIL: Brazilians in Paraguay". Retrieved 2017-01-19.
- ↑ "Culture of Paraguay - history, people, clothing, traditions, women, beliefs, food, customs, family". www.everyculture.com (in eng). Retrieved 2017-01-19.
- ↑ "World Population Prospects: The 2017 Revision". ESA.UN.org (custom data acquired via website). United Nations Department of Economic and Social Affairs, Population Division. Retrieved 10 September 2017.
- 1 2 Population Division of the Department of Economic and Social Affairs of the United Nations Secretariat, World Population Prospects: The 2010 Revision Archived 6 May 2011 at the Wayback Machine.
- ↑ http://unstats.un.org/unsd/demographic/products/dyb/dyb2.htm
- ↑ http://unstats.un.org/unsd/demographic/products/vitstats/serATab3.pdf
- ↑ http://www.cepep.org.py/archivos/ENDSSR%202008_1.pdf
- 1 2 "South America :: PARAGUAY". CIA The World Factbook.
- ↑ The World Factbook – Paraguay
| Indigenous | |||||||||
|---|---|---|---|---|---|---|---|---|---|
| Non-indigenous |
| ||||||||
Category:Ethnic groups in Paraguay | |||||||||
| History |  | ||||
|---|---|---|---|---|---|
| Geography |
| ||||
| Politics | |||||
| Economy |
| ||||
| Society |
| ||||
| |||||