Demographics of Chile
| Demographics of Chile | |
|---|---|
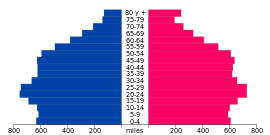 Population pyramid of Chile, 2014 | |
| Population | 17,094,270 (2010)[1] |
| Growth rate | 0.9% (2010) |
| Birth rate | 14.7 births/1,000 population (2010) |
| Death rate | 5.7 deaths/1,000 population (2010) |
| Life expectancy | 79.57 years |
| • male | 76.26 years |
| • female | 82.96 years (2010) |
| Fertility rate | 1.89 children born/woman (2010) |
| Infant mortality rate | 7.4 deaths/1,000 live births (2010)[2] |
| Age structure | |
| 0–14 years | 23.2% (male 1,966,017/female 1,877,963) |
| 15–64 years | 67.8% (male 5,625,963/female 5,628,146) |
| 65 and over | 9.1% (male 627,746/female 875,872) (2010) |
| Sex ratio | |
| Total | 0.98 male(s)/female (2010) |
| At birth | 1.05 male(s)/female |
| Under 15 | 1.05 male(s)/female |
| 15–64 years | 1 male(s)/female |
| 65 and over | 0.72 male(s)/female |
| Nationality | |
| Nationality | Chilean |
| Major ethnic | European and Mestizo 95.4%[3] |
| Minor ethnic | Mapuche 4%, other indigenous groups 0.6% (2002 census) |
| Language | |
| Official | Spanish (de facto) |
This article is about the demographic features of Chile, including population density, ethnicity, economic status and other aspects of the population.
Chile's 2002 census reported a population of 15,116,435 people. Its rate of population growth has been decreasing since 1990, due to a declining birth rate.[4] By 2050 the population is expected to reach approximately 20.2 million people.[5] About 85% of the country's population lives in urban areas, with 40% living in Greater Santiago. The largest agglomerations according to the 2002 census are Greater Santiago with 5.6 million people, Greater Concepción with 861,000 and Greater Valparaíso with 824,000.[6]
Population
| Historical population | ||
|---|---|---|
| Year | Pop. | ±% |
| 1950 | 6,081,931 | — |
| 1960 | 7,643,277 | +25.7% |
| 1970 | 9,569,631 | +25.2% |
| 1980 | 11,174,173 | +16.8% |
| 1990 | 13,178,782 | +17.9% |
| 2000 | 15,397,784 | +16.8% |
| 2010 | 17,094,270 | +11.0% |
| 2017 | 18,138,749 | +6.1% |
| Source:[7] | ||
According to the 2017 revision of the World Population Prospects[8] the total population was 17,909,754 in 2016, compared to only 6,143,000 in 1950. The proportion of children below the age of 15 in 2015 was 20.1%, 69.0% was between 15 and 65 years of age, while 10.9% was 65 years or older .[9]
| Total population (x 1000) |
Proportion aged 0–14 (%) |
Proportion aged 15–64 (%) |
Proportion aged 65+ (%) | |
|---|---|---|---|---|
| 1950 | 6 143 | 36.7 | 59.0 | 4.3 |
| 1955 | 6 862 | 38.1 | 57.4 | 4.5 |
| 1960 | 7 696 | 39.4 | 55.8 | 4.8 |
| 1965 | 8 612 | 40.4 | 54.5 | 5.0 |
| 1970 | 9 562 | 39.6 | 55.2 | 5.2 |
| 1975 | 10 421 | 36.9 | 57.7 | 5.4 |
| 1980 | 11 234 | 33.0 | 61.4 | 5.7 |
| 1985 | 12 109 | 30.6 | 63.2 | 6.2 |
| 1990 | 13 141 | 29.3 | 64.2 | 6.5 |
| 1995 | 14 194 | 28.2 | 64.8 | 7.0 |
| 2000 | 15 170 | 26.5 | 65.8 | 7.7 |
| 2005 | 16 097 | 24.0 | 67.5 | 8.5 |
| 2010 | 17 015 | 21.9 | 68.5 | 9.6 |
| 2015 | 17 948 | 20.1 | 69.0 | 10.9 |
Structure of the population[10]
Structure of the population (01.07.2013) (Estimates) :
| Age Group | Male | Female | Total | % |
|---|---|---|---|---|
| Total | 8,688,067 | 8,868,748 | 17,556,815 | 100 |
| 0–4 | 639,270 | 615,764 | 1,255,034 | 7.15 |
| 5–9 | 633,287 | 610,458 | 1,243,745 | 7.08 |
| 10–14 | 648,484 | 625,765 | 1,274,249 | 7.26 |
| 15–19 | 707,959 | 684,424 | 1,392,383 | 7.93 |
| 20–24 | 749,460 | 727,530 | 1,476,990 | 8.41 |
| 25–29 | 710,354 | 693,723 | 1,404,077 | 8.00 |
| 30–34 | 634,056 | 624,375 | 1,258,431 | 7.17 |
| 35–39 | 598,029 | 595,813 | 1,193,842 | 6.80 |
| 40–44 | 612,898 | 617,259 | 1,230,157 | 7.01 |
| 45–49 | 610,366 | 621,300 | 1,231,666 | 7.02 |
| 50–54 | 574,320 | 592,349 | 1,166,669 | 6.65 |
| 55–59 | 468,437 | 492,763 | 961,200 | 5.47 |
| 60–64 | 359,065 | 390,681 | 749,746 | 4.27 |
| 65–69 | 276,510 | 317,107 | 593,617 | 3.38 |
| 70–74 | 200,585 | 247,698 | 448,283 | 2.55 |
| 75–79 | 133,715 | 183,899 | 317,614 | 1.81 |
| 80+ | 131,272 | 227,840 | 359,112 | 2.05 |
| Age group | Male | Female | Total | Percent |
|---|---|---|---|---|
| 0–14 | 1,921,041 | 1,851,987 | 3,773,028 | 21.49 |
| 15–64 | 6,024,944 | 6,040,217 | 12,065,161 | 68.72 |
| 65+ | 742,082 | 976,544 | 1,718,626 | 9.79 |
Ancestry and ethnic structure
Chile is a multiethnic society, home to people of many different ethnic backgrounds. Studies on the ethnic structure of Chile vary significantly from one another.
A public health book from the University of Chile (currently inaccessible) states that 65% of the population is of Caucasian origin; Castizos/Mestizos with an average 60% Caucasian ancestry and 40% Native American ancestry are estimated to amount a total of 30%, while Native Americans (Amerindians) comprise the remaining 5%.[12]
UNAM professor of Latin American studies, Francisco Lizcano, in his social research estimates that a predominant 52.7% of the Chilean population can be classified as culturally European, with an estimated 44% as Mestizo.[13] Albeit this is an estimation based on cultural aspects. Other social studies put the total amount of Whites at over 60 percent.[14] Some publications, such as the CIA World Factbook, state that the entire population consist of a combined 95.4% of "Whites and Mixed-Race people", and 4.6% of Amerindians. These figures are based on a national census held in 2002, which classified the population as indigenous and non-indigenous, rather than as White or Mestizo.[15]
Despite the genetic considerations, many Chileans, if asked, would self-identify as white. However, a study performed in 2014 asked several Chileans about their ethnic self-classification, and then took a DNA test: 37.9% of the self-identified as white, yet the DNA tests showed that the average self identifying white was genetically only 74% European.[16]
The 2011 Latinobarómetro survey asked respondents in Chile what race they considered themselves to belong to. Most answered "white" (59%), while 25% said "mestizo" and 8% self-classified as "indigenous".[17] A 2002 national poll revealed that a majority of Chileans believed they possessed "some" (43.4%) or "much" (8.3%) indigenous blood, while 40.3% responded that they had none.[18]
Population genetics
An autosomal DNA study from 2014 found that the mean Chilean’s ancestry percentages were 44.34% (± 3.9%) Native American, 51.85% (± 5.44%) European and 3.81% (± 0.45%) African.[19][20] About one in two Chileans having Sub-Saharan African ancestry,[20] and 99% of the population has Native descent.[21] A 2015 study analyzing hundreds of thousands of SNPs yielded similar results – around 55% European, 43% Native, and 2% African.[22]
European immigration
Chile was never an attractive place for migrants simply because it was far from Europe, and the difficulty of reaching such a remote place,[23][24] a situation recognized in the census of 1907, the census which recorded the highest percentage of Europeans versus the total population of Chile (2.2%).[25]
The observed increase in 1885 is due in large part to the annexation of three provinces after the Pacific War and the final conquest of the Araucanía. Given that our country receives almost no foreign immigration, this increase is significant, when compared with that of more advanced countries in this regard. The comparative table that follows demonstrates this:
(...)
Except for those lucky countries that have seen in the last half century flocking to its beaches, a huge influx of immigrants, a situation that unfortunately is not ours, the rate of increase of the population of Chile, figures honorably between the rate of the most prosperous countries on Earth.
— National Institute of Statistics (Instituto Nacional de Estadísticas)[25]
The European migration did not result in a remarkable change in the ethnic composition of Chile, except in the region of Magellan.[26]
The Spaniard was actually the only relevant among European immigration to Chile,[23] since there was never a massive immigration, as happened in neighboring nations such as Argentina or Uruguay.[24] Therefore, neither have whitened the Chilean population to level of overall percentages.[24] Facts about the amount of the flow of immigration do not coincide with certain national chauvinistic discourse, in which Chile, like Argentina or Uruguay, would have been constituted due to immigration in one of the "white" Latin American countries, in contrast to what prevails in the rest of the continent.[24] However, it is undeniable that immigrants have played a role in Chilean society.[24] Between 1851 and 1924 Chile only received the 0.5% of the European immigration flow to Latin America, against 46% of Argentina, 33% of Brazil, 14% of Cuba, and 4% of Uruguay.[23] This was because most of the migration occurred across the Atlantic, not the Pacific, and that this migration occurred mostly before the construction of the Panama Canal.[23] Also, Europeans preferred to stay in countries closer to their homelands instead of taking that long tour across the Straits of Magellan or crossing the Andes.[23] In 1907, European-born reached a top of 2.2% of Chilean population,[27] it down to 1.9% in 1920,[28] and 1.6% in 1930.[29]
The largest contingent of people to have arrived in post-independence Chile came from Spain and the Basque country, a region divided between northern Spain and southern France. Estimates of the number Chileans who have one or two surnames from Basque origin ranges from 10% (1,600,000) to as high as 20% (3,200,000).[30][31][32][33][34][35][36] Note that this phenomenon occurs not only in Chile, but also in every Autonomous Community of Spain,[37] as well as in other Latin American countries one can see that a substantial portion of their populations have one or two surnames of Basque or Navarre origin,[38][39][40][41][42][43] tending to be more common in the upper classes, and hence becoming more unusual in lower classes.[44]
Chile's various waves of non-Spanish immigrants include Italians, Irish, French, Greeks, Germans, English, Scots, Croats, and Poles.
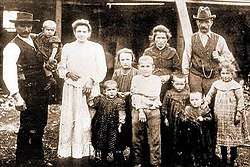
In 1848 an important and substantial German immigration took place, laying the foundation for the German-Chilean community.[45][46] Sponsored by the Chilean government for the colonization of the southern region, the Germans (including German-speaking Swiss, Silesians, Alsatians and Austrians), strongly influenced the cultural and racial composition of the southern provinces of Chile. It is difficult to count the number of descendants of Germans in Chile, given the great amount of time. Because many areas of southern Chile were sparsely populated, the traces of German immigration that are quite noticeable. An independent estimate calculates that about 500,000 Chileans could be descendants of German immigrants.[47]
Other historically significant immigrant groups included Croats, whose descendants today are estimated at 380,000 persons, or 2.4% of the Chilean population[48][49] Some authors claim that close to 4.6% of the Chilean population must have some Croatian ancestry.[50] Over 700,000 Chileans (4.5% of the Chilean population) may have British (English, Scottish, Irish or Welsh) forebears.[51] Chileans of Greek descent are estimated to number between 90,000 and 120,000;[52] most live in or near either Santiago or Antofagasta, and Chile is one of the five countries in the world most populated with descendants of Greeks.[53] The descendants of Swiss immigrants add 90,000,[54] and it is estimated that about 5% of the Chilean population has some French ancestry.[55] 600.000 Chileans descend from Italian immigrants. Other groups of Europeans have followed but are found in smaller numbers, as the descendants of Austrians[56] and Dutchmen it is currently estimated at about 50,000.[57][58] Altogether, these immigrants with their descendants, they have transformed the country culturally, economically and politically.
Indigenous communities
.jpg)
The 1907 census reported 101,118 Indians, or 3.1% of the total country population. Only those that practiced their native culture or spoke their native language were considered, irrespective of their "racial purity."[59]
According to the 2002 census, only indigenous people that still practiced a native culture or spoke a native language were surveyed, and 4.6% of the population (692,192 people) fit that description. Of that 4.6%, 87.3% declared themselves Mapuche.[60] Most of the indigenous population show varying degrees of mixed ancestry.[61]
Chile is one of the twenty-two countries to have signed and ratified the only binding international law concerning indigenous peoples, Indigenous and Tribal Peoples Convention, 1989.[62] It was adopted in 1989 as the International Labour Organization (ILO) Convention 169. Chile ratified the convention in 2008. In November 2009, a court decision in Chile, considered to be a landmark ruling in indigenous rights concerns, made use of the ILO convention 169. The Supreme Court decision on Aymara water rights upholds rulings by both the Pozo Almonte tribunal and the Iquique Court of Appeals, and marks the first judicial application of ILO Convention 169 in Chile.[63]
| Those belonging to recognised indigenous communities (2002) | |||||
|---|---|---|---|---|---|
| Alacaluf | 2,622 | 0.02% | Mapuche | 604,349 | 4.00% |
| Atacameño | 21,015 | 0.14% | Quechua | 6,175 | 0.04% |
| Aymara | 48,501 | 0.32% | Rapanui | 4,647 | 0.03% |
| Colla | 3,198 | 0.02% | Yámana | 1,685 | 0.01% |
Other ethnic groups
It is estimated that about 5% of the population (800,000) is descendant of Asian immigrants, chiefly from the Middle East (i.e. Palestinians, Syrians and Lebanese, see Arab Chileans).[64][65] Most of these are Christians from the Levant.[66] of whom roughly 500,000 are Palestinian descendants are believed to reside in Chile.[67][68][69][70][71][72]
In recent years, Chile has had a growing East Asian population, mainly from China (see Chinese Chilean), but also from Japan (see Japanese Chilean) and South Korea (see Koreans in Chile). The earliest wave of East Asian immigration took place in the late 19th and early 20th centuries, mainly Chinese and Japanese contract laborers.
Chile administers Easter Island a territory 4,100 km west of the mainland. The Rapa Nui people are native to the island and are Polynesian in origin. About 3,500 live on the island,[73] but around 10,000 came to the mainland in the 20th century.
There is a sizable population of Romani people in Chile. They are widely and easily recognized, and continue to hold on to their traditions and language, and many continue to live semi-nomadic lifestyles traveling from city to city and living in small tented communities.
Recent immigration
Since the reestablishment of democracy in Chile, the former tendency for emigrants from the country to outnumber immigrants to it has reversed. Chile now is one of the two countries in Latin America with a positive migration rate.[74]
Today, the principal immigrant groups correspond to the countries bordering Chile. Argentines constitute the largest group, followed by Peruvians and the other top eight are Latin American. One of the main factors contributing to such immigration has been the growth of the Chilean economy during the past few decades. Immigration from other Latin American countries has also occurred, notably Venezuela, Dominican Republic and Haiti, contributed to develop Chile's small African descendant population.
According to the 2002 report of the International Organization for Migration, more than 10,000 people from the United States have emigrated to Chile. Most of these arrived in Chile initially to work for multinational corporations. Most possess professional degrees, and most are well situated economically.
Languages
The Spanish spoken in Chile is distinctively accented and quite unlike that of neighbouring South American countries because final syllables and "s" sounds are dropped, and some consonants have a soft pronunciation. Accent varies only very slightly from north to south; more noticeable are the small differences in accent based on social class or whether one lives in the city or the country. That the Chilean population was largely formed in a small section at the center of the country and then migrated in modest numbers to the north and south helps explain this relative lack of differentiation, which was maintained by the national reach of radio, and now television, which also helps to diffuse and homogenize colloquial expressions.[75]
There are several indigenous languages spoken in Chile: Mapudungun, Quechua, Aymara and Rapa Nui. After the Spanish invasion, Spanish took over as the lingua franca and the indigenous languages have become minority languages, with some now extinct or close to extinction.[76]
German is spoken to a great extent in southern Chile,[77] either in small countryside pockets or as a second language among the communities of larger cities.
Through initiatives such as the English Opens Doors program, the government made English mandatory for students in fifth-grade and above in public schools. Most private schools in Chile start teaching English from kindergarten.[78] Common English words have been absorbed and appropriated into everyday Spanish speech.[79] Since 2010, all students from 3rd grade in secondary school have been tested on listening and reading comprehension in English. The evaluation is compulsory and the instrument is TOIEC Bridge, developed by Educational Testing Service.
Religion
In the most recent census (2002), 70 percent of the population over age 14 identified as Roman Catholic and 15.1 percent as evangelical. In the census, the term "evangelical" referred to all non-Catholic Christian churches with the exception of the Orthodox Church (Arab, Greek, Persian, Serbian, Ukrainian, and Armenian), The Church of Jesus Christ of Latter-day Saints (LDS Church), Seventh-day Adventists, and Jehovah's Witnesses. Approximately 90 percent of evangelicals are Pentecostal. Wesleyan, Lutheran, Reformed Evangelical, Presbyterian, Anglican, Episcopalian, Baptist and Methodist churches are also present.[80] Non-religious people, atheists account for around 8% of the population.
Vital statistics
Official statistics[81]
| Average population (x 1000) | Live births | Deaths | Natural change | Crude birth rate (per 1000) | Crude death rate (per 1000) | Natural change (per 1000) | Total fertility rate | |
|---|---|---|---|---|---|---|---|---|
| 1985 | 12,047 | 261,978 | 73,534 | 188,444 | 21.7 | 6.1 | 15.6 | |
| 1986 | 12,248 | 272,997 | 72,209 | 200,788 | 22.3 | 5.9 | 16.4 | |
| 1987 | 12,454 | 279,762 | 70,559 | 209,203 | 22.5 | 5.7 | 16.8 | |
| 1988 | 12,667 | 296,581 | 74,435 | 222,146 | 23.4 | 5.9 | 17.5 | |
| 1989 | 12,883 | 303,798 | 75,453 | 228,345 | 23.6 | 5.9 | 17.7 | |
| 1990 | 13,179 | 307,522 | 78,434 | 229,118 | 23.3 | 6.0 | 17.3 | |
| 1991 | 13,422 | 299,456 | 74,862 | 224,594 | 22.3 | 5.6 | 16.7 | |
| 1992 | 13,665 | 293,787 | 74,090 | 219,697 | 21.5 | 5.4 | 16.1 | 2.36 |
| 1993 | 13,908 | 290,438 | 76,261 | 214,177 | 20.9 | 5.5 | 15.4 | 2.32 |
| 1994 | 14,152 | 288,175 | 75,445 | 212,730 | 20.4 | 5.3 | 15.1 | 2.28 |
| 1995 | 14,395 | 279,928 | 78,517 | 201,411 | 19.4 | 5.5 | 13.9 | 2.20 |
| 1996 | 14,596 | 278,729 | 79,123 | 199,606 | 19.1 | 5.4 | 13.7 | 2.18 |
| 1997 | 14,796 | 273,641 | 78,472 | 195,169 | 18.5 | 5.3 | 13.2 | 2.13 |
| 1998 | 14,997 | 270,637 | 80,257 | 190,380 | 18.0 | 5.4 | 12.6 | 2.10 |
| 1999 | 15,197 | 263,867 | 81,984 | 181,883 | 17.4 | 5.4 | 12.0 | 2.04 |
| 2000 | 15,398 | 261,993 | 78,814 | 183,179 | 17.0 | 5.1 | 11.9 | 2.00 |
| 2001 | 15,572 | 259,069 | 81,871 | 177,198 | 16.6 | 5.3 | 11.3 | 1.98 |
| 2002 | 15,746 | 251,559 | 81,080 | 170,479 | 16.0 | 5.1 | 10.9 | 1.92 |
| 2003 | 15,919 | 246,827 | 83,672 | 163,155 | 15.5 | 5.3 | 10.2 | 1.87 |
| 2004 | 16,093 | 242,476 | 86,138 | 156,338 | 15.1 | 5.4 | 9.7 | 1.83 |
| 2005 | 16,267 | 242,980 | 86,102 | 156,878 | 14.9 | 5.3 | 9.6 | 1.82 |
| 2006 | 16,433 | 243,561 | 85,639 | 157,922 | 14.8 | 5.2 | 9.6 | 1.81 |
| 2007 | 16,598 | 242,054 | 93,000 | 149,054 | 14.6 | 5.6 | 9.0 | 1.87 |
| 2008 | 16,763 | 248,366 | 90,168 | 158,198 | 14.8 | 5.4 | 9.4 | 1.90 |
| 2009 | 16,929 | 253,584 | 91,965 | 161,619 | 15.0 | 5.4 | 9.6 | 1.92 |
| 2010 | 17,094 | 251,199 | 97,930 | 153,269 | 14.7 | 5.7 | 9.0 | 1.89 |
| 2011 | 17,2481 | 247,358 | 94,985 | 152,373 | 14.4 | 5.5 | 8.9 | 1.85 |
| 2012 | 17,445 | 243,635 | 98,711 | 144,924 | 14.0 | 5.7 | 8.3 | 1.80 |
| 2013 | 242,862 | 99,770 | 143,092 | 13.8 | 5.7 | 8.1 | ||
| 2014 | 252,194 | 101,960 | 150,234 | 14.2 | 5.7 | 8.5 | ||
| 2015 | 244,670 | 103,327 | 141,343 | 13.6 | 5.8 | 7.8 | 1.80 | |
| 2016 | 231,749 | 104,026 | 127,723 | 13.1 | 5.9 | 7.2 | 1.70 |
1This estimate and those of previous years were made before the 2012 census results were known.
United Nations estimates
The Population Departement of the United Nations prepared the following estimates. [9]
| Period | Live births per year |
Deaths per year |
Natural change per year |
CBR* | CDR* | NC* | TFR* | IMR* | Life expectancy total |
Life expectancy males |
Life expectancy females |
|---|---|---|---|---|---|---|---|---|---|---|---|
| 1950–1955 | 244,000 | 94,000 | 150,000 | 37.5 | 14.5 | 23.0 | 5.15 | 120 | 54.9 | 52.9 | 56.8 |
| 1955–1960 | 268,000 | 95,000 | 173,000 | 36.8 | 13.1 | 23.7 | 5.18 | 118 | 56.2 | 53.8 | 58.7 |
| 1960–1965 | 285,000 | 95,000 | 190,000 | 35.0 | 11.6 | 23.4 | 4.96 | 109 | 58.1 | 55.3 | 61.0 |
| 1965–1970 | 291,000 | 93,000 | 198,000 | 32.1 | 10.2 | 21.9 | 4.46 | 89 | 60.8 | 57.7 | 63.9 |
| 1970–1975 | 271,000 | 88,000 | 183,000 | 27.1 | 8.8 | 18.3 | 3.57 | 69 | 63.7 | 60.6 | 67.0 |
| 1975–1980 | 257,000 | 84,000 | 173,000 | 23.8 | 7.8 | 16.0 | 2.93 | 45 | 67.4 | 64.0 | 70.8 |
| 1980–1985 | 265,000 | 82,000 | 183,000 | 22.7 | 7.1 | 15.6 | 2.66 | 24 | 70.9 | 67.4 | 74.4 |
| 1985–1990 | 286,000 | 81,000 | 205,000 | 22.7 | 6.4 | 16.3 | 2.60 | 18 | 72.8 | 69.6 | 76.0 |
| 1990–1995 | 278,000 | 80,000 | 198,000 | 20.4 | 5.9 | 14.5 | 2.38 | 14 | 74.5 | 71.5 | 77.4 |
| 1995–2000 | 261,000 | 80,000 | 181,000 | 17.8 | 5.5 | 12.3 | 2.16 | 12 | 75.9 | 72.8 | 78.9 |
| 2000–2005 | 248,000 | 82,000 | 166,000 | 15.9 | 5.2 | 10.7 | 2.00 | 8 | 77.9 | 74.8 | 80.9 |
| 2005–2010 | 240,000 | 85,000 | 155,000 | 14.5 | 5.1 | 9.4 | 1.88 | 7 | 78.6 | 75.5 | 81.7 |
| 2010–2015 | 235,000 | 89,000 | 146,000 | 13.5 | 5.1 | 8.4 | 1.78 | 6 | 79.8 | 77.0 | 82.6 |
| 2015–2020 | 233,000 | 96,000 | 137,000 | 13.3 | 5.2 | 7.5 | 1.73 | 5 | 81.0 | 78.3 | 83.6 |
| * CBR = crude birth rate (per 1000); CDR = crude death rate (per 1000); NC = natural change (per 1000); IMR = infant mortality rate per 1000 births; TFR = total fertility rate (number of children per woman) | |||||||||||
2012 Census
According to the Chilean census held in 2012, the population of Chile was 16,634,603.[82]
The methodology used for the census was questioned by advisors to the National Statistics Institute (INE), however, which led to an investigation and the resignation of its director, Francisco Labbé, in April 2013. At the same time, the Chilean government ruled out doing the census over again.[82][83]
Largest cities
This list includes conurbations and cities with over 150,000 inhabitants. Information is from the 2002 census. (Note: The population given is limited to the city area and is not the population in the whole commune.)[84]


Graphs and maps
 Chile. Population density by commune, based on 2002 census (2009)
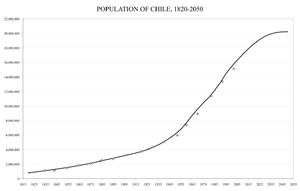 Population from 1820, projected up to 2050
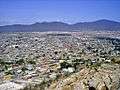
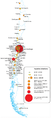 Agglomerations and cities above 10,000 inhabitants in 2005
References
- ↑ "Archived copy" (PDF). Archived from the original (PDF) on February 14, 2010. Retrieved 2010-04-21.
- ↑ "Defunciones y Mortalidad Infantil". deis.minsal.cl. Archived from the original on August 28, 2012. Retrieved November 19, 2015.
- ↑ "Chile". The World Factbook. Central Intelligence Agency.
- ↑ "Anuario Estadísticas Vitales 2003". Instituto National de Estadísticas.
- ↑ "Chile: Proyecciones y Estimaciones de Población. Total País 1950–2050" (PDF). Instituto National de Estadísticas.
- ↑ "List of Chilean cities". Observatorio Urbano, Ministerio de Vivienda y Urbanismo de Chile. Archived from the original on March 4, 2016. Retrieved February 5, 2016.
- ↑ "CHILE: Proyecciones y Estimaciones de Población . Total País 1950-2050CHILE: Proyecciones y Estimaciones de Población . Total País 1950-2050". Instituto Nacional de Estadísticas de Chile. Retrieved 27 July 2017.
- ↑ "World Population Prospects: The 2017 Revision". ESA.UN.org (custom data acquired via website). United Nations Department of Economic and Social Affairs, Population Division. Retrieved 10 September 2017.
- 1 2 "World Population Prospects - Population Division - United Nations". esa.un.org. Retrieved November 19, 2015.
- ↑ "United Nations Statistics Division - Demographic and Social Statistics". unstats.un.org. Retrieved November 19, 2015.
- 1 2 3 "South America :: CHILE". CIA The World Factbook.
- ↑ "5.2.6. Estructura racial". La Universidad de Chile. Archived from the original on October 16, 2007. Retrieved August 26, 2007. (Main page Archived September 16, 2009, at the Wayback Machine.)
- ↑ Composición Étnica de las Tres Áreas Culturales del Continente Americano al Comienzo del Siglo XXI.
- ↑ Esteva-Fabregat (1988). "El mestizaje en lberoamérica".
a white majority that would exceed 60% of the Chilean population
Missing or empty|url=(help) - ↑ "CIA World Factbook: Chile". Cia.gov. Retrieved September 22, 2011.
- ↑ Ruiz-Linares, Andrés; Adhikari, Kaustubh; Acuña-Alonzo, Victor; Quinto-Sanchez, Mirsha; Jaramillo, Claudia; Arias, William; Fuentes, Macarena; Pizarro, María; Everardo, Paola (2014-09-25). "Admixture in Latin America: Geographic Structure, Phenotypic Diversity and Self-Perception of Ancestry Based on 7,342 Individuals". PLoS Genetics. 10 (9). doi:10.1371/journal.pgen.1004572. PMC 4177621. PMID 25254375.
- ↑ Informe Latinobarómetro 2011, Latinobarómetro.
- ↑ "Encuesta CEP, Julio 2002" (in Spanish). July 2002. Archived from the original on April 29, 2013. Retrieved May 18, 2012.
- ↑ Fuentes, M; Pulgar, I; Gallo, C; Bortolini, MC; Canizales-Quinteros, S; Bedoya, G; González-José, R; Ruiz-Linares, A; Rothhammer, F (2014). "[Gene geography of Chile: regional distribution of American, European and African genetic contributions]". Rev Med Chil. 142: 281–9. doi:10.4067/S0034-98872014000300001. PMID 25052264.
- 1 2 "281 artículos de investigación Rev Med Chile 2014; 142: 281-289 Geografía génica de Chile" (PDF). April 25, 2014. Retrieved November 19, 2015.
- ↑ "Chileno promedio tiene casi igual proporción de genes indígenas y europeos" (in Spanish). Revista Agua. El Mercurio. March 18, 2015. Archived from the original on October 2, 2016. Retrieved September 30, 2016.
- ↑ "Genetic structure characterization of Chileans reflects historical immigration patterns : Nature Communications : Nature Publishing Group". nature.com. Retrieved November 19, 2015.
- 1 2 3 4 5 De los Vascos, Oñati y los Elorza DE LOS VASCOS, OÑATI Y LOS ELORZA Waldo Ayarza Elorza. Page 59, 65, 66
- 1 2 3 4 5 Salazar Vergara, Gabriel; Pinto, Julio (1999). "La Presencia Inmigrante". Historia Contemporánea de Chile. Santiago de Chile: LOM Ediciones. pp. 76–81. ISBN 956-282-174-9. Retrieved September 16, 2012.
- 1 2 Instituto Nacional de Estadísticas: 1907 Population Census, Page XVII (Page 14/1277 in the PDF document) (in Spanish)
- ↑ Instituto Nacional de Estadísticas de Chile: Censo de población de 1907, page-PDF 55/1277 and page-PDF 1249/1277 (in Spanish)
- ↑ Censo de Población 1907
- ↑ Censo de Población 1920
- ↑ Censo de Población 1930
- ↑ Diariovasco. Diariovasco. (December 1, 1997).
- ↑ vascos Ainara Madariaga: Autora del estudio "Imaginarios vascos desde Chile La construcción de imaginarios vascos en Chile durante el siglo XX".
- ↑ Basques au Chili. Euskonews.com.
- ↑ Contacto Interlingüístico e intercultural en el mundo hispano.instituto valenciano de lenguas y culturas. Universitat de València Cita: "Un 20% de la población chilena tiene su origen en el País Vasco".
- ↑ (in Spanish) La población chilena con ascendencia vasca bordea entre el 15% y el 20% del total, por lo que es uno de los países con mayor presencia de emigrantes venidos de Euskadi. Archived February 2, 2010, at the Wayback Machine.
- ↑ De los Vascos, Oñati y los Elorza DE LOS VASCOS, OÑATI Y LOS ELORZA Waldo Ayarza Elorza.
- ↑ (in Spanish) Presencia vasca en Chile.
- ↑ Apellidos y migraciones internas en la España cristiana de la Reconquista. Fernando González del Campo Román
- ↑ "Presente y futuro de los Centros Vascos en Argentina (I de III)". Archived from the original on September 21, 2003. Retrieved November 19, 2015.
- ↑ Luis Gorostiza, (1912).
- ↑ Vascos en Colombia, Tomos 1 y 2, Francisco de Abrisketa, Jaime de Kerexet
- ↑ Christian, Shirley (November 21, 1989). "Montevideo Journal: Basques Have Lots to Boast of (and at Times Do)". The New York Times. Retrieved April 26, 2010.
A fourth of Uruguay's three million people have at least one parent with a Basque surname.
- ↑ Bacaicoa Sanz, Francisco: "Apellidos vascos en el México de los Virreyes", en BIAEV, XXX, Bilbao, 1979.
- ↑ De Ispizúa, Segundo: Los vascos en América: Simón Bolívar Volumen 2;Volumen 5
- ↑ Presencia vasca en América, 1492–1992: una mirada crítica
(Fragment)Hoy día los apellidos vascos son frecuentes en los grupos dirigentes, políticos y económicos, de gran número de países de América Latina. Una lista de las cincuenta mayores familias propietarias de Argentina...
- ↑ (in Spanish) Los colonos Archived January 16, 2013, at the Wayback Machine.
- ↑ (in Spanish) Alemanes en Chile. Archived October 16, 2013, at the Wayback Machine.
- ↑ "Alemanes en Chile: entre el pasado colono y el presente empresarial" (in Spanish). Deustche-Welle. March 31, 2011. Retrieved December 22, 2012.
Hoy, el perfil de los alemanes residentes aquí es distinto y ya no tienen el peso numérico que alguna vez alcanzaron. En los años 40 y 50 eran en Chile el segundo mayor grupo de extranjeros, representando el 13% (13.000 alemanes). Según el último censo de 2002, en cambio, están en el octavo lugar: son sólo 5.500 personas, lo que equivale al 3% de los foráneos. Sin embargo, la colonia formada por familias de origen alemán es activa y numerosa. Según explica Karla Berndt, gerente de comunicaciones de la Cámara Chileno-Alemana de Comercio (Camchal), los descendientes suman 500.000. Concentrados en el sur y centro del país, donde encuentran un clima más afín, su red de instituciones es amplia. “Hay clínicas, clubes, una Liga Chileno-Alemana, compañías de bomberos y un periódico semanal en alemán llamado Cóndor. Chile es el lugar en el que se concentra el mayor número de colegios alemanes, 24, lo que es mucho para un país tan chico de sólo 16 millones de habitantes”, relata Berndt. / (Translation) Today, the profile of the Germans living here is different and no longer have the numerical weight they once reached. In the 1940s and 1950s they were in Chile's second largest foreign group, accounting for 13% (13,000 Germans). According to the last census in 2002, however, they are in eighth place: they are only 5,500 people, equivalent to 3% of outsiders. However, the colony of families of German origin is active and numerous. According to Karla Berndt, communications manager for the German-Chilean Chamber of Commerce (Camchal), descendants totaled 500,000. Concentrated in the south and center of the country, where they find a more congenial climate, its network of institutions is wide. "There are clinics, clubs, a Chilean-German League, fire companies and a German weekly newspaper called Condor. Chile is the place in which the largest number of German schools, 24 which is a lot for such a small country of only 16 million people", says Berndt.
- ↑ (in Spanish) Diaspora Croata.
- ↑ Splitski osnovnoškolci rođeni u Čileu. Archived September 17, 2011, at the Wayback Machine.
- ↑ "Hrvatski Dom - Inmigrantes Croatas". hrvatski.cl. Archived from the original on March 3, 2016. Retrieved November 19, 2015.
- ↑ "Historia de Chile, Británicos y Anglosajones en Chile durante el siglo XIX". Retrieved April 26, 2009.
- ↑ (in Spanish) Embajada de Grecia en Chile. Archived October 16, 2015, at the Wayback Machine.
- ↑ (in Spanish) Griegos de Chile Archived October 16, 2015, at the Wayback Machine.
- ↑ "90,000 descendants of Swiss in Chile". web.archive.org. Archived from the original on September 3, 2009. Retrieved November 19, 2015.
- ↑ (in Spanish) 5% de los chilenos tiene origen frances. Archived April 12, 2008, at the Wayback Machine.
- ↑ "L. de Jong, De Duitse Vijfde Colonne in de Tweede Wereldoorlog · dbnl | Hoofdstuk XVI Historisch tussenspel". dbnl.org. Retrieved November 19, 2015.
- ↑ Dutch immigration. Archived August 18, 2013, at the Wayback Machine.
- ↑ "A principios del siglo XX | Holando-bóers al sur de Chile". members.tripod.com. Retrieved November 19, 2015.
- ↑ "1907 census". Memoriachilena.cl. Retrieved May 16, 2010.
- ↑ "Censo 2002 – Síntesis de Resultados" (PDF). Instituto Nacional de Estadísticas.
- ↑ "El gradiente sociogenético chileno y sus implicaciones ético-sociales". Medwave.cl. June 15, 2000. Archived from the original on August 18, 2013. Retrieved May 16, 2010.
- ↑ "ILOLEX: submits English query". Ilo.org. January 9, 2004. Archived from the original on December 25, 2009. Retrieved May 16, 2010.
- ↑ "Chile's Supreme Court Upholds Indigenous Water Use Rights". The Santiago Times. November 30, 2009. Retrieved March 2, 2010.
- ↑ (in Spanish) Arabes de Chile.
- ↑ (in Spanish) En Chile viven unas 700.000 personas de origen árabe y de ellas 500.000 son descendientes de emigrantes palestinos que llegaron a comienzos del siglo pasado y que constituyen la comunidad de ese origen más grande fuera del mundo árabe. Archived March 18, 2012, at the Wayback Machine.
- ↑ "Arab". blog-v.com. Retrieved November 19, 2015.
- ↑ "Chile: Palestinian refugees arrive to warm welcome - Adnkronos Culture And Media". adnkronos.com. Retrieved November 19, 2015.
- ↑ (in Spanish) 500,000 descendientes de primera y segunda generación de palestinos en Chile. Archived May 13, 2011, at the Wayback Machine.
- ↑ (in Spanish) Santiago de Chile es un modelo de convivencia palestino-judía.
- ↑ Exiling Palestinians to Chile. Archived May 16, 2008, at the Wayback Machine.
- ↑ (in Spanish) Chile tiene la comunidad palestina más grande fuera del mundo árabe, unos 500.000 descendientes.
- ↑ "En detrimento de Israel - Acercamiento arabe a America Latina por Natalio Steiner, co-director de Comunidades | En detrimento de Israel Acercamiento arabe a America Latina". delacole.com. Retrieved November 19, 2015.
- ↑ Instituto Nacional de Estadistica de Chile Archived March 7, 2012, at the Wayback Machine.(INE).
- ↑ "United Nations Population Division" (PDF). un.org. Retrieved November 19, 2015.
- ↑ "Development and Breakdown of Democracy, 1830–1973". Country Studies. Library of Congress. March 31, 1994.
- ↑ "Languages of Chile".
- ↑ Oliver Zoellner. "Oliver Zoellner | Generating Samples of Ethnic Minorities in Chile". Research-worldwide.de. Retrieved December 17, 2009.
- ↑ "Repeat after me: Hello, my name is". Globalpost.com. Archived from the original on August 11, 2010. Retrieved May 16, 2010.
- ↑ "Anglicism in Chilean Spanish". Scielo.cl. May 4, 2004. Retrieved May 16, 2010.
- ↑ "Chile". International Religious Freedom Report. United States Department of State. September 19, 2008.
- ↑ "DEIS". deis.cl. Retrieved November 19, 2015.
- 1 2 "Statistics in Chile: How many Chileans? | The Economist". web.archive.org. Archived from the original on 2013-05-01. Retrieved November 19, 2015.
- ↑ Instituto Nacional de Estadísticas - canales web 2015. "Censo 2017 - Todos Contamos". censo.cl. Retrieved November 19, 2015.
- ↑ Chile: Ciudades, Pueblos, Aldeas y Caseríos 2005, Instituto Nacional de Estadísticas – June 2005.
- ↑ Chile: Ciudades, Pueblos, Aldeas y Caseríos 2005, Instituto Nacional de Estadísticas – June 2005.

| |||||||||
| |||||||||
Category:Ethnic groups in Chile | |||||||||