Laffer curve
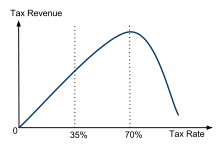
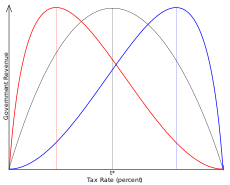
In economics, the Laffer curve illustrates a theoretical relationship between rates of taxation and the resulting levels of government revenue. It illustrates the concept of taxable income elasticity—i.e., taxable income changes in response to changes in the rate of taxation. The Laffer curve assumes that no tax revenue is raised at the extreme tax rates of 0% and 100%, and that there is a rate between 0% and 100% that maximizes government taxation revenue. The Laffer curve is typically represented as a graph that starts at 0% tax with zero revenue, rises to a maximum rate of revenue at an intermediate rate of taxation, and then falls again to zero revenue at a 100% tax rate. However, the shape of the curve is uncertain and disputed among economists.[1] Under some assumptions, such as revenue being a continuous function of the rate of taxation, the maximum illustrated by the Laffer curve is a result of Rolle's theorem, which is a standard result in calculus.[2][3]
One implication of the Laffer curve is that increasing tax rates beyond a certain point is counter-productive for raising further tax revenue. A hypothetical Laffer curve for any given economy can only be estimated and such estimates are controversial. The New Palgrave Dictionary of Economics reports that estimates of revenue-maximizing tax rates have varied widely, with a mid-range of around 70%.[4] There is a consensus among leading economists that a reduction in the US federal income tax rate would not raise annual total tax revenue.[5]
The Laffer curve was popularized in the United States with policymakers following an afternoon meeting with Ford Administration officials Dick Cheney and Donald Rumsfeld in 1974, in which Arthur Laffer reportedly sketched the curve on a napkin to illustrate his argument.[6] The term "Laffer curve" was coined by Jude Wanniski, who was also present at the meeting. The basic concept was not new; Laffer himself notes antecedents in the writings of the 14th-century social philosopher Ibn Khaldun and others.[7]
History
Arthur Laffer, The Laffer Curve: Past, Present, and Future[7]
Origin
Laffer does not claim to have invented the concept; he notes that there are antecedents, including in the Muqaddimah by 14th-century Tunisian scholar Ibn Khaldun,[7][8] and in the writings of John Maynard Keynes.[7]
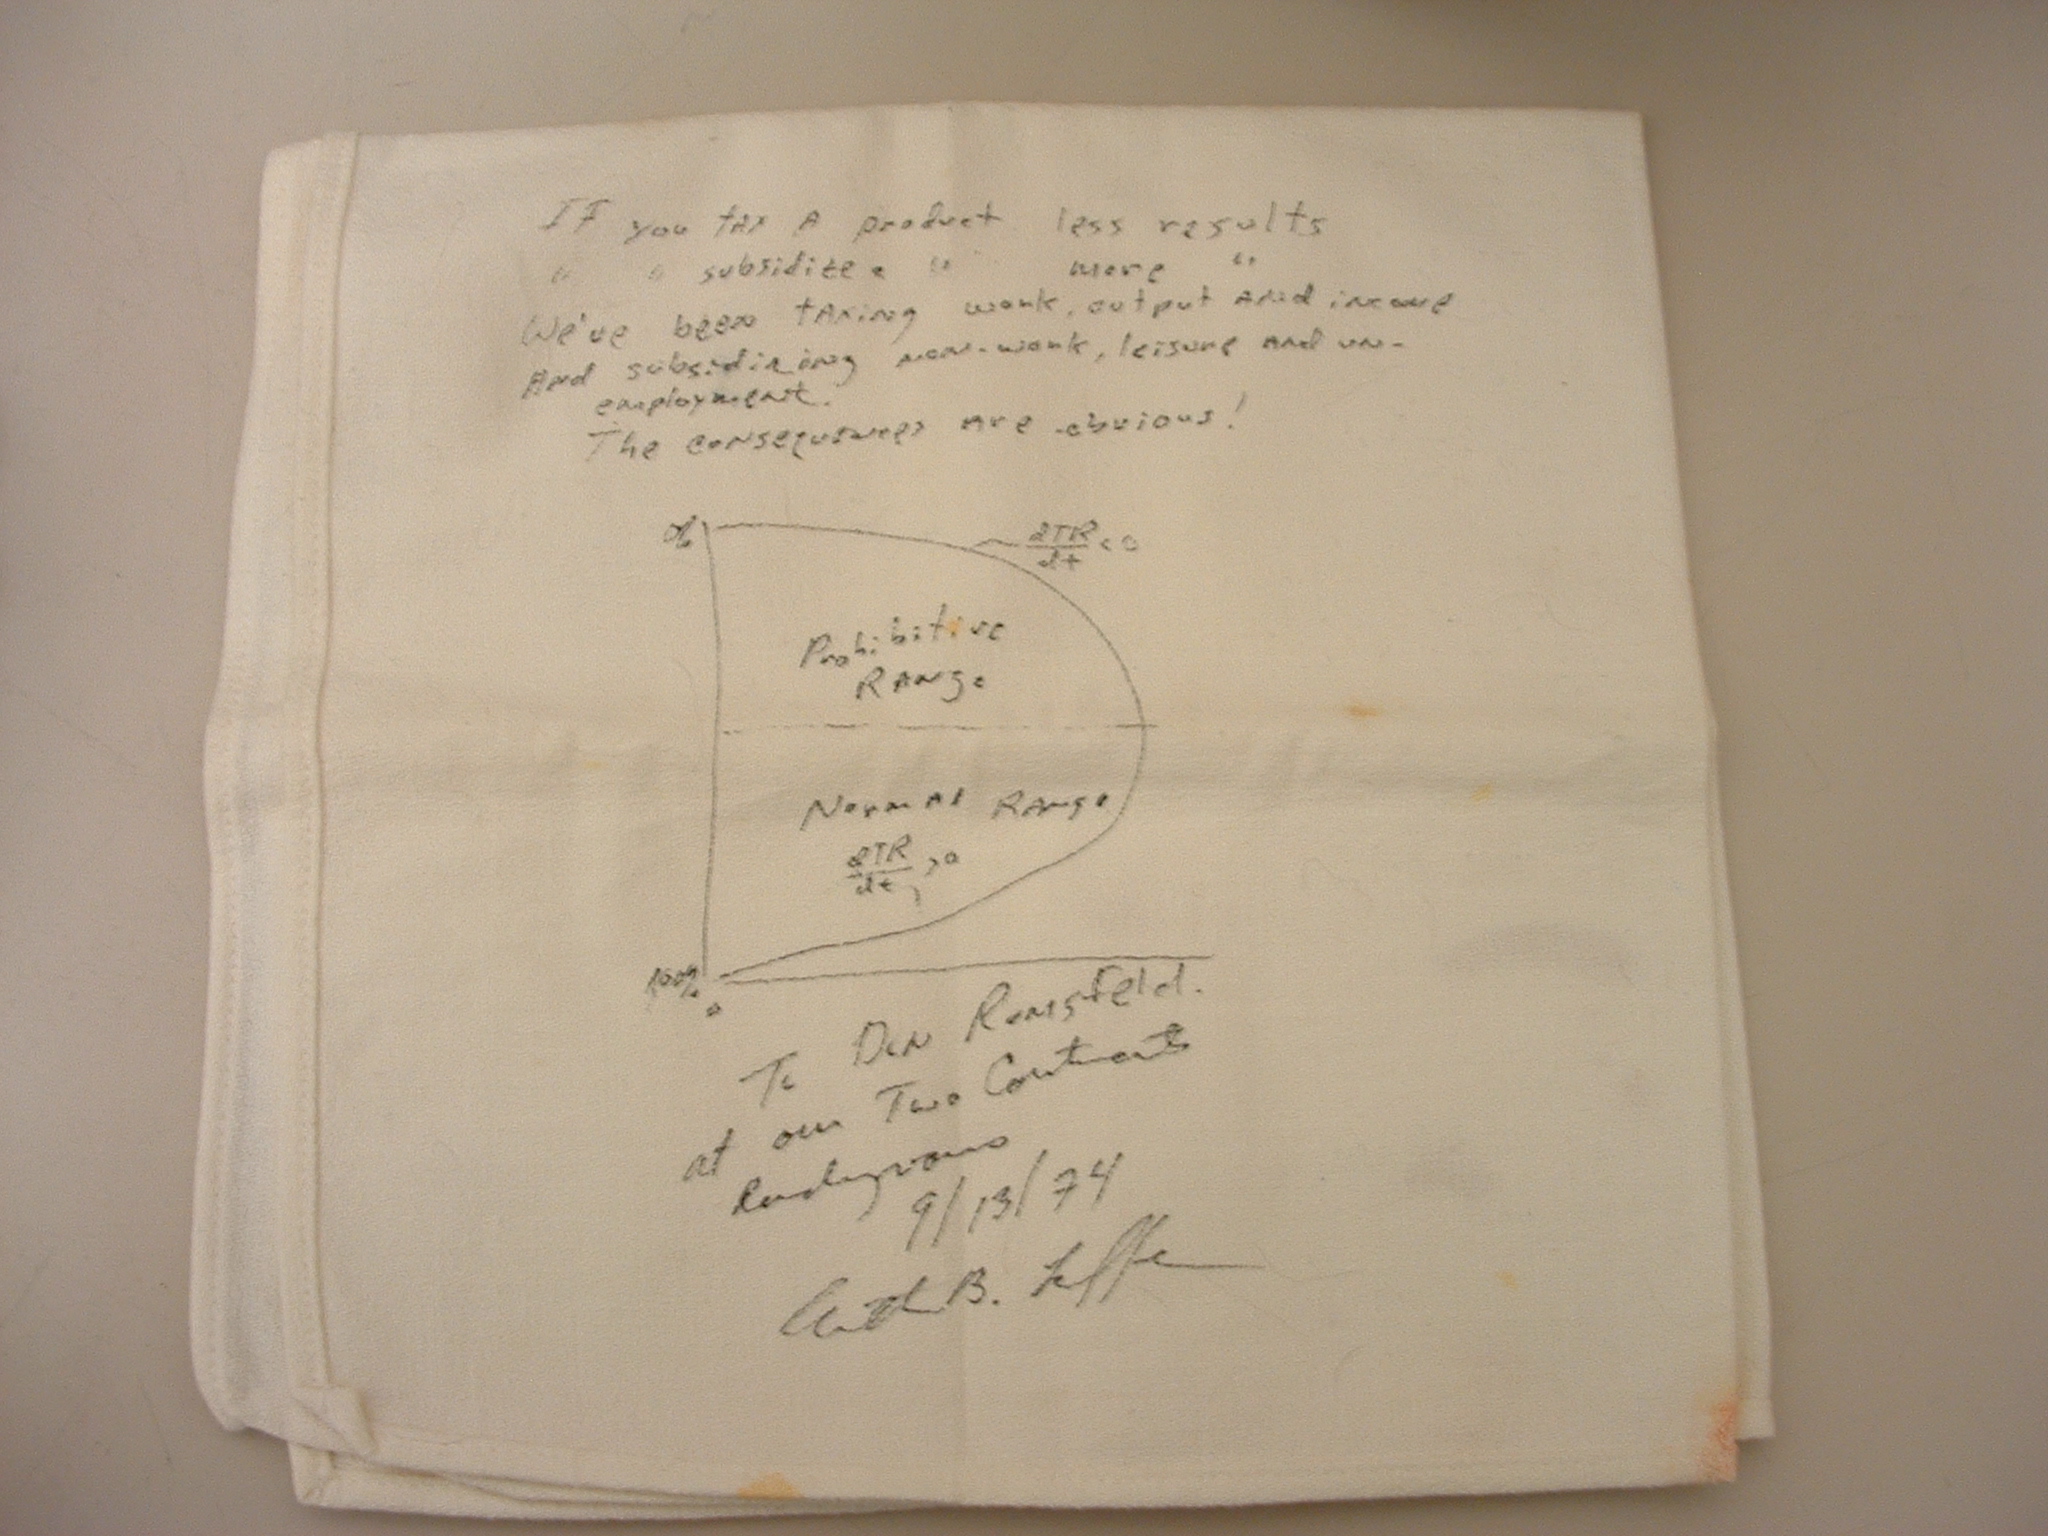
It was not until the 1970s that Laffer's name began to be associated with the idea. The term "Laffer curve" was reportedly coined by Jude Wanniski (a writer for The Wall Street Journal) after a 1974 dinner meeting at the Two Continents Restaurant in the Washington Hotel with Arthur Laffer, Wanniski, Dick Cheney, Donald Rumsfeld, and his deputy press secretary Grace-Marie Arnett.[7] In this meeting, Laffer, arguing against President Gerald Ford's tax increase, reportedly sketched the curve on a napkin to illustrate the concept.[9] Cheney did not accept the idea immediately, but it caught the imaginations of those present.[10] Laffer professes no recollection of this napkin, but writes: "I used the so-called Laffer Curve all the time in my classes and with anyone else who would listen to me".[7]
Precedents
There are historical precedents other than those cited directly by Laffer. For example, in 1924, Secretary of Treasury Andrew Mellon wrote: "It seems difficult for some to understand that high rates of taxation do not necessarily mean large revenue to the government, and that more revenue may often be obtained by lower rates". Exercising his understanding that "73% of nothing is nothing", he pushed for the reduction of the top income tax bracket from 73% to an eventual 24% (as well as tax breaks for lower brackets). Mellon was one of the wealthiest people in the United States, the third-highest income-tax payer in the mid-1920s, behind John D. Rockefeller and Henry Ford.[11] While he served as Secretary of the U.S. Treasury Department his wealth peaked at around US$300–US$400 million. Personal income-tax receipts rose from US$719 million in 1921 to over US$1 billion in 1929, an average increase of 4.2% per year over an 8-year period, which supporters attribute to the rate cut.[12] David Hume also expressed similar arguments in his essay Of Taxes in 1756, as did fellow Scottish economist Adam Smith, twenty years later.[13]
The Democratic party made a similar argument in the 1880s when high revenue from import tariffs raised during the Civil War (1861–1865) led to federal budget surpluses. The Republican party, which was then based in the protectionist industrial Northeast, argued that cutting rates would lower revenues. But the Democratic party, then rooted in the agricultural South, argued tariff reductions would increase revenues by increasing the number of taxable imports.
In 2012, economists surveyed by the University of Chicago rejected the viewpoint that the Laffer Curve's postulation of increased tax revenue through a rate cut applies to federal US income taxes of the time in the medium term. When asked whether a “cut in federal income tax rates in the US right now would raise taxable income enough so that the annual total tax revenue would be higher within five years than without the tax cut”, none of the economists surveyed agreed and 71% disagreed.[14]
Empirical data
One of the conceptual uses of the Laffer curve is to determine the rate of taxation that will raise the maximum revenue (in other words, "optimizing" revenue collection). The revenue maximizing tax rate should not be confused with the optimal tax rate, which economists use to describe tax rates in a tax system that raises a given amount of revenue with the least distortions to the economy.[15]
Tax rate at which revenue is maximized
The New Palgrave Dictionary of Economics reports that a comparison of academic studies yields a range of revenue maximizing rates that centers around 70%.[4] In the early 1980s, Edgar L. Feige and Robert T. McGee developed a macroeconomic model from which they derived a Laffer Curve. According to the model, the shape and position of the Laffer Curve depend upon the strength of supply side effects, the progressivity of the tax system and the size of the unobserved economy.[17][18][19] Economist Paul Pecorino presented a model in 1995 that predicted the peak of the Laffer curve occurred at tax rates around 65%.[20] A draft paper by Y. Hsing looking at the United States economy between 1959 and 1991 placed the revenue-maximizing average federal tax rate between 32.67% and 35.21%.[21] A 1981 article published in the Journal of Political Economy presented a model integrating empirical data that indicated that the point of maximum tax revenue in Sweden in the 1970s would have been 70%.[22] A 2011 paper by Trabandt and Uhlig published in the Journal of Monetary Economics estimated a 70% revenue maximizing rate, and predicted that the US and most European economies were on the left of the Laffer curve (in other words, that raising taxes would raise further revenue).[16]
Congressional Budget Office analysis
In 2005, the United States Congressional Budget Office (CBO) released a paper called "Analyzing the Economic and Budgetary Effects of a 10 Percent Cut in Income Tax Rates'. This paper considered the impact of a stylized reduction of 10% in the then existing marginal rate of federal income tax in the US (for example, if those facing a 25% marginal federal income tax rate had it lowered to 22.5%). Unlike earlier research, the CBO paper estimates the budgetary impact of possible macroeconomic effects of tax policies, that is, it attempts to account for how reductions in individual income tax rates might affect the overall future growth of the economy, and therefore influence future government tax revenues; and ultimately, impact deficits or surpluses. In the paper's most generous estimated growth scenario, only 28% of the projected lost revenue from the lower tax rate would be recouped over a 10-year period after a 10% across-the-board reduction in all individual income tax rates. In other words, deficits would increase by nearly the same amount as the tax cut in the first five years, with limited feedback revenue thereafter. Through increased budget deficits, the tax cuts primarily benefiting the wealthy will be paid for—plus interest—by taxes borne relatively evenly by all taxpayers.[23] The paper points out that these projected shortfalls in revenue would have to be made up by federal borrowing: the paper estimates that the federal government would pay an extra US$200 billion in interest over the decade covered by the paper's analysis.[24][25]
United Kingdom
Following the reduction of the top rate of income tax in the UK from 50% to 45% in 2013, HMRC estimated the cost of the tax reduction to be about £100 million (out of an income for this group of around £90 billion), but with large uncertainty on both sides. Robert Chote, the chairman of the UK Office for Budget Responsibility commented that Britain was "strolling across the summit of the Laffer curve", implying that UK tax rates were close to the optimum rate.[26][27]
Other
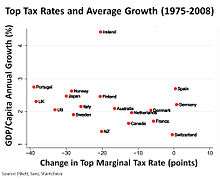
Laffer has presented the examples of Russia and the Baltic states, which instituted a flat tax with rates lower than 35% around the same time that their economies started growing. He has similarly referred to the economic outcome of the Kemp-Roth tax cuts, the Kennedy tax cuts, the 1920s tax cuts, and the changes in US capital gains tax structure in 1997.[7] Some have also cited Hauser's Law, which postulates that US federal revenues, as a percentage of GDP, have remained stable at approximately 19.5% over the period 1950 to 2007 despite changes in marginal tax rates over the same period.[28] Others however, have called Hauser's Law "misleading" and contend that tax changes have had large effects on tax revenues.[29]
More recently, based on Laffer curve arguments, Kansas Governor Sam Brownback greatly reduced state tax rates in 2012.[30][31] The state, which had previously had a budget surplus, experienced a budget deficit of about $200 million in 2012. Drastic cuts to state funding for education and infrastructure have been implemented because of the budget deficits.[32]
In US political discourse
Use in supply-side economics
Supply-side economics is a school of macroeconomic thought that argues that overall economic well-being is maximized by lowering the barriers to producing goods and services (the "Supply Side" of the economy). By lowering such barriers, consumers are thought to benefit from a greater supply of goods and services at lower prices. Typical supply-side policy would advocate generally lower income tax and capital gains tax rates (to increase the supply of labor and capital), smaller government and a lower regulatory burden on enterprises (to lower costs). Although tax policy is often mentioned in relation to supply-side economics, supply-side economists are concerned with all impediments to the supply of goods and services and not just taxation.[34]
In their economics textbook Principles of Economics (7th edition), economists Karl E. Case of Wellesley College and Ray Fair of Yale University stated “The Laffer curve shows the relationship between tax rates and tax revenues. Supply-side economists use it to argue that it is possible to generate higher revenues by cutting tax rates, but evidence does not appear to support this. [35][36] The lower tax rates by the Reagan administration decreased tax revenues significantly and contributed to the massive increase in federal debt during the 1980s.”.[37]
Reaganomics

The Laffer curve and supply-side economics inspired Reaganomics and the Kemp-Roth Tax Cut of 1981. Supply-side advocates of tax cuts claimed that lower tax rates would generate more tax revenue because the United States government's marginal income tax rates prior to the legislation were on the right-hand side of the curve. This assertion was derided by George H. W. Bush as "voodoo economics" while running against Reagan for the Presidential nomination in 1980.[38] During the Reagan presidency, the top marginal rate of tax in the United States fell from 70% to 31%.
David Stockman, Ronald Reagan's budget director during his first administration and one of the early proponents of supply-side economics, was concerned that the administration did not pay enough attention to cutting government spending. He maintained that the Laffer curve was not to be taken literally—at least not in the economic environment of the 1980s United States. In The Triumph of Politics, he writes: "[T]he whole California gang had taken [the Laffer curve] literally (and primitively). The way they talked, they seemed to expect that once the supply-side tax cut was in effect, additional revenue would start to fall, manna-like, from the heavens. Since January, I had been explaining that there is no literal Laffer curve."[39] Stockman also said that "Laffer wasn't wrong, he just didn't go far enough" (in paying attention to government spending).[40]
Some have criticized elements of Reaganomics on the basis of equity. For example, economist John Kenneth Galbraith believed that the Reagan administration actively used the Laffer curve "to lower taxes on the affluent".[41] Some critics point out that tax revenues almost always rise every year, and during Reagan's two terms increases in tax revenue were more shallow than increases during presidencies where top marginal tax rates were higher.[42] Critics also point out that since the Reagan tax cuts, income has not significantly increased for the rest of the population. This assertion is supported by studies that show the income of the top 1% nearly doubling during the Reagan years, while income for other income levels increased only marginally; income actually decreased for the bottom quintile.[43]
During Reagan's presidency, the national debt grew from $997 billion to $2.85 trillion.[44] This led to the U.S. moving from the world's largest international creditor to the world's largest debtor nation.[45]
Bush tax cuts
The Congressional Budget Office has estimated that extending the Bush tax cuts of 2001–2003 beyond their 2010 expiration would increase deficits by $1.8 trillion over the following decade.[46] Economist Paul Krugman contended that supply-side adherents did not fully believe that the United States income tax rate was on the "backwards-sloping" side of the curve and yet they still advocated lowering taxes to encourage investment of personal savings.[47]
Theoretical issues

Justifications
Laffer explains the model in terms of two interacting effects of taxation: an "arithmetic effect" and an "economic effect".[7] The "arithmetic effect" assumes that tax revenue raised is the tax rate multiplied by the revenue available for taxation (or tax base). Thus revenue R is equal to t×B where t is the tax rate and B is the taxable base (R=t×B). At a 0% tax rate, the model states that no tax revenue is raised. The "economic effect" assumes that the tax rate will affect the tax base itself. At the extreme of a 100% tax rate, the government collects zero revenue because taxpayers change their behavior in response to the tax rate: either they lose their incentive to work, or they find a way to avoid paying taxes. Thus, the "economic effect" of a 100% tax rate is to decrease the tax base to zero. If this is the case, then somewhere between 0% and 100% lies a tax rate that will maximize revenue.
Graphical representations of the curve sometimes appear to put the rate at around 50%, if the tax base reacts to the tax rate linearly, but the revenue-maximizing rate could theoretically be any percentage greater than 0% and less than 100%. Similarly, the curve is often presented as a parabolic shape, but there is no reason that this is necessarily the case. The effect of changes in tax can be cased in terms of elasticities, where the revenue-maximizing elasticity of the tax base with respect to the tax is equal to 1. This is done by differentiating R with respect to t and grouping terms to reveal that the rate of change of R with respect to t is equal to the sum of elasticity of the tax base plus one all multiplied by the tax base. Thus as elasticity surpasses one absolute value, revenues begin to fall. The problem is similar to that of the monopolist who must never increase prices beyond the point at which the elasticity of demand exceeds one in absolute value.
Wanniski noted that all economic activity would be unlikely to cease at 100% taxation, but it would switch from the exchange of money to barter. He also noted that there can be special circumstances in which economic activity can continue for a period at a near 100% taxation rate (for example, in war economy).[13]
Various efforts have been made to quantify the relationship between tax revenue and tax rates (for example, in the United States by the Congressional Budget Office).[24] While the interaction between tax rates and tax revenue is generally accepted, the precise nature of this interaction is debated. In practice, the shape of a hypothetical Laffer curve for a given economy can only be estimated. The relationship between tax rate and tax revenue is likely to vary from one economy to another and depends on the elasticity of supply for labor, as well as various other factors. Even in the same economy, the characteristics of the curve could vary over time. Complexities such as progressive taxes and possible differences in the incentive to work for different income groups complicate the task of estimation. The structure of the curve may also be changed by policy decisions. For example, if tax loopholes and tax shelters are made more readily available by legislation, the point at which revenue begins to decrease with increased taxation is likely to become lower.
Laffer presented the curve as a pedagogical device to show that in some circumstances, a reduction in tax rates will actually increase government revenue and not need to be offset by decreased government spending or increased borrowing. For a reduction in tax rates to increase revenue, the current tax rate would need to be higher than the revenue maximizing rate. In 2007, Laffer said that the curve should not be the sole basis for raising or lowering taxes.[48]
Criticisms
Laffer assumes that the government's revenue is a continuous function of the tax rate. However, in some theoretical models, the Laffer curve can be discontinuous, leading to an inability to devise a revenue-maximizing tax rate solution.[49] Additionally, the Laffer curve depends on the assumption that tax revenue is used to provide a public good that is separable in utility and separate from labor supply, which may not be true in practice.[50]
The Laffer curve as presented is simplistic in that it assumes a single tax rate and a single labor supply. Actual systems of public finance are more complex, and there is serious doubt about the relevance of considering a single marginal tax rate.[4] In addition, revenue may well be a multivalued function of tax rate; for instance, an increase in tax rate to a certain percentage may not result in the same revenue as a decrease in tax rate to the same percentage (a kind of hysteresis). Furthermore, the Laffer curve does not take explicitly into account the nature of the tax avoidance taking place. It is possible that if all producers are endowed with two survival factors in the market (ability to produce efficiently and ability to avoid tax), then the revenues raised under tax avoidance can be greater than without avoidance, and thus the Laffer curve maximum is found to be farther right than thought. The reason for this result is that if producers with low productive abilities (high production costs) tend to have strong avoidance abilities as well, a uniform tax on producers actually becomes a tax that discriminates on the ability to pay.[51]
See also
Notes
- ↑ Irvin B. Tucker (2010), Survey of Economics, Cengage Learning, p. 341, ISBN 978-1-4390-4054-6
- ↑ L.H. Meyer (6 December 2012). The Supply-Side Effects of Economic Policy. Springer Science & Business Media. p. 83. ISBN 978-94-009-8174-4.
- ↑ Gahvari, Firouz (1989). "The nature of government expenditures and the shape of the laffer curve". Journal of Public Economics. 40 (2): 251–260. doi:10.1016/0047-2727(89)90006-6. ISSN 0047-2727.
- 1 2 3 Fullerton, Don (2008). "Laffer curve". In Durlauf, Steven N.; Blume, Lawrence E. The New Palgrave Dictionary of Economics (2nd ed.). p. 839. doi:10.1057/9780230226203.0922. ISBN 978-0-333-78676-5.
- ↑ "Laffer Curve | IGM Forum". www.igmchicago.org. Retrieved 2017-10-14.
- ↑ "To Donald Rumsfeld". Polyconomics.com. Archived from the original on 2011-05-03. Retrieved 2012-12-13.
- 1 2 3 4 5 6 7 8 9 Laffer, Arthur. "The Laffer Curve: Past, Present, and Future". The Heritage Foundation. Retrieved 2016-05-02.
- ↑ Brederode, Robert F. van (2009). Systems of general sales taxation : theory, policy and practice. Austin [Tex.]: Wolters Kluwer Law & Business. p. 117. ISBN 9041128328.
- ↑ Archived July 22, 2011, at the Wayback Machine.
- ↑ Gellman, Barton, 258. Angler: The Cheney Vice Presidency, Penguin Press, New York 2008.
- ↑ Cannadine, David. Mellon: An American Life. New York: A.A. Knopf, 2006. pp. 48–49, 165, 349. ISBN 0-679-45032-7.
- ↑ Folsom Jr., Burton W., "The Myth of the Robber Barons", p. 103. Young America's Foundation, 2007.
- 1 2 Wanniski, Jude (1978). "Taxes, Revenues and the 'Laffer Curve'" (PDF). The Public Interest. Archived from the original (PDF) on 2011-05-08. Retrieved 2009-11-21.
- ↑ "Poll Results". IGM Forum.
- ↑ Giertz, Seth A (2008-05-30). "How Does the Elasticity of Taxable Income Affect Economic Efficiency and Tax Revenues and what Implications Does this have for Tax Policy Moving Forward?" (PDF). American Enterprise Institute for Public Policy Research: 36–42. Archived from the original (PDF) on 26 March 2011. Retrieved 2011-05-08.
- 1 2 Trabandt, Mathias; Uhlig, Harald (2011). "The Laffer Curve Revisited". Journal of Monetary Economics. 58 (4): 305–27. doi:10.1016/j.jmoneco.2011.07.003.
- ↑ Feige, Edgar L.; McGee, Robert (1982). "Supply Side Economics and the Unobserved Economy: The Dutch Laffer Curve". [Economisch Statistische Berichten]. 67 (November).
- ↑ Feige, Edgar L.; McGee, Robert (1982). "The Unobserved Economy and the UK Laffer Curve". 3 (1). The Journal of Economic Affairs: 36–42.
- ↑ Feige, Edgar L.; McGee, Robert (1983). "Sweden's Laffer Curve:Taxation and the Unobserved Economy". The Scandinavian Journal of Economics. 85 (4): 499–519.
- ↑ Pecorino, Paul (1995). "Tax rates and tax revenues in a model of growth through human capital accumulation". Journal of Monetary Economics. 36 (3): 527. doi:10.1016/0304-3932(95)01224-9.
- ↑ Hsing, Y (1996). "Estimating the Laffer Curve and Policy Implications". Journal of Socio-Economics. 25 (3): 395. doi:10.1016/S1053-5357(96)90013-X.
- ↑ Stuart, C. E. (1981). "Swedish Tax Rates, Labor Supply, and Tax Revenues". Journal of Political Economy. 89 (5): 1020–38. doi:10.1086/261018. JSTOR 1830818.
- ↑ "Analyzing the Economic and Budgetary Effects of a 10 Percent Cut in Income Tax Rates" (PDF). 1 December 2005.
- 1 2 "CBO. (December 1, 2005). Analyzing the Economic and Budgetary Effects of a 10 Percent Cut in Income Tax Rates" (PDF). Retrieved 2007-12-11.
- ↑ https://www.aeaweb.org/articles?id=10.1257/aer.100.3.763
- ↑ Chu, Ben (8 April 2014). "Only time will tell if income tax changes prove worthwhile". The Independent. Retrieved 10 September 2017.
- ↑ Maugham, Jolyon (1 March 2016). "How George Osborne's policies have lost the country £2.4bn in tax". The Independent. Retrieved 10 September 2017.
- ↑ Ranson, David, "You Can't Soak the Rich," Archived 2010-01-08 at the Wayback Machine., The Wall Street Journal, May 20, 2008; p. A23
- ↑ Kimmel, Mike (2010-11-30). "Hauser's Law is Extremely Misleading". Angry Bear – Financial and Economic Commentary. Retrieved 30 June 2011.
- ↑ Shields, Mike (August 14, 2012). "The brain behind the Brownback tax cuts". Kansas Health Institute. Kansas Health Institute. Retrieved 17 August 2016.
- ↑ Topeka Capital Journal, 2013
- ↑ Kansas City Star, 2015
- ↑ http://www.economicdynamics.org/meetpapers/2012/paper_78.pdf
- ↑ "Supply-Side Economics and Austrian Economics". April 1987.
- ↑ Feige, Edgar; McGee, Robert (1982). "Supply Side Economics and the Unobserved Economy: The Dutch Laffer Curve". [Economisch Statistische Berichten]. 67 (November).
- ↑ Feige, Edgar L.; McGee, Robert (1983). "Sweden's Laffer Curve:Taxation and the Unobserved Economy". The Scandinavian Journal of Economics. 85 (4): 499–519.
- ↑ Case and Fair, Principles of Economics, 7th Edition, p. 662
- ↑ "Reagonomics or 'voodoo economics'?". BBC News. 2004-06-05. Retrieved 2012-01-04.
- ↑ Stockman, David (2013-03-26). The Triumph of Politics: Why the Reagan Revolution Failed. PublicAffairs. p. 289. ISBN 1-61039-277-9.
- ↑ "The Education of David Stockman". The Atlantic. December 1981.
- ↑ Galbraith, J. K. (Sinclair-Stevenson 1994). The World Economy Since The Wars. A Personal View, p. 232.
- ↑ "Tax cuts increase tax collections".
- ↑ "Cumulative Growth In Average After-Tax Income, By Income Group; graph, p. 19" (PDF). Congressional Budget Office. October 2011.
- ↑ "Historical Debt Outstanding". U.S. Treasury Department. Retrieved September 8, 2010.
- ↑ "Reagan Policies Gave Green Light to Red Ink". The Washington Post. 2004-06-09. Retrieved May 25, 2007.
- ↑ "An Analysis of the President's Budgetary Proposals for Fiscal Year 2008" (PDF). 21 March 2007.
- ↑ Peddling Prosperity by Paul Krugman, p. 95
- ↑ Tax Cuts Don't Boost Revenues, Time Magazine, December 6, 2007
- ↑ Malcomson, J (1986). "Some analytics of the laffer curve". Journal of Public Economics. 29 (3): 263. doi:10.1016/0047-2727(86)90029-0.
- ↑ Gahvari, F (1989). "The nature of government expenditures and the shape of the laffer curve". Journal of Public Economics. 40 (2): 251. doi:10.1016/0047-2727(89)90006-6.
- ↑ Palda, Filip (1998). "Evasive Ability and the Efficiency Cost of the Underground Economy". Canadian Journal of Economics. 31 (5): 1118–38. JSTOR 136462.
External links
![]()