Supply-side economics
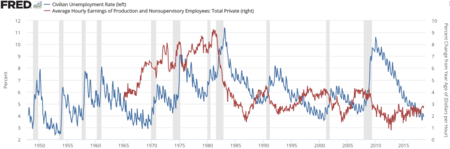
Supply-side economics is a macroeconomic theory arguing that economic growth can be most effectively created by lowering taxes and decreasing regulation.[1][2] According to supply-side economics, consumers will then benefit from a greater supply of goods and services at lower prices and employment will increase.[3] It was started by economist Robert Mundell during the Ronald Reagan administration.
The Laffer curve is one of the main theoretical constructs of supply-side economics, the idea that lower tax rates when tax level is too high will actually boost government revenue because of higher economic growth.[4]
The term "supply-side economics" was thought for some time to have been coined by journalist Jude Wanniski in 1975, but according to Robert D. Atkinson the term "supply side" was first used in 1976 by Herbert Stein (a former economic adviser to President Richard Nixon) and only later that year was this term repeated by Jude Wanniski.[5] Its use connotes the ideas of economists Robert Mundell and Arthur Laffer. It is commonly confused with trickle down economics.
Historical origins

Supply-side economics developed in response to the stagflation of the 1970s.[6] It drew on a range of non-Keynesian economic thought, including the Chicago School and New Classical School.[7][8] Bruce Bartlett, an advocate of supply-side economics, traced the school of thought's intellectual descent from the philosophers Ibn Khaldun and David Hume, satirist Jonathan Swift, political economist Adam Smith and United States Secretary of the Treasury Alexander Hamilton.[9]
However, what most separates supply-side economics as a modern phenomenon is its argument in favor of low tax rates primarily for collective and notably working-class reasons, rather than traditional ideological ones. Classical liberals opposed taxes because they opposed government, taxation being the latter's most obvious form. Their claim was that each man had a right to himself and his property and therefore taxation was immoral and of questionable legal grounding.[10] On the other hand, supply-side economists argued that the alleged collective benefit (i.e. increased economic output and efficiency) provided the main impetus for tax cuts.
As in classical economics, supply-side economics proposed that production or supply is the key to economic prosperity and that consumption or demand is merely a secondary consequence. Early on, this idea had been summarized in Say's Law of economics, which states: "A product is no sooner created, than it, from that instant, affords a market for other products to the full extent of its own value".
John Maynard Keynes, the founder of Keynesianism, summarized Say's law as "supply creates its own demand". He turned Say's law on its head in the 1930s by declaring that demand creates its own supply.[11]
In 1978, Jude Wanniski published The Way the World Works in which he laid out the central thesis of supply-side economics and detailed the failure of high tax rate progressive income tax systems and United States monetary policy under Richard Nixon and Jimmy Carter in the 1970s. Wanniski advocated lower tax rates and a return to some kind of gold standard, similar to the 1944–1971 Bretton Woods System that Nixon abandoned.
Laffer curve
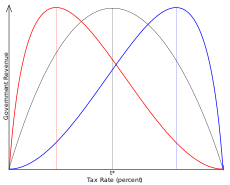
The Laffer curve embodies a postulate of supply-side economics: that tax rates and tax revenues are distinct, with government tax revenues the same at a 100% tax rate as they are at a 0% tax rate and maximum revenue somewhere in between these two values. Supply-siders argued that in a high tax rate environment lowering tax rates would result in either increased revenues or smaller revenue losses than one would expect relying on only static estimates of the previous tax base.[12][13]
This led supply-siders to advocate large reductions in marginal income and capital gains tax rates to encourage greater investment, which would produce more supply. Jude Wanniski and many others advocate a zero capital gains rate.[14][15] The increased aggregate supply would result in increased aggregate demand, hence the term "supply-side economics".
Fiscal policy theory
Supply-side economics holds that increased taxation steadily reduces economic activity within a nation and discourages investment. Taxes act as a type of trade barrier or tariff that causes economic participants to revert to less efficient means of satisfying their needs. As such, higher taxation leads to lower levels of specialization and lower economic efficiency. The idea is said to be illustrated by the Laffer curve.[17]
Supply-side economists have less to say on the effects of deficits and sometimes cite Robert Barro’s work that states that rational economic actors will buy bonds in sufficient quantities to reduce long-term interest rates.[18]
Effect on tax revenues
Many early proponents argued that the size of the economic growth would be significant enough that the increased government revenue from a faster-growing economy would be sufficient to compensate completely for the short-term costs of a tax cut and that tax cuts could in fact cause overall revenue to increase.[13] Some hold this was borne out during the 1980s when advocates of supply-side economics claim tax cuts ultimately led to an overall increase in government revenue due to stronger economic growth. However, some economists dispute this assertion pointing to the fact that revenue as a percentage of GDP declined during Reagan's term in office.[19] The fact that tax receipts as a percentage of GDP fell following the Economic Recovery Tax Act of 1981 shows a decrease in tax burden as share of GDP and a corresponding increase in the deficit because spending did not fall relative to GDP. Total tax revenue from income tax receipts increased during Reagan's two terms, with the exception of 1982–1983.[20] The Treasury Department also studied the Reagan tax cuts and concluded they significantly reduced tax revenues relative to a baseline without them.[21]
Some contemporary economists do not consider supply-side economics a tenable economic theory, with Alan Blinder calling it an "ill-fated" and perhaps "silly" school on the pages of a 2006 textbook.[22] Greg Mankiw, former chairman of President President George W. Bush's Council of Economic Advisers, offered similarly sharp criticism of the school in the early editions of his introductory economics textbook.[23] Mankiw wrote in June 2017:
Tax cuts rarely pay for themselves. My reading of the academic literature leads me to believe that about one-third of the cost of a typical tax cut is recouped with faster economic growth.[24]
In a 1992 article for the Harvard International Review, James Tobin wrote:
[The] idea that tax cuts would actually increase revenues turned out to deserve the ridicule [...][25]
The extreme promises of supply-side economics did not materialize. President Reagan argued that because of the effect depicted in the Laffer curve, the government could maintain expenditures, cut tax rates, and balance the budget. This was not the case. Government revenues fell sharply from levels that would have been realized without the tax cuts.
—Karl Case and Ray Fair, Principles of Economics (2007), p. 695[26]
Supply side proponents Trabandt and Uhlig argue that "static scoring overestimates the revenue loss for labor and capital tax cuts" and that "dynamic scoring" is a better predictor for the effects of tax cuts.[27] To address these criticisms, in 2003 the Congressional Budget Office conducted a dynamic scoring analysis of tax cuts advocated by supply advocates. Two of the nine models used in the study predicted a large improvement in the deficit over the next ten years resulting from tax cuts and the other seven models did not.[28]
Effect on income inequality
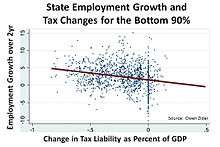
Income inequality can be measured both pre- and after-tax. There is no consensus on the effects of income tax cuts on pre-tax income inequality, although one 2013 study indicated a strong correlation between how much top marginal tax rates were cut and greater pre-tax inequality across many countries.[29] However, an important side effect of income tax cuts in the U.S. is an increase in after-tax income inequality (other things equal), meaning the top earners receive a greater share of the after-tax income.[30] This is due to several tax policy factors:
- Federal income taxes are progressive, meaning that higher income tax rates are levied on higher levels of income. For example, married couples filing jointly in 2017 pay a 25% tax rate on their income between $75,900 and $153,100, but 39.6% for income above $470,700.[31] This progressive policy meant the top 1% of income earners paid roughly 45% of the income taxes despite earning 17% of the pre-tax income in 2014.[32] So cutting income tax rates means relatively less is paid by higher-income households, leaving them with a greater share of the after-tax income.[30]
- Approximately 40-50% of American households do not pay federal income taxes, either because they do not earn sufficient income to pay federal income taxes or qualify for exclusions (e.g. many elderly households do not pay income taxes on their Social Security benefits). The percent of households paying income taxes by age tends to rise into the prime working years (peaking at about 80% around age 50) and falls upon retirement.[33]
- Income taxes are distinct from payroll taxes, which all workers pay. In other words, a paycheck will have withdrawal amounts for payroll taxes (e.g. Social Security and Medicare) along with withdrawals for federal income taxes; some of the latter may be refunded when the annual tax return is filed. Payroll taxes are flat taxes (the same rate is levied) for salary and wage income up to a specific threshold ($127,400 in 2017).[34]
For example, the Tax Policy Center evaluated a detailed supply-side tax cut proposal from presidential candidate Jeb Bush in 2015. Their conclusion was that the proposal would both increase deficits dramatically and worsen after-tax income inequality.[35]
The combination of market forces driving pre-tax inequality combined with a reduction in marginal tax rates after 1979 resulted in the share of after-tax income received by the top 1% increasing from 7.4% to a peak of 16.7% in 2007 before falling to 12.4% in 2013. The tax increases effective in 2013 due to the expiration of the Bush tax cuts for income over $400,000 ($450,000 for couples filing jointly) along with other tax increases on high incomes related to the Patient Protection and Affordable Care Act (Obamacare) contributed to the decline in after-tax inequality, although they were not sufficient to offset the rise in inequality since 1979.[30]
United States monetary and fiscal experience
Supply-side economists seek a cause and effect relationship between lowering marginal tax rates and economic expansion. The supply-side history of economics since the early 1900s hinges on the following key turning points:
The 1920s
After World War I, the highest tax bracket, which was for those earning over $100,000 a year (worth at least $1 million a year now), was over 70 percent.[36] The revenue acts of 1921, 1924 and 1926 reduced this tax rate to less than 25 percent, yet tax revenues actually went up significantly.[37]
Gene Smiley at the Foundation for Economic Education explains: "The share of income taxes paid by the higher net income tax classes fell as tax rates were raised. With the reduction in rates in the twenties, higher-income taxpayers reduced their sheltering of income and the number of returns and share of income taxes paid by higher-income taxpayers rose".[38]
The 1960s
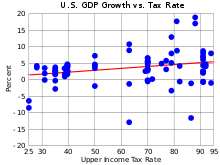
Democratic President John F. Kennedy advocated a drastic tax-rate cut in 1963 when the top income tax rate was 91%, arguing that "[t]ax rates are too high today and tax revenues too low, and the soundest way to raise revenues in the long run is to cut rates now".[39] The Revenue Act of 1964 emerged from Congress and was signed by Kennedy's successor Lyndon Johnson on February 26, 1964. The stated goals of the tax cuts were to raise personal incomes, increase consumption and increase capital investment.
Reaganomics
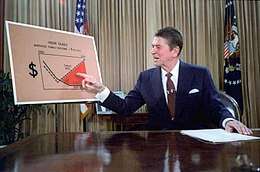
In the United States, commentators frequently equate supply-side economics with Reaganomics. The fiscal policies of Republican Ronald Reagan were largely based on supply-side economics.
Reagan made supply-side economics a household phrase and promised an across-the-board reduction in income tax rates and an even larger reduction in capital gains tax rates.[40]
During Reagan's 1980 presidential campaign, the key economic concern was double digit inflation, which Reagan described as "[t]oo many dollars chasing too few goods", but rather than the usual dose of tight money, recession and layoffs, with their consequent loss of production and wealth, he promised a gradual and painless way to fight inflation by "producing our way out of it".[41]
Switching from an earlier monetarist policy, Federal Reserve chair Paul Volcker began a policy of tighter monetary policies such as lower money supply growth to break the inflationary psychology and squeeze inflationary expectations out of the economic system.[42] Therefore, supply-side supporters argue that Reaganomics was only partially based on supply-side economics.
However, the Congress under Reagan passed a plan that would slash taxes by $749 billion over five years. Critics claim that the tax cuts increased budget deficits while Reagan supporters credit them with helping the 1980s economic expansion that eventually lowered the deficits and argued that the budget deficit would have decreased if not for massive increases in military spending.[43] As a result, Jason Hymowitz cited Reagan—along with Jack Kemp—as a great advocate for supply-side economics in politics and repeatedly praised his leadership.[44]
Critics of Reaganomics claim it failed to produce much of the exaggerated gains some supply-siders had promised. Paul Krugman later summarized the situation:
When Ronald Reagan was elected, the supply-siders got a chance to try out their ideas. Unfortunately, they failed.
Although he credited supply-side economics for being more successful than monetarism which he claimed "left the economy in ruins", he stated that supply-side economics produced results which fell "so far short of what it promised", describing the supply-side theory as "free lunches".[45]
Income tax revenues in constant dollars decreased by $2.77 billion in that year. FICA tax revenue increased because in 1983 FICA tax rates were increased from 6.7% to 7% and the ceiling was raised by $2,100. For the self-employed, the FICA tax rate went from 9.35% to 14%.[46] The FICA tax rate increased throughout Reagan's term and rose to 7.51% in 1988 and the ceiling was raised by 61% through Reagan's two terms. Those tax hikes on wage earners, along with inflation, were the source of revenue gains in the early 1980s.[47]
It has been contended by some supply-side critics that the argument to lower taxes to increase revenues was a smokescreen for "starving" the government of revenues in the hope that the tax cuts would lead to a corresponding drop in government spending, but this did not turn out to be the case. Paul Samuelson called this notion "the tape worm theory—the idea that the way to get rid of a tape worm is [to] stab your patient in the stomach".[48]
There is frequent confusion on the meaning of the term "supply-side economics" between the related ideas of the existence of the Laffer Curve and the belief that decreasing tax rates can increase tax revenues. Many supply-side economists doubt the latter claim while still supporting the general policy of tax cuts. Economist Gregory Mankiw used the term "fad economics" to describe the notion of tax rate cuts increasing revenue in the third edition of his Principles of Macroeconomics textbook in a section entitled "Charlatans and Cranks":
An example of fad economics occurred in 1980, when a small group of economists advised Presidential candidate, Ronald Reagan, that an across-the-board cut in income tax rates would raise tax revenue. They argued that if people could keep a higher fraction of their income, people would work harder to earn more income. Even though tax rates would be lower, income would rise by so much, they claimed, that tax revenues would rise. Almost all professional economists, including most of those who supported Reagan's proposal to cut taxes, viewed this outcome as far too optimistic. Lower tax rates might encourage people to work harder and this extra effort would offset the direct effects of lower tax rates to some extent, but there was no credible evidence that work effort would rise by enough to cause tax revenues to rise in the face of lower tax rates. [...] People on fad diets put their health at risk but rarely achieve the permanent weight loss they desire. Similarly, when politicians rely on the advice of charlatans and cranks, they rarely get the desirable results they anticipate. After Reagan's election, Congress passed the cut in tax rates that Reagan advocated, but the tax cut did not cause tax revenues to rise.[49][50]
When vying for the Republican Party presidential nomination for the 1980 election, George H. W. Bush derided Reagan's supply-side policies as "voodoo economics". However, to secure the Republican nomination in 1988 he later seemed to give lip service to these policies and is speculated by some to have lost his re-election bid in 1992 by allowing tax increases.
Clinton years
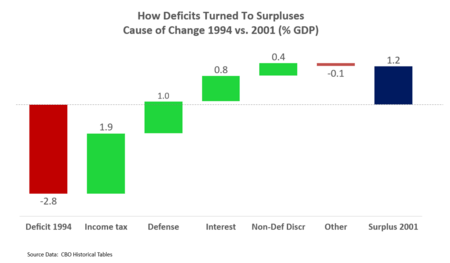
The Bill Clinton years represent a counter-example to supply side economics as tax increases coincided with record job creation. President Clinton presided over the budgets for fiscal years 1994–2001. From 1998 to 2001, the budget was in a surplus for the first time since 1969.
Clinton signed the Omnibus Budget Reconciliation Act of 1993 into law, which raised income taxes rates on incomes above $115,000, created additional higher tax brackets for corporate income over $335,000, removed the cap on Medicare taxes, raised fuel taxes and increased the portion of Social Security income subject to tax, among other tax increases. Income tax revenues nearly doubled in dollar terms, from $510B in 1993 (7.5% GDP) to $994B in 2001 (9.4% GDP).[51]
More jobs were created during the Clinton era than the Reagan era in both relative and absolute terms and the rate of GDP growth was higher.[52][53] Defense spending was held roughly flat in dollar terms at $282B in 1994 (3.9% GDP) and ending at $306B in 2001 (2.9% GDP). Likewise, non-defense discretionary spending fell from 3.6% of GDP in 1994 to 3.2% of GDP in 2001. The combination of increasing tax revenues and falling spending relative to GDP moved the budget from a 2.8% GDP deficit in 1994 to a 1.2% GDP surplus in 2001.[51]
Research since 2000

In 2003, Alan Murray, who at the time was Washington bureau chief for CNBC and a co-host of the television program Capital Report, declared the debate over supply-side economics to have ended "with a whimper" after extensive modeling performed by the Congressional Budget Office (CBO) predicted that the revenue generating effects of the specific tax cuts examined would be, in his words, "relatively small".[28] Murray also suggested that Dan Crippen may have lost his chance at reappointment as head of the CBO over the dynamic scoring issue.
Before President George W. Bush signed the 2003 tax cuts, the Economic Policy Institute (EPI) released a statement signed by ten Nobel prize laureates entitled "Economists' statement opposing the Bush tax cuts", which states:
Passing these tax cuts will worsen the long-term budget outlook, adding to the nation’s projected chronic deficits. This fiscal deterioration will reduce the capacity of the government to finance Social Security and Medicare benefits as well as investments in schools, health, infrastructure, and basic research. Moreover, the proposed tax cuts will generate further inequalities in after-tax income.[55]
Nobel laureate economist Milton Friedman agreed the tax cuts would reduce tax revenues and result in intolerable deficits, though he supported them as a means to restrain federal spending.[56] Friedman characterized the reduced government tax revenue as "cutting their allowance".
Bush tax cuts
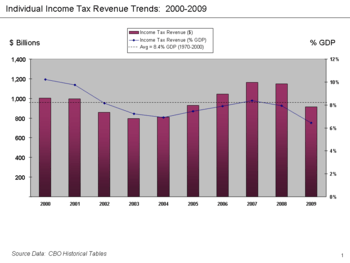
In 2001, President Bush signed the Economic Growth and Tax Relief Reconciliation Act of 2001. Rather than wait for the start of the new fiscal year, income tax rate reductions started on July 1, 2001. In addition, rebate checks were sent to everyone who filed a 2000 income tax return before October 1, the start of the new federal fiscal year.[57] Federal revenues in FY2001 were $1.946 trillion, $79 billion lower than in FY2000. More of the 2001 tax cut took effect at the start of FY2002, including cuts in the estate tax, retirement and educational savings.[58] Federal revenues in FY2002 were $1.777 trillion, $247 billion lower than in FY2000.
In 2003, President Bush signed the Jobs and Growth Tax Relief Reconciliation Act of 2003. Income tax rates were immediately reduced and rebate checks issued (without waiting for the new fiscal year).[59] Federal revenues in FY2003 were $1.665 trillion, $360 billion lower than in FY2000. Federal revenues in FY2004 were $1.707 trillion, $318 billion lower than in FY2000. Federal revenues in FY2005 were $1.888 trillion, $137 billion lower than in FY2000, but by 2006 revenue had completely recovered in inflation adjusted dollars with receipts at $2.037 trillion, $12 billion higher than 2000. The cumulative total of federal revenues less than in FY2000 for the fiscal years 2001–2005 was $1.142 trillion, with that amount expected to be recovered by 2011, with 2012 expected to produce an additional $400 billion in excess revenue over 2000.
Later analysis of the Bush tax cuts by the EPI claims that the Bush tax cuts have failed to promote growth since all macroeconomic growth indicators were well below average for the 2001–2005 business cycle. These critics argue the Bush tax cuts have done little more than deprive the government of revenue necessary keep a balanced budget.[60]
In 2007, the Bush administration pointed to the long period of sustained growth, both in GDP and in overall job numbers as well as increases in personal income and decreases in the government deficit.[61] However, the claims by the Bush administration were made prior to the onset of the 2008 financial crisis.
In terms of deficit impact, the non-partisan Congressional Budget Office (CBO) has consistently reported that the Bush tax cuts did not pay for themselves and represented a sizable decline in revenue for the Treasury relative to baselines without the cuts:
- The CBO estimated in June 2012 that the Bush tax cuts of 2001 (EGTRRA) and 2003 (JGTRRA) added approximately $1.5 trillion total to the debt over the 2002–2011 decade, excluding interest.[62]
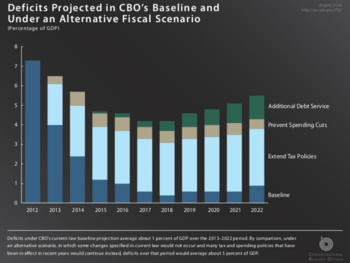
- The CBO estimated in January 2009 that the Bush tax cuts would add approximately $3.0 trillion to the debt over the 2010–2019 decade if fully extended at all income levels, including interest.[63]
- The CBO estimated in January 2009 that extending the Bush tax cuts at all income levels over the 2011–2019 period would increase the annual deficit by an average of 1.7% GDP, reaching 2.0% GDP in 2018 and 2019.[63]
- Prior to the American Taxpayer Relief Act of 2012 (ATRA), CBO estimated that allowing the expiration of just the upper-income portion of the Bush tax cuts would raise $823 billion in revenue over the next 10 years relative to current policy, saving $950 billion (0.5 percent of GDP) when accounting for debt service. ATRA permanently extended the Bush tax cuts for households earning less than $400,000.[64]
In 2006, the CBO released a study titled "A Dynamic Analysis of Permanent Extension of the President's Tax Relief".[65] This study found that under the best possible scenario making tax cuts permanent would increase the economy "over the long run" by 0.7%. Since the "long run" is not defined, some commentators[66] have suggested that 20 years should be used, making the annual best case GDP growth equal to 0.04%. When compared with the cost of the tax cuts, the best case growth scenario is still not sufficient to pay for the tax cuts. Previous official CBO estimates had identified the tax cuts as costing an amount equal to 1.4% of GDP. According to the study, if the best case growth scenario is applied, the tax cuts would still cost an amount equal to 1.27% of GDP.[66]
This study was criticized by many economists, including Harvard Economics Professor Greg Mankiw, who pointed out that the CBO used a very low value for the earnings-weighted compensated labor supply elasticity of 0.14.[67] In a paper published in the Journal of Public Economics, Mankiw and Matthew Weinzierl noted that the current economics research would place an appropriate value for labor supply elasticity at around 0.5.[68]
A 2008 working paper sponsored by the International Monetary Fund showed "that the Laffer curve can arise even with very small changes in labor supply effects", but that "labor supply changes do not cause the Laffer effect".[69] This is contrary to the supply-side explanation of the Laffer curve, in which the increases in tax revenue are held to be the result of an increase in labor supply.[70] Instead their proposed mechanism for the Laffer effect was that "tax rate cuts can increase revenues by improving tax compliance". The study examined in particular the case of Russia which has comparatively high rates of tax evasion. In that case, their tax compliance model did yield significant revenue increases:
To illustrate the potential effects of tax rate cuts on tax revenues consider the example of Russia. Russia introduced a flat 13 percent personal income tax rate, replacing the three tiered, 12, 20 and 30 percent previous rates (as detailed in Ivanova, Keen and Klemm, 2005). The tax exempt income was also increased, further decreasing the tax burden. Considering social tax reforms enacted at the same time, tax rates were cut substantially for most taxpayers. However, personal income tax (PIT) revenues have increased significantly: 46 percent in nominal and 26 percent real terms during the next year. Even more interesting PIT revenues have increased from 2.4 percent to 2.9 percent of GDP—a more than 20 percent increase relative to GDP. PIT revenues continued to increase to 3.3 percent during the next year, representing a further 14 percent gain relative to GDP.[69]
In 2003, a Congressional Budget Office study was conducted to forecast whether currently proposed tax cuts would increase revenues. The study used dynamic scoring models as supply side advocates had wanted and was conducted by a supply side advocate. The majority of the models applied predicted that the proposed tax cuts would not increase revenues.[28]
Criticism

Critics of supply-side policies emphasize the growing federal deficits, increased income inequality and lack of growth.[72] They argue that the Laffer curve only measures the rate of taxation, not tax incidence, which may be a stronger predictor of whether a tax code change is stimulative or dampening.[73] In addition, some studies have shown that in the past several decades, tax cuts in the U.S. seldom recoup revenue losses and have minimal impact on GDP growth.[74][75][76][77] David Harper claims that some economists dismiss the theory as offering "nothing particularly new or controversial as an updated view of classical economics".[78]
In a 2012 survey, when asked whether a "cut in federal income tax rates in the US right now would raise taxable income enough so that the annual total tax revenue would be higher within five years than without the tax cut", none of the economists surveyed by the University of Chicago agreed. 35% agreed with the statement "a cut in federal income tax rates in the US right now would lead to higher GDP within five years than without the tax cut".[79]
The Congressional Budget Office (CBO) has estimated that extending the Bush tax cuts beyond their 2010 expiration would increase the deficit by $1.8 trillion over 10 years.[80] The CBO also completed a study in 2005 analyzing a hypothetical 10% income tax cut and concluded that under various scenarios there would be minimal offsets to the loss of revenue. In other words, deficits would increase by nearly the same amount as the tax cut in the first five years with limited feedback revenue thereafter.[81]
Cutting marginal tax rates can also be perceived as primarily beneficial to the wealthy, which some see as politically rather than economically motivated:[82]
The specific set of foolish ideas that has laid claim to the name "supply side economics" is a crank doctrine that would have had little influence if it did not appeal to the prejudices of editors and wealthy men.
— Paul Krugman[83]
Mr. David Stockman has said that supply-side economics was merely a cover for the trickle-down approach to economic policy—what an older and less elegant generation called the horse-and-sparrow theory: If you feed the horse enough oats, some will pass through to the road for the sparrows.
— John Kenneth Galbraith[84]
See also
Notes and references
- ↑ Neva Goodwin; Jonathan M. Harris; Julie A. Nelson; Brian Roach; Mariano Torras (4 March 2015). Principles of Economics in Context. Routledge. p. 286. ISBN 978-1-317-46217-0.
supply-side-economics: the macroeconomic theory [...]
- ↑ Dwivedi (2010). Macroeconomics, 3E. Tata McGraw-Hill Education. p. 372. ISBN 978-0-07-009145-0.
The supply-side economics is the most recent macroeconomic thought.
- ↑ Wanniski, Jude (1978). The Way the World Works: How Economies Fail—and Succeed. New York: Basic Books. ISBN 0-465-09095-8.
- ↑ Laffer Curve
- ↑ Robert D. Atkinson (29 October 2007). Supply-Side Follies: Why Conservative Economics Fails, Liberal Economics Falters, and Innovation Economics Is the Answer. Rowman & Littlefield. p. 50. ISBN 978-0-7425-5107-7.
- ↑ Case, Karl E. & Fair, Ray C. (1999). Principles of Economics (5th ed.), p. 780. Prentice-Hall. ISBN 0-13-961905-4.
- ↑ Schmidt, I.; Rittaler, J. B. (28 February 1989). "A Critical Evaluation of the Chicago School of Antitrust Analysis". Springer Science & Business Media – via Google Books.
- ↑ Gandhi, Mr Ved P.; Ebrill, Mr Liam P.; Shome, Mr Parthasrathi; Anton, Mr Luis A. Manas; Modi, Jitendra R.; Sanchez-Ugarte, Mr Fernando J.; Mackenzie, Mr G. A. (15 June 1987). "Supply-Side Tax Policy: Its Relevance to Developing Countries". International Monetary Fund – via Google Books.
- ↑ Bartlett, Bruce. "Supply-Side Economics: "Voodoo Economics" or Lasting Contribution?" (PDF). Laffer Associates: Supply-Side Investment Research (November 11, 2003). Retrieved 2008-11-17.
- ↑ Gray, pp. 26–7 Liberalism. Minneapolis: University of Minnesota Press, 1995. ISBN 0-8166-2801-7
- ↑ Malabre, Jr., Alfred L. (1994). Lost Prophets: An Insider's History of the Modern Economists, p. 182. Harvard Business School Press. ISBN 0-87584-441-3.
- ↑ Laffer, Arthur (2004-06-01). "The Laffer Curve, Past, Present and Future". The Heritage Foundation. Retrieved 2007-12-11.
- 1 2 Bartlett, Bruce (2007-04-06). "How Supply-Side Economics Trickled Down". New York Times.
- ↑ Wanniski, Jude "Taxing Capital Gains" Archived 2014-05-02 at the Wayback Machine.
- ↑ Alan Reynolds (July 1999). "Capital gains tax: Analysis of reform options for Australia" (PDF). Hudson Institute. Archived from the original (PDF) on 2005-07-18.
- ↑ "Tax Rates During the Best Years for Economic Growth". The politics that work.
- ↑ (Karl Case and Ray Fair, 1999: pp. 780–1).
- ↑ Reynolds, Alan. "The "Conventional" Hypothesis: Deficit Estimates, Savings Rates, Twin Deficits and Yield Curves" (PDF). Cato Institute. Archived from the original (PDF) on August 6, 2009. Retrieved 2010-10-19.
- ↑ Chait, J. (2007). The Big Con: How Washington Got Hoodwinked and Hijacked by Crackpot Economics. Boston: Houghton Mifflin. ISBN 0-618-68540-5.
- ↑ CBO Historical Tables – Retrieved May 8, 2015
- ↑ Treasury Department (September 2006) [2003]. "Revenue Effects of Major Tax Bills" (PDF). United States Department of the Treasury. Working Paper 81, Table 2. Retrieved 2007-11-28.
- ↑ Blinder, A. S. (2006). "Can fiscal policy improve macro-stabilization". In Kopcke, E.; Tootell, G. M. B.; Triest, R. K. The macroeconomics of fiscal policy. Cambridge, MA: MIT Press. pp. 23–62. ISBN 0-262-11295-7.
- ↑ Quote from Mankiw with source in Bartels, L. M. (2008). Unequal democracy: The political-economy of the new gilded age. Princeton, NJ: Princeton University Press. ISBN 978-0-691-13663-9.
- ↑ NYT-N. Gregory Mankiw-A tax cut might be nice. But remember the deficit. June 2017
- ↑ Tobin, J. (1992). "Voodoo curse". Harvard International Review. 14 (4): 10.
- ↑ Case, K. E.; Fair, R. C. (2007). Principles of Economics (8th ed.). Upper Saddle Rive, NJ: Prentice Hall. ISBN 0-13-228914-8.
- ↑ Microsoft Word – SFB DP Frontpage.doc
- 1 2 3 `Dynamic' Scoring Finally Ends Debate On Taxes, Revenue. By Alan Murray. Wall Street Journal. (Eastern edition). New York, N.Y.: April 1, 2003. p. A.4
- ↑ The Atlantic-Jordan Weissmann-Study:Tax cuts might drive income inequality after all-May 30,2013
- 1 2 3 CBO-The Distribution of Household Income and Federal Taxes, 2013
- ↑ Tax Foundation-2017 Tax Brackets-Retrieved July 9, 2017
- ↑ CNBC-Robert Frank-Top 1% pay nearly half of federal income taxes-April 14, 2015
- ↑ Washington Post-Brad Plumer-Who doesn't pay taxes, in eight charts-September 18, 2012
- ↑ Social Security Administration Fact Sheet-2017 Social Security Changes
- ↑ Washington Post-Jared Bernstein-Bush tax cut plan loses trillions and worsens inequality-December 11,2015
- ↑ 1920s Income Tax Cuts Sparked Economic Growth and Raised Federal Revenues - Cato Institute
- ↑ The Historical Lessons of Lower Tax Rates - The Heritage Foundation
- ↑ Cutting Marginal Tax Rates: Evidence from the 1920s
- ↑ Tax Cuts, King Dollar & Growth: From JFK to Reagan to Trump
- ↑ (Karl Case ad Ray Fair, 1999: pp. 781–2).
- ↑ Case & Fair, pp. 781–2.
- ↑ Malabre, Jr., pp. 170–1.
- ↑ https://capx.co/busting-the-lefts-myths-about-reaganomics/
- ↑ Malabre, Jr., p. 188.
- ↑ Malabre, Jr., p. 195.
- ↑ Annual maximum taxable earnings and contribution rates – Social Security Administration
- ↑ The Reagan Tax Cuts: Lessons for Tax Reform – Joint Economic Committee Archived 2009-02-26 at the Wayback Machine.
- ↑ Malabre, Jr., pp. 197–8.
- ↑ Scheiber, Noam (2004-04-08). "Can Greg Mankiw Survive Politics?". The New Republic. Archived from the original on 2008-04-23.
- ↑ Moore, Stephen (2003-02-28). "Think Twice About Gregory Mankiw". National Review.
- 1 2 CBO Budget and Economic Outlook 2017-2027 Refer to Historical Budget Data-January 2017
- ↑ NYT-Neil Irwin-How Obama's Jobs Record Stacks Up-January 6, 2017
- ↑ The Economist-Timing is Everything-August 9, 2014
- ↑ "Tax Cuts for Job Creators". The New York Times. 2012-10-19.
- ↑ "Economists' statement opposing the Bush tax cuts (2003)".
- ↑ Friedman, Milton (15 January 2003). "What Every American Wants" – via Wall Street Journal.
- ↑ "Overview of the Tax Cut".
- ↑ "2001 Tax Cut".
- ↑ "The Truth About Tax Cuts".
- ↑ The boom that wasn't Archived 2007-12-29 at the Wayback Machine.
- ↑ "Fact Sheet: October 2007 Marks Record 50th Consecutive Month of Job Growth".
- ↑ "CBO Changes in CBO's Baseline Projections Since January 2001". CBO. June 7, 2012.
- 1 2 "CBO Budget and Economic Outlook 2009–2019". CBO. Retrieved November 21, 2016.
- ↑ "A review of the economic research on the effects of raising ordinary income tax rates: Higher revenue, unchanged growth, and uncertain but potentially large reductions in the growth of inequality". EPI.
- ↑ Microsoft Word – treasury dyn anal report jul 24 10am II FINAL.doc Archived 2007-07-14 at the Wayback Machine.
- 1 2 "Treasury Dynamic Scoring Analysis Refutes Claims by Supporters of the Tax Cuts - Center on Budget and Policy Priorities".
- ↑ "Greg Mankiw's Blog: CBO on Supply-side Economics".
- ↑ "Journal of Public Economics : Dynamic scoring: A back-of-the-envelope guide". Journal of Public Economics. ScienceDirect. 90: 1415–1433. doi:10.1016/j.jpubeco.2005.11.006. Retrieved 2009-12-03.
- 1 2 Papp, TK & Takáts, E. "Tax rate cuts and tax compliance—the Laffer curve revisited" (PDF). IMF Working Paper.
- ↑ See p. 5: "Contradicting the traditional labor supply based explanation of the Laffer effect, measures of labor supply remained mostly unchanged."
- ↑ Optimal Taxation of Top Labor Incomes: A Tale of Three Elasticities Thomas Piketty, Emmanuel Saez, Stefanie Stantcheva, NBER, Nov. 2011
- ↑ Gale, W. G. & Orszag, P. R. (2003-05-09). "Bush's Tax Plan Slashes Growth". The Brookings Institution. Retrieved 2007-10-23.
- ↑ Holter; et al. (November 2014). "How Does Tax Progressivity and Household Heterogeneity Affect Laffer Curves?" (PDF). Penn Institute for Economic Research. Centre for Economic Policy Research. Retrieved 29 July 2015.
- ↑ Tax Cuts: Myths and Realities, Center on Budget and Policy Priorities, 2008-05-09, retrieved 2016-08-26
- ↑ Furman, Jason (2006-08-24), Treasury Dynamic Scoring Analysis Refutes Claims by Supporters of the Tax Cuts, Center on Budget and Policy Priorities, retrieved 2016-08-26
- ↑ Barro, Josh (2015-03-17). "Tax Cuts Still Don't Pay for Themselves". The New York Times. ISSN 0362-4331. Retrieved 2016-08-26.
- ↑ Gale, William G.; Samwick, Andrew A. (2014-09-09), Effects of Income Tax Changes on Economic Growth (PDF), Brookings Institution, retrieved 2016-08-26
- ↑ Harper, David. "Understanding Supply-Side Economics".
- ↑ "Laffer Curve". IMG Forum. University of Chicago Booth School of Business. Retrieved 15 June 2015.
- ↑ "An Analysis of the President's Budgetary Proposals for Fiscal Year 2008" (PDF). 21 March 2007.
- ↑ "Analyzing the Economic and Budgetary Effects of a 10 Percent Cut in Income Tax Rates" (PDF). 1 December 2005.
- ↑ Krugman, Paul (2005-12-23). "The Tax Cut Zombies". New York Times.
- ↑ Krugman, Paul R. (2009). The Return Of Depression Economics And The Crisis Of 2008. W.W. Norton
ISBN 978-0-393-07101-6. p. 192. templatestyles stripmarker in
|publisher=at position 13 (help) - ↑ Galbraith, John Kenneth (1982-02-04). "Recession Economics". New York Review of Books.
External links
- Sowell, Thomas. "Trickle Down" Theory and "Tax Cuts for the Rich".
- Gwartney, James D. (2008). "Supply-Side Economics". In David R. Henderson. Concise Encyclopedia of Economics (2nd ed.). Indianapolis: Library of Economics and Liberty. ISBN 978-0865976658. OCLC 237794267.
- "Portion of Mundell's Nobel Prize Lecture" (awarded for unrelated work in optimum currency area). Claiming that supply side economics was responsible for growth, price stability and the collapse of the Soviet Union.
- "Supply Side Library". A collection of essays and studies by Robert Mundell, Paul Craig Roberts, Stephen Entin and Alan Reynolds.