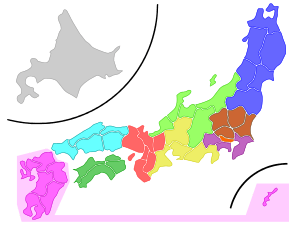
Japanese House of Councillors national proportional representation block
| National Proportional Representation | |
|---|---|
|
Parliamentary constituency for the Japanese House of Councillors | |
 | |
| Prefectures | Hokkaidō, Aomori, Iwate, Miyagi, Akita, Yamagata, Fukushima, Ibaraki, Tochigi, Gunma, Saitama, Chiba, Tōkyō, Kanagawa, Niigata, Toyama, Ishikawa, Fukui, Yamanashi, Nagano, Gifu, Shizuoka, Aichi, Mie, Shiga, Kyōto, Ōsaka, Hyōgo, Nara, Wakayama, Tottori, Shimane, Okayama, Hiroshima, Yamaguchi, Tokushima, Kagawa, Ehime, Kōchi, Fukuoka, Saga, Nagasaki, Kumamoto, Ōita, Miyazaki, Kagoshima, Okinawa |
| Population | 127,313,275 (est. 2018) |
| Current constituency | |
| Created | 1983 |
| Number of members | 96 |
The Japanese National Proportional Representation Block, known in Japan as the House of Councillors proportional district (参議院比例区 Sangiin hirei-ku) is an electoral district for the House of Councillors, the upper house of the National Diet of Japan. It consists of the whole nation and elects 48 members per election, 96 in total, by D'Hondt method proportional representation (PR).
Proportional voting was introduced to Japan in the 1983 House of Concillors election. The proportional district replaced the previous nationwide district (全国区 zenkoku-ku) which elected 100 members of the House of Councillors (50 per election) by single non-transferable vote, i.e. votes were for individuals not parties as in the prefectural districts. Initially, the proportional representation block also elected 50 members, but was reduced to 48 members in the 2001 election, bringing the total of proportional members down to 96 in 2004.
From 1983 to 1998, the vote in the proportional district of the House of Councillors had to be for a party, lists were closed. Since the 2001 election there is the option to cast a preference vote for a single candidate instead, the vote then counts for both the party in the allocation of proportional seats to party lists, as well as the candidate in the ordering of party lists. The system is a most open list system: The ranking of candidates on a party list strictly follows the number of preference votes. This ranking also applies to the runner-up replacements in case of vacancies.
Unlike elections to the House of Representatives, where a proportional segment was introduced in 1996, a simultaneous dual candidacy in both the majoritarian and the proportional election is not allowed in the House of Councillors.
Summary of results for major parties
Ruling parties at the time of the election are bolded.
| Regular election | LDP | JSP (–1996)/ SDP (1996–) |
JCP | ["Old"] Kōmeitō (–1994)/ ["New"] Kōmeitō (1998–) |
DSP (–1994) | NFP (1994–97)/ LP (1998–2003)/ PLP (2012–16)/ LP (2016–) |
["Old"] DPJ (1996–98)/ ["New"] DPJ (1998–2016)/ DP (2016–) |
Notable others (short-term major parties, minor ruling parties, ...) | |||||||||||||
|---|---|---|---|---|---|---|---|---|---|---|---|---|---|---|---|---|---|---|---|---|---|
| Class of 1983/89/... | Class of 1986/92/... |
Vote | Seats | Vote | Seats | Vote | Seats | Vote | Seats | Vote | Seats | Vote | Seats | Vote | Seats | Party | Vote | Seats | Party | Vote | Seats |
| 13th (1983) | 35.3% | 19 | 16.3% | 9 | 8.9% | 7 | 15.7% | 8 | 8.4% | 4 | Salary | 4.3% | 2 | ||||||||
| 14th (1986) | 38.6% | 22 | 17.2% | 9 | 9.5% | 4 | 13.0% | 7 | 6.9% | 3 | NLC | 2.4% | 1 | ||||||||
| 15th (1989) | 27.3% | 15 | 35.1% | 20 | 7.0% | 4 | 10.9% | 6 | 4.9% | 2 | RENGO | SNTV/FPTP only | |||||||||
| 16th (1992) | 33.0 | 19 | 17.6% | 10 | 7.8% | 4 | 14.8% | 8 | 5.0% | 3 | JNP | 8.0% | 4 | RENGO | SNTV/FPTP only | ||||||
| 17th (1995) | 27.3% | 15 | 16.9% | 9 | 9.5% | 5 | 30.8% | 18 | NPH | 3.6% | 2 | ||||||||||
| 18th (1998) | 25.2% | 14 | 7.8% | 4 | 14.6% | 8 | 13.8% | 7 | 9.3% | 5 | 21.7% | 12 | |||||||||
| 19th (2001) | 38.6% | 20 | 6.6% | 3 | 7.9% | 4 | 15.0% | 8 | 7.7% | 4 | 16.4% | 8 | CP | 2.3% | 1 | ||||||
| 20th (2004) | 30.6% | 15 | 5.5% | 3 | 8.0% | 4 | 15.7% | 8 | 38.6% | 19 | |||||||||||
| 21st (2007) | 28.1% | 14 | 4.5% | 2 | 7.5% | 3 | 13.2% | 7 | 39.5% | 20 | NPN | 3.0% | 1 | PNP | 2.2% | 1 | |||||
| 22nd (2010) | 24.1% | 12 | 3.9% | 2 | 6.1% | 3 | 13.1% | 6 | 31.6% | 16 | YP | 13.6% | 7 | PNP | 1.7% | 0 | |||||
| 23rd (2013) | 34.7% | 18 | 2.4% | 1 | 9.7% | 5 | 14.2% | 7 | 1.8% | 0 | 13.4% | 7 | JRP | 11.9% | 6 | YP | 8.9% | 4 | |||
| 24th (2016) | 35.9% | 19 | 2.7% | 1 | 10.7% | 5 | 13.5% | 7 | 1.9% | 1 | 21.0% | 11 | ORP | 9.2% | 4 | ||||||