List of countries by incarceration rate
This is a list of countries by incarceration rate.[1]
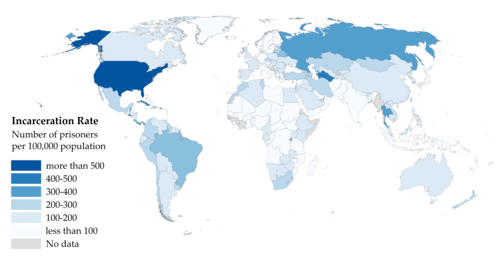
Incarceration rates
This list is initially sorted alphabetically. Click the sorting cell (with the ![]()
The chart source does not list an incarceration rate for the UK as a whole. In the list see Scotland, Northern Ireland, and England and Wales. If there is a rate for the United Kingdom in the table below it has been calculated by adding up the population of the constituent parts of the UK, and by adding up the prison populations.
If South Korea is not found in the table below look for it listed as Republic of (South) Korea. For info on North Korea, see notes below.
- "Notes" column links to notes section below the chart.
- "c." (circa) indicates "approximately". Sorting will not work correctly if it is in front of the number.
|
|
Notes
China
China. The rate of 118 is for sentenced prisoners in 2015 in Ministry of Justice prisons only. World Prison Brief: "1,649,804 [prisoners] at mid-2015 (via Asian and Pacific Conference of Correctional Administrators - sentenced prisoners in Ministry of Justice prisons only, excluding pre-trial detainees and those held in administrative detention). The Deputy Procurator-General of the Supreme People's Procuratorate reported in 2009 that, in addition to the sentenced prisoners, more than 650,000 were held in detention centres In China. If this was still correct in mid-2015 the total prison population in China was at least 2,300,000. ... 118 [rate] based on an estimated national population of 1.4 billion at mid-2015 (from United Nations figures) – sentenced prisoners in Ministry of Justice prisons only. (A total prison population of 2,300,000 would raise the prison population rate to 164 per 100,000.)"[1][2] See also: Re-education through labor and Laogai.
North Korea
North Korea. Little information exists regarding North Korea's incarceration rate. The U.S. Committee for Human Rights in North Korea estimates 150,000 to 200,000 incarcerated based on testimony of defectors from the state police bureau, which roughly equals 600-800 people incarcerated per 100,000.[3] For more info see Prisons in North Korea.
United Kingdom
United Kingdom. Main chart source only provides rates for the constituent parts of the UK.[1] In the above table see Scotland, Northern Ireland, and England and Wales. If they are not listed separately, then they can be found listed under the UK listing.
United States
| Juveniles in residential placement, 1997–2015. US[4] | |||
|---|---|---|---|
| Year | Male | Female | Total |
| 1997 | 90,771 | 14,284 | 105,055 |
| 1999 | 92,985 | 14,508 | 107,493 |
| 2001 | 89,115 | 15,104 | 104,219 |
| 2003 | 81,975 | 14,556 | 96,531 |
| 2006 | 78,998 | 13,723 | 92,721 |
| 2007 | 75,017 | 11,797 | 86,814 |
| 2010 | 61,359 | 9,434 | 70,793 |
| 2011 | 53,079 | 8,344 | 61,423 |
| 2013 | 46,421 | 7,727 | 54,148 |
| 2015 | 40,750 | 7,293 | 48,043 |
United States. Incarceration rate (per 100,000 population of all ages) is for inmates held in adult facilities in the USA. It does not include inmates in the custody of correctional facilities operated by departments of corrections in U.S. territories (American Samoa, Guam, and the U.S. Virgin Islands) and U.S. commonwealths (Northern Mariana Islands and Puerto Rico).[5][6]
In addition, there were 48,043 juveniles in juvenile detention in 2015.[4] For more juvenile detention information and numbers, see Youth incarceration in the United States.
See also
| Wikimedia Commons has media related to |
References
- 1 2 3 4 Highest to Lowest. World Prison Brief (WPB). Use dropdown menu to choose lists of countries by region, or the whole world. Use menu to select highest-to-lowest lists of prison population totals, prison population rates, percentage of pre-trial detainees / remand prisoners, percentage of female prisoners, percentage of foreign prisoners, and occupancy rate. Column headings in WPB tables can be clicked to reorder columns lowest to highest, or alphabetically. For detailed information for each country click on any country name in lists. See also the WPB main data page and click on the map links and/or the sidebar links to get to the region and country desired. Data for the whole Wikipedia list was last retrieved on 28 September 2018. Some numbers may be adjusted here later according to later info. Please update the table here only from this WPB source. For a quick method to fully update the table see the relevant section ("conversion examples") of Commons:Convert tables and charts to wiki code or image files.
- ↑ China. By World Prison Brief.
- ↑ The Hidden Gulag: The Lives and Voices of "Those Who are Sent to the Mountains", 2nd ed. By David Hawk. Published April 10, 2012 by Committee for Human Rights in North Korea. ISBN 0615623670.
- 1 2 Sickmund, M., Sladky, T.J., Kang, W., & Puzzanchera, C.. "Easy Access to the Census of Juveniles in Residential Placement". Office of Juvenile Justice and Delinquency Prevention. Click "National Crosstabs" at the top, and then choose the census years. Click "Show table" to get the total number of juvenile inmates for those years. Or go here for all the years. And here.
- ↑ United States of America. By World Prison Brief.
- ↑ Correctional Populations in the United States, 2016 (NCJ 251211). Published April 2018 by U.S. Bureau of Justice Statistics (BJS). By Danielle Kaeble and Mary Cowhig, BJS statisticians. See PDF. Appendix table 1 on page 11 has rates and counts by state. See page 1 "highlights" section for the "1 in ..." numbers. See table 4 on page 4 for a timeline of nationwide incarceration rates. See appendix table 3 on page 13, for "Persons held in custody in state or federal prisons or in local jails, 2000, 2010, and 2015–2016". That table also has incarceration rates. See appendix table 2 on page 12 for the number or persons incarcerated in territorial prisons, military facilities, and jails in Indian country.
External links
- Core Publications of the World Prison Brief. Such as the World Prison Population List, and the World Female Imprisonment List.
- Persons Detained Statistics of incarceration ("detained") from the United Nations Office on Drugs and Crime
- Prison population per capita. Edutube. World map. Move cursor over countries to see incarceration rates. Click the full-screen icon in the bottom-left of the map to launch it in a full-screen window. Then click anywhere on the map and use your mouse scroll wheel to zoom in or out. Drag the map to move it in any direction.
- Data Analysis Tools – Corrections Statistical Analysis Tool (CSAT) – Prisoners. United States Bureau of Justice Statistics.
- Number of inmates in Ukraine rises for first time in 7 years. 26 March 2009. Kyiv Post.
| Science | |||||||||
|---|---|---|---|---|---|---|---|---|---|
| Prisoners | |||||||||
| Prisons |
| ||||||||
| Culture | |||||||||
| Social issues |
| ||||||||
| Organizations |
| ||||||||
| Leaving prison | |||||||||
| Lists | |||||||||
| By country | |||||||||
| |||||||||