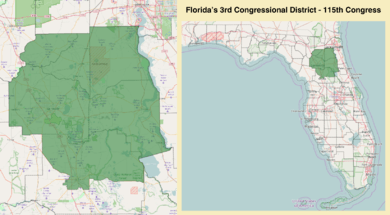
Florida's 3rd congressional district
| Florida's 3rd congressional district | |
|---|---|
 Florida's 3rd congressional district - since January 3, 2017. | |
| Current Representative | Ted Yoho (R–Gainesville) |
| Area | 3,844[1] sq mi (9,960 km2) |
| Distribution |
|
| Population (2016) | 732,088[3] |
| Ethnicity |
|
| Cook PVI | R+9[4] |
The Third Congressional District of Florida is an electoral district of the United States House of Representatives located in the U.S. state of Florida. It presently comprises a large section of northernmost Florida, including the entire counties of Alachua, Clay, Putnam, Bradford and Union, along with the majority of Marion county. The cities of Gainesville and Palatka are in the district as well as part of Ocala (its northern suburbs). Some Jacksonville suburbs such as Middleburg, Green Cove Springs, and Orange Park are also in the district.
Redistricting in Florida, effective for the 2012 federal elections, radically altered the nature of the 3rd District. From 1993 through 2012 the district called the 3rd District comprised an entirely different territory, roughly similar to the 5th District as of 2013. Likewise the present territory of the new 3rd District, as of the 2012 elections, is made up of parts of the former 2nd, 4th, 5th, and 6th districts, though it is geographically similar to the pre-2013 6th district. The former 3rd District was (and present 5th District is) an intentionally gerrymandered territory designed to unite disparate areas of northeastern Florida with significant African-American populations into a black-majority district, and was overwhelmingly Democratic in voting patterns.
The new 3rd District has a majority white population, largely in rural areas and small towns. The only cities of any size in the district are Gainesville and Ocala.
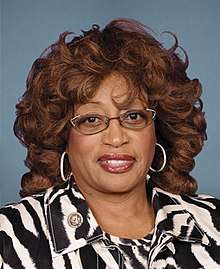
The new 3rd District is represented by Republican Ted Yoho, elected on November 6, 2012, and taking office on January 3, 2013. The old 3rd District was represented from 1993 through 2012 by Corrine Brown, who was elected to the similar new 5th District in the November 2012 elections.
The 1993–2012 black majority district
The old 3rd district was a gerrymandered congressional district. The district included portions of Alachua, Clay, Duval, Lake, Marion, Orange, Putnam, Seminole, and Volusia counties.
History
While Florida has had at least three congressional districts since the 1900 U.S. Census, the 1993–2012 3rd Congressional District dates to reapportionment done by the Florida Legislature after the 1990 U.S. Census. Because Florida has a large population of African Americans, but not a large enough concentration anywhere in the state to easily configure a congressional district with a majority, there were several attempts to create a few gerrymandered districts which were certain to elect an African American candidate. This created an odd coalition of black Democrats and Republicans who supported such districts (since this not only created black-majority districts, but also made "safer" Republican districts elsewhere). This effort was opposed by many white Democrats, but eventually this idea won the support of the state legislature and this district was created as a result.[5]
The 1993–2012 3rd Congressional District was geographically diverse. Starting from the southern part of the district, it included the Pine Hills area of the Orlando-Kissimmee Metropolitan Area with small pockets of African-American neighborhoods in the cities of Sanford, Gainesville, Palatka, and finally the larger African American communities of Jacksonville. Connecting these areas were regions which are sparsely populated—either expansive rural areas or narrow strips which are only a few miles wide. Barack Obama received 73% of the vote in this district in the 2008 Presidential election.
Voting
| Election results from presidential races | ||
|---|---|---|
| Year | Office | Results |
| 1992 | President | Clinton 52–34% |
| 1996 | President | Clinton 61–33% |
| 2000 | President | Gore 60–38% |
| 2004 | President | Kerry 65–35% |
| 2008 | President | Obama 73–26% |
| 2012 | President | Romney 56-40% |
| 2016 | President | Trump 56-41% |
Voter registration
| Voter Registration and Party Enrollment as of 18 October 2016 | |||
|---|---|---|---|
| Party | Voters | Percentage | |
| Republican | 198,055 | 40.92% | |
| Democratic | 178,562 | 36.90% | |
| No Party Affiliation | 95,276 | 19.69% | |
List of representatives
| Representative | Party | Years | Electoral history | |
|---|---|---|---|---|
| District created March 4, 1903 | ||||
 |
Democratic | March 4, 1903 – March 3, 1909 |
[Data unknown/missing.] | |
 |
Democratic | March 4, 1909 – March 3, 1913 |
[Data unknown/missing.] | |
 |
Democratic | March 4, 1913 – March 3, 1917 |
[Data unknown/missing.] | |
 |
Democratic | March 4, 1917 – March 3, 1919 |
[Data unknown/missing.] | |
 |
Democratic | March 4, 1919 – March 3, 1927 |
[Data unknown/missing.] | |
|
Democratic | March 4, 1927 – March 3, 1933 |
[Data unknown/missing.] | |
 |
Democratic | March 4, 1933 – January 3, 1941 |
[Data unknown/missing.] | |
 |
Democratic | January 3, 1941 – October 19, 1944 |
Resigned to enter the U.S. Army. | |
| Vacant until next Congress | October 19, 1944 – January 3, 1945 | |||
|
Democratic | January 3, 1945 – January 3, 1963 |
Redistricted to the 1st district. | |
 |
Democratic | January 3, 1963 – January 3, 1967 |
Redistricted to the 11th district. | |
 |
Democratic | January 3, 1967 – January 3, 1993 |
Redistricted from the 2nd district. | |
 |
Democratic | January 3, 1993 – January 3, 2013 |
Redistricted to the 5th district. | |
.jpg) |
Republican | January 3, 2013 – present |
[Data unknown/missing.] | |
Recent election results
2002
| Party | Candidate | Votes | % | |
|---|---|---|---|---|
| Democratic | Corrine Brown* | 88,462 | 59.29 | |
| Republican | Jennifer Carroll | 60,747 | 40.71 | |
| Total votes | 149,209 | 100.00 | ||
| Turnout | ||||
| Democratic hold | ||||
2004
| Party | Candidate | Votes | % | |
|---|---|---|---|---|
| Democratic | Corrine Brown* | 172,833 | 99.24 | |
| No party | Others | 1,323 | 0.76% | |
| Total votes | 174,156 | 100.00 | ||
| Turnout | ||||
| Democratic hold | ||||
2006
| Party | Candidate | Votes | % | |
|---|---|---|---|---|
| Democratic | Corrine Brown* | 100.00 | ||
| Total votes | 100.00 | |||
| Turnout | ||||
| Democratic hold | ||||
2008
| Party | Candidate | Votes | % | |
|---|---|---|---|---|
| Democratic | Corrine Brown* | 100.00 | ||
| Total votes | 100.00 | |||
| Turnout | ||||
| Democratic hold | ||||
2010
| Party | Candidate | Votes | % | |
|---|---|---|---|---|
| Democratic | Corrine Brown* | 94,744 | 63.04 | |
| Republican | Mike Yost | 50,932 | 33.89 | |
| Independent | Terry Martin-Back | 4,625 | 3.08 | |
| Total votes | 150,301 | 100.00 | ||
| Turnout | ||||
| Democratic hold | ||||
Historical district boundaries
.tif.png)
2013 - 2017 
2003 - 2013
Living former representatives
As of January 2017, there is one former member of the U.S. House of Representatives from Florida's 3rd congressional district who is currently living at this time.
| Representative | Term in office | Date of birth (and age) |
|---|---|---|
| Corrine Brown | 1993–2003 | November 11, 1946 |
References
- ↑ "Congressional Plan--SC14-1905 (Ordered by The Florida Supreme Court, 2-December-2015)" (PDF). Florida Senate Committee on Reapportionment. Retrieved 11 January 2017.
- ↑ https://www.census.gov/geo/maps-data/data/cd_state.html
- ↑ https://www.census.gov/mycd/?st=12&cd=03
- ↑ "Partisan Voting Index – Districts of the 115th Congress" (PDF). The Cook Political Report. April 7, 2017. Retrieved April 7, 2017.
- ↑ Leary, Alex (14 May 2011). "Democrat U.S. Rep. Corrine Brown again aligns with GOP in Florida redistricting battle". Tampa Bay Times. Retrieved 5 August 2014.
- Martis, Kenneth C. (1989). The Historical Atlas of Political Parties in the United States Congress. New York: Macmillan Publishing Company.
- Martis, Kenneth C. (1982). The Historical Atlas of United States Congressional Districts. New York: Macmillan Publishing Company.
- Congressional Biographical Directory of the United States 1774–present
External links
Coordinates: 29°50′05″N 82°44′09″W / 29.83472°N 82.73583°W