German federal election, 1920
|
| |||||||||||||||||||||||||||||||||||||||||||||||||||||||||||||||||||||||||||||||||||||
| |||||||||||||||||||||||||||||||||||||||||||||||||||||||||||||||||||||||||||||||||||||
All 459 seats in the Reichstag 230 seats needed for a majority | |||||||||||||||||||||||||||||||||||||||||||||||||||||||||||||||||||||||||||||||||||||
|---|---|---|---|---|---|---|---|---|---|---|---|---|---|---|---|---|---|---|---|---|---|---|---|---|---|---|---|---|---|---|---|---|---|---|---|---|---|---|---|---|---|---|---|---|---|---|---|---|---|---|---|---|---|---|---|---|---|---|---|---|---|---|---|---|---|---|---|---|---|---|---|---|---|---|---|---|---|---|---|---|---|---|---|---|---|
| Turnout | 79.2% | ||||||||||||||||||||||||||||||||||||||||||||||||||||||||||||||||||||||||||||||||||||
| |||||||||||||||||||||||||||||||||||||||||||||||||||||||||||||||||||||||||||||||||||||
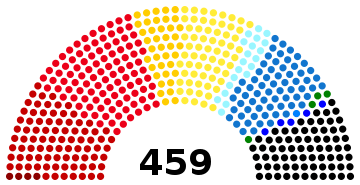 Composition of the Reichstag after the 1920 election. | |||||||||||||||||||||||||||||||||||||||||||||||||||||||||||||||||||||||||||||||||||||
| |||||||||||||||||||||||||||||||||||||||||||||||||||||||||||||||||||||||||||||||||||||
.jpg)


Federal elections were held in Germany on 6 June 1920.[1] The Social Democratic Party remained the largest party in the Reichstag, although it lost over a third of its seats.[2] Voter turnout was 79.2%.[3]
Results
| Party | Votes | % | Seats | +/– |
|---|---|---|---|---|
| Social Democratic Party (SPD) | 6,104,398 | 21.7 | 102 | −63 |
| Independent Social Democratic Party of Germany (USPD) | 5,046,813 | 17.9 | 84 | +62 |
| German National People's Party (DNVP) | 4,249,100 | 15.1 | 71 | +27 |
| German People's Party (DVP) | 3,919,446 | 13.9 | 65 | +46 |
| Centre Party | 3,845,001 | 13.6 | 64 | −27 |
| German Democratic Party (DDP) | 2,333,741 | 8.3 | 39 | −36 |
| Bavarian People's Party (BVP) | 1,173,344 | 4.2 | 20 | New |
| Communist Party of Germany (KPD) | 589,454 | 2.1 | 4 | New |
| German-Hanoverian Party (DHP) | 319,108 | 1.1 | 5 | +4 |
| Bavarian Peasants' League (BB) | 218,596 | 0.8 | 4 | 0 |
| Poland Party | 89,228 | 0.3 | 0 | New |
| German Economic League for City and Country | 88,800 | 0.3 | 0 | New |
| Christian People's Party | 65,260 | 0.3 | 1 | New |
| Polish Catholic Party of Upper Silesia | 51,437 | 0.2 | 0 | New |
| Schleswig-Holstein State Party | 25,907 | 0.1 | 0 | New |
| German Social Party | 22,958 | 0.1 | 0 | New |
| German Middle Class Party | 21,255 | 0.1 | 0 | New |
| Lusatian People's Party | 8,050 | 0.0 | 0 | New |
| German Socialist Party | 7,186 | 0.0 | 0 | New |
| Reform Group | 6,832 | 0.0 | 0 | New |
| Schleswig Club | 4,966 | 0.0 | 0 | New |
| National Democratic People's Party | 4,015 | 0.0 | 0 | New |
| Christian Social People's Party | 1,219 | 0.0 | 0 | New |
| Independent Party | 169 | 0.0 | 0 | New |
| German Economy and Labour Party | 43 | 0.0 | 0 | New |
| Upper Silesian Catholic People's Party | 6 | 0.0 | 0 | New |
| Invalid/blank votes | 267,249 | – | – | – |
| Total | 28,463,581 | 100 | 459 | +36 |
| Registered voters/turnout | 35,949,774 | 79.2 | – | – |
| Source: Nohlen & Stöver, Gonschior.de | ||||

Electoral map (in German)
References
| Parliamentary elections | |
|---|---|
| Presidential elections | |
| European elections | |
| Referendums | |
| |
This article is issued from
Wikipedia.
The text is licensed under Creative Commons - Attribution - Sharealike.
Additional terms may apply for the media files.