Electricity sector in Canada
| Part of a series on the |
| Economy of Canada |
|---|
| Economic history of Canada |
| Sectors |
|
| Economy by province |
| Economy by city |
The electricity sector in Canada has played a significant role in the economic and political life of the country since the late 19th century. The sector is organized along provincial and territorial lines. In a majority of provinces, large government-owned integrated public utilities play a leading role in the generation, transmission and distribution of electricity. Ontario and Alberta have created electricity markets in the last decade in order to increase investment and competition in this sector of the economy.[1]
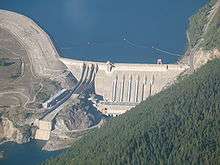
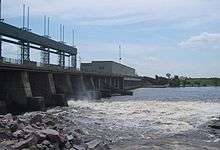
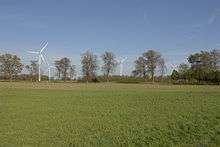
Hydroelectricity accounted for 58% of all electric generation in Canada in 2007,[2][3] making Canada the world's second-largest producer of hydroelectricity after China.[4] Since 1960, large hydroelectric projects, especially in Quebec, British Columbia, Manitoba and Newfoundland and Labrador, have significantly increased the country's generation capacity. Canada is the world's sixth-largest producer of electricity generated by nuclear power, producing 97 billion kWh in 2013.[5] In Ontario, Canadian-designed CANDU nuclear reactors supplied more than half the provincial electricity demand in 2007.[3] In April 2014, Ontario became the first jurisdiction in North America to fully eliminate coal as a source of electricity generation.[6][7]
Canadian homes, offices and factories are large users of electricity, or hydro, as it is often called in many regions of Canada.[8] In 2007, Canadian per capita power consumption was among the highest in the world, with an average of 16,995 kWh per annum.[9]
History
Electricity has been significant for Canada's economy and politics since the late 19th century. In the 1890s, three firms competed to develop the Canadian Niagara Falls.[10] After the First World War, the provincial utilities were created. The public companies focused on rural electrification and hydroelectric development.
Organization
The electricity sector in Canada is organized along provincial and territorial lines as part of their jurisdiction over natural resources. All provinces and territories have set up utilities boards and regulate transmission and distribution rates.
The liberalization process of the 1990s changed some parameters such as the unbundling of generation, transmission and distribution functions of incumbent utilities in order to foster a competitive wholesale market[11] or, as in the cases of large exporters like Quebec and British Columbia, to comply with Order 888 of the Federal Energy Regulatory Commission and other U.S. market rules. Most provincial governments still maintain a strong financial stake as operators in the electrical markets.
In a majority of provinces and territories, utilities are vertically integrated Crown corporations operating as regulated monopolies. This is by and large the case in New Brunswick, Quebec, Manitoba, Saskatchewan, British Columbia and Nunavut. A second model involves a Crown corporation as a large generator or in transmission, alongside an investor-owned distributor, as in Newfoundland and Labrador, Yukon, the Northwest Territories and, to a lesser degree, Prince Edward Island. Nova Scotia has granted a virtual monopoly to Nova Scotia Power, when it divested its investments in the sector in 1992.[12] However, there remain half a dozen small public electric distributors - the Municipal Electric Utilities of Nova Scotia who have the right to buy power from other parties, or generate their own. NS has a feed-in tariff program to encourage smaller generators.
Two provinces, Ontario and Alberta, have deregulated their electric industry to different degrees over the last decade. Both provinces operate electricity markets, but there are significant differences between the two systems. The Ontario market is a hybrid, with the Ontario Power Authority (now merged with the IESO) "contracting for supply, integrated system planning, and regulated pricing for much of Ontario's generation and load".[11] In Alberta, the generation business is competitive, while transmission and distribution are rate-regulated.[11]
A number of municipalities operate local distribution systems. Some of them, such as EPCOR in Edmonton, are also significant players in the power generation business, under their name or through their control of publicly traded companies.
The federal government, through the National Energy Board, issues permits for inter-provincial and international power lines.[13] The Canadian Nuclear Safety Commission has jurisdiction over nuclear safety.[14] Ottawa and the provinces share jurisdiction over environmental issues such as air pollution and greenhouse gas emissions. Also, major hydroelectric developments trigger federal environmental assessment processes,[15] as the Government of Canada has the power to regulate waterways and fisheries.
Energy-intensive businesses, such as the aluminium smelting and pulp and paper industries have made significant investments over time in power generation. One such company is Rio Tinto Alcan, which owns and operates 7 hydroelectric generating stations in Quebec and British Columbia, with a combined installed capacity of 3,300 MW.[16][17]
In recent years, partial or complete deregulation of the wholesale generation business have created a number of Independent Power Producers, who build and operate power plants and sell over the long term, through power purchase agreements — with terms of up to 35 years[18] — and in day-ahead and hour-ahead transactions, where such markets exist.
Generation
| Electricity generation in Canada |
|---|
 |
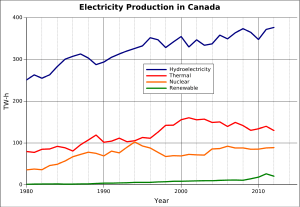
In 2013, Canada generated 651.8 terawatt-hours (TWh), a 10% increase since 2003. Approximately 822 generating stations are scattered from the Atlantic to the Pacific,[19] for a nameplate capacity of 130,543 MW.[20] The 100 largest generating stations in Canada have a combined capacity of 100,829 MW. In comparison, the total installed capacity of Canada was 111,000 MW in 2000.[21]
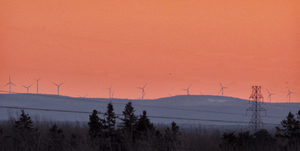
In 2013, the leading type of power generation by utilities in Canada is hydroelectricity, with a share of 60.1%. Nuclear (15.8%), natural gas (10.3%), coal (10%), wind (1.8%), fuel oil (1.2%), biofuels and waste (0. 8%), wood (0.4%) and solar (0.1%) follow. Other sources, such as petroleum coke make up the remaining 0.5%.[22][23][24]
However, these figures do not account for the variety of provincial generation mixes. Historic producers of coal, like Alberta (66.9%), Nova Scotia (58.2%), and Saskatchewan (54.8%) have come to rely mainly on coal-fired generating stations. In hydro-rich provinces, such as Manitoba (99.5%), Quebec (97.2%), Yukon (94.1%), and British Columbia (88.7%), hydroelectric power accounts for the bulk of all electric generation.
In Canada's most populated province, Ontario Hydro has developed 11,990 MW of nuclear capacity between 1966 and 1993, building 20 CANDU reactors at 3 sites: Pickering, Darlington and Bruce. New Brunswick and by extension, Prince Edward Island, which buys 96% of its power from the neighbouring province,[25] has a diversified mix, including a nuclear reactor and hydroelectric dams. However, the province is dependent on expensive fuel oil generation.[26]
The electrical generating capacities of the provinces and territories in Canada are broken down below. Numbers are given in megawatts (MW) and gigawatt-hours (GWh). The tables below use 2010 data from Statistics Canada.
Nameplate capacity
| Type | Canada | NL | PE | NS | NB | QC | ON | MB | SK | AB | BC | YT | NT | NU | |
|---|---|---|---|---|---|---|---|---|---|---|---|---|---|---|---|
| MW | |||||||||||||||
| Hydro | 75,077 | 6,781 | 0 | 374 | 947 | 38,438 | 8,406 | 5,054 | 856 | 883 | 13,205 | 78 | 56 | 0 | |
| Wind | 3,973 | 54 | 152 | 218 | 249 | 658 | 1,457 | 104 | 171 | 806 | 104 | 1 | 0 | 0 | |
| Tidal | 20 | 0 | 0 | 20 | 0 | 0 | 0 | 0 | 0 | 0 | 0 | 0 | 0 | 0 | |
| Solar | 108 | 0 | 0 | 0 | 0 | 0 | 108 | 0 | 0 | 0 | 0 | 0 | 0 | 0 | |
| Thermal | 51,365 | 584 | 117 | 2,006 | 2,849 | 3,018 | 25,516 | 501 | 3,159 | 11,107 | 2,291 | 33 | 127 | 54 | |
| Conventional Steam | 25,491 | 490 | 67 | 1,686 | 2,068 | 959 | 9,101 | 250 | 2,173 | 7,780 | 897 | 0 | 0 | 0 | |
| Nuclear | 12,665 | 0 | 0 | 0 | 0[lower-alpha 1] | 675[lower-alpha 2] | 11,990 | 0 | 0 | 0 | 0 | 0 | 0 | 0 | |
| Combustion turbine | 12,406 | 43 | 50 | 320 | 779 | 1,252 | 4,340 | 241 | 981 | 3,037 | 1,343 | 0 | 19 | 0 | |
| Internal combustion | 803 | 51 | 0 | 0 | 3 | 131 | 85 | 10 | 5 | 271 | 51 | 33 | 107 | 54 | |
| Total installed capacity | 130,543 | 7,419 | 269 | 2,618 | 4,045 | 42,115 | 35,487 | 5,659 | 4,186 | 12,796 | 15,600 | 112 | 183 | 54 | |
| Type | Canada | NL | PE | NS | NB | QC | ON | MB | SK | AB | BC | YT | NT | NU | |
|---|---|---|---|---|---|---|---|---|---|---|---|---|---|---|---|
| MW | |||||||||||||||
| Hydro | 79,232 | 6,759 | 0 | 371 | 952 | 40,159 | 8,991 | 5,402 | 867 | 942 | 14,639 | 95 | 56 | 0 | |
| Wind | 7,641 | 54 | 204 | 301 | 294 | 2,174 | 2,763 | 242 | 171 | 1,039 | 390 | 1 | 9 | 0 | |
| Tidal | 20 | 0 | 0 | 20 | 0 | 0 | 0 | 0 | 0 | 0 | 0 | 0 | 0 | 0 | |
| Solar | 194 | 0 | 0 | 0 | 0 | 20 | 173 | 0 | 0 | 1 | 0 | 0 | 0 | 0 | |
| Thermal | 48,182 | 590 | 130 | 1,970 | 3,259 | 1,378 | 23,836 | 558 | 3,213 | 11,413 | 1,589 | 34 | 136 | 75 | |
| Conventional steam | 20,469 | 490 | 80 | 1,650 | 1,752 | 399 | 5,375 | 280 | 2,136 | 7,230 | 1,077 | 0 | 0 | 0 | |
| Nuclear | 14,033 | 0 | 0 | 0 | 705 | 0 | 13,328 | 0 | 0 | 0 | 0 | 0 | 0 | 0 | |
| Combustion turbine | 12,473 | 43 | 50 | 320 | 797 | 794 | 4,900 | 268 | 1,059 | 3,786 | 437 | 0 | 20 | 0 | |
| Internal combustion | 1,207 | 57 | 0 | 0 | 5 | 184 | 233 | 10 | 18 | 397 | 75 | 34 | 116 | 75 | |
| Total Installed Capacity | 135,268 | 7,403 | 333 | 2,661 | 4,505 | 43,731 | 35,763 | 6,202 | 4,252 | 13,395 | 16,618 | 130 | 201 | 75 | |
Total generation by type
| Type | Canada | NL | PE | NS | NB | QC | ON | MB | SK | AB | BC | YT | NT | NU | |
|---|---|---|---|---|---|---|---|---|---|---|---|---|---|---|---|
| GWh | |||||||||||||||
| Hydro | 347,417.8 | 39,618.2 | 0 | 1,002.0 | 3,296.5 | 178,860.3 | 32,575.2 | 33,269.1 | 3,866.7 | 1,558.3 | 52,762.3 | 380.4 | 228.8 | 0 | |
| Wind | 3,665.7 | 0 | 353.5 | 124.5 | 317.9 | 376.0 | 1,270.5 | 0 | 535.4 | 687.8 | 0 | 0.1 | 0 | 0 | |
| Tidal | 27.7 | 0 | 0 | 27.7 | 0 | 0 | 0 | 0 | 0 | 0 | 0 | 0 | 0 | 0 | |
| Solar | 0 | 0 | 0 | 0 | 0 | 0 | 0 | 0 | 0 | 0 | 0 | 0 | 0 | 0 | |
| Thermal | 215,648.4 | 1,142.8 | 0.7 | 10,508.7 | 7,459.0 | 4,858.2 | 107,401.4 | 173.7 | 17,660.2 | 59,046.0 | 6,714.9 | 23.6 | 493.9 | 165.4 | |
| Conventional Steam | 104,190.8 | 803.1 | 0.7 | 10,115.8 | 5,569.8 | 1,097.6 | 16,818.0 | 151.9 | 16,383.1 | 48,876.6 | 4,374.3 | 0 | 0 | 0 | |
| Nuclear | 85,219.9 | 0 | 0 | 0 | -44.9 | 3,291.5 | 81,973.3 | 0 | 0 | 0 | 0 | 0 | 0 | 0 | |
| Internal combustion | 1,073.4 | 51.7 | 0.1 | 0 | 0 | 269.7 | 39.3 | 13.2 | 0.5 | 84.9 | 62.1 | 23.6 | 363.0 | 165.4 | |
| Combustion turbine | 25,164.3 | 288.0 | 0 | 392.9 | 1,934.1 | 199.4 | 8,570.8 | 8.6 | 1,276.6 | 10,084.5 | 2,287.5 | 0 | 130.9 | 0 | |
| Other | 0 | 0 | 0 | 0 | 0 | 0 | 0 | 0 | 0 | 0 | 0 | 0 | 0 | 0 | |
| Total electricity generated | 566,759.7 | 40,761.1 | 354.2 | 11,662.9 | 11,073.4 | 184,094.4 | 141,247.1 | 33,442.8 | 22,062.3 | 61,292.1 | 59,477.2 | 404.1 | 722.7 | 165.4 | |
- ↑ Zero value no longer current as the Point Lepreau Nuclear Generating Station returned to commercial service on November 23, 2012.
- ↑ Value no longer current as the Gentilly-2 reactor at the Gentilly Nuclear Generating Station was removed from commercial service on December 28, 2012.
- ↑ Net values.
Utilities generation by fuel
| Fuel | Canada | NL | PE | NS | NB | QC | ON | MB | SK | AB | BC | YT | NT | NU | |
|---|---|---|---|---|---|---|---|---|---|---|---|---|---|---|---|
| GWh | |||||||||||||||
| Total solids | 78,983.0 | 0 | 4.3 | 8,000.9 | 3,072.0 | 846.9 | 12,854.6 | 44.4 | 12,084.2 | 41,463.7 | 603.5 | 0 | 0 | 0 | |
| Coal | 74,300.0 | 0 | 0 | 6,791.8 | 2,081.0 | 0 | 12,285.4 | 44.4 | 12,084.2 | 41,013.1 | 0 | 0 | 0 | 0 | |
| Wood | 2,306.5 | 0 | 2.4 | 184.0 | 0 | 660.5 | 405.4 | 0 | 0 | 450.6 | 603.5 | 0 | 0 | 0 | |
| Petroleum coke | 2,024.3 | 0 | 0 | 1,033.4 | 990.9 | 0 | 0 | 0 | 0 | 0 | 0 | 0 | 0 | 0 | |
| Other solid fuels | 352.1 | 0 | 1.9 | 0 | 0 | 186.4 | 163.8 | 0 | 0 | 0 | 0 | 0 | 0 | 0 | |
| Total liquids | 3,057.8 | 915.2 | -0.5 | 49.9 | 1,307.2 | 367.6 | 60.6 | 17.0 | 17.7 | 12.6 | 62.6 | 25.0 | 61.1 | 161.9 | |
| Total petroleum products | 3,057.7 | 915.2 | -0.5 | 49.9 | 1307.2 | 367.6 | 60.6 | 17.0 | 17.7 | 12.5 | 62.6 | 25.0 | 61.1 | 161.9 | |
| Propane | 0.1 | 0 | 0 | 0 | 0 | 0 | 0 | 0 | 0 | 0.1 | 0 | 0 | 0 | 0 | |
| Other Liquid Fuels | 0 | 0 | 0 | 0 | 0 | 0 | 0 | 0 | 0 | 0 | 0 | 0 | 0 | 0 | |
| Total gas | 34,512.6 | 0 | 0 | 2,274.7 | 1,873.4 | 326.2 | 15,020.1 | 22.9 | 3,309.2 | 10,775.6 | 1,856.5 | 0 | 27.5 | 0 | |
| Natural Gas | 34,512.6 | 0 | 0 | 2,274.7 | 1,836.5 | 199.7 | 15,020.1 | 22.9 | 3,309.2 | 10,234.4 | 1,856.5 | 0 | 27.5 | 0 | |
| Methane | 0 | 0 | 0 | 0 | 4.6 | 59.6 | 0 | 0 | 0 | 51.7 | 0 | 0 | 0 | 0 | |
| Other Gaseous Fuels | 0 | 0 | 0 | 0 | 32.3 | 66.9 | 0 | 0 | 0 | 489.5 | 0 | 0 | 0 | 0 | |
| Uranium | 85,526.6 | 0 | 0 | 0 | 0 | 3,551.6 | 81,975 | 0 | 0 | 0 | 0 | 0 | 0 | 0 | |
| Steam from waste heat | 6,179.7 | 0 | 0 | 0 | 680.7 | 0 | 2,716.4 | 0 | 627.6 | 1,504.4 | 650.6 | 0 | 0 | 0 | |
Note: Ontario eliminated coal in 2014.
Electricity per person and by power source
| Electricity per person in Canada (kWh/ hab.) [28] | ||||||||||||
|---|---|---|---|---|---|---|---|---|---|---|---|---|
| Use | Production | Export | Exp. % | Fossil | Nuclear | Nuc. % | Other RE* | Bio+waste | Wind | Non RE use* | RE %* | |
| 2004 | 18,408 | 18,733 | -326 | -1.8 % | 4,912 | 2,829 | 15.4% | 10,720 | 272 | 7,416 | 59.7% | |
| 2005 | 18,729 | 19,467 | -738 | -3.9 % | 5,019 | 2,852 | 15.2% | 11,315 | 281 | 7,133 | 61.9% | |
| 2006 | 18,281 | 19,216 | -935 | -5.1 % | 4,740 | 2,862 | 15.7% | 11,317 | 297 | 6,667 | 63.5% | |
| 2008 | 18,111 | 19,092 | -981 | -5.4 % | 4,653 | 2,834 | 15.6% | 11,333 | 272 | 6,506 | 64.1% | |
| 2009 | 17,507 | 18,566 | - 1,059 | - 6,0 % | 4,572 | 2,696 | 15.4% | 10,942 | 239 | 113 | 6,213 | 64.5% |
| * Other RE is waterpower, solar and geothermal electricity and windpower until 2008 * Non RE use = use – production of renewable electricity * RE % = (production of RE / use) * 100% Note: EU calculates the share of renewable energies in gross electrical consumption. | ||||||||||||
In 2009 the Canadian production of electricity was 18,566 kWh per person and domestic use about 94% of production (17,507 kWh/person).[29] In 2008 the OECD average was 8,991 kWh/person.[30] 64.5% of Canadian domestic electricity use was produced with the renewable sources. The non renewable electricity use, i.e. fossil and nuclear, in Canada in 2009 was 6,213 kWh/person, respectively in UK 5,579; Germany 5,811; Denmark 4,693; Spain 4,553; Finland 11,495 and the United States 12,234.[29]
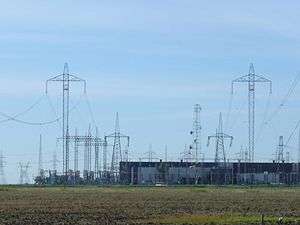
Transmission
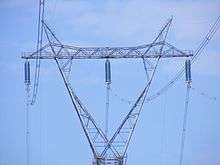
The Canadian transmission networks extend over 160,000 km (99,000 mi).[31] The grids generally follow north-south orientations since most population centres in Canada are concentrated in southern regions along the American border while the largest hydroelectric and nuclear projects are located in sparsely inhabited areas to the north. This particular situation forced Canadian utilities to innovate. In November 1965, Hydro-Québec commissioned the first 735-kV AC power line linking the Manic-Outardes project to the Lévis substation.[32] In 1972, Manitoba Hydro connected generating stations part of the Nelson River Hydroelectric Project to the Winnipeg area through a high-voltage direct current power line, the Nelson River Bipole.[33]
The Canadian transmission networks are largely integrated to the US power grid. There is greater integration and trade with the US than there is between Canada’s provinces.[34] The transmission utilities of provinces sharing a border with the United States are taking part in regional reliability organizations such as the North American Electric Reliability Corporation (NERC); the Maritime provinces, Quebec and Ontario are part of the Northeast Power Coordinating Council (NPCC) with utilities in New England and in New York State, Manitoba participates in the Midwest Reliability Organization (MRO), while Alberta and British Columbia are linked to the Western Electricity Coordinating Council (WECC).
Utilities across Canada are making large investments in the maintenance of ageing infrastructure and in the construction of new power lines and substations to connect new generation sources to the bulk power system. For instance, Ontario is spending $2.3 billion on a series of transmission projects aimed at connecting new renewable capacity fostered by the Green Energy Act.[35] In Alberta, the AESO is recommending the construction of a $1.83 billion, 240 kV looped system in the southern part of the province to integrate up to 2,700 MW of new wind generation.[36] In Quebec, Hydro-Québec TransÉnergie filed a $1.47 billion investment plan to connect 2,000 MW of new wind generation scheduled to come on-stream between 2011 and 2015.[37]
Rates
| City (Utility) | Residential [basis 1] |
Small power [basis 2] |
Medium power [basis 3] |
Large power [basis 4] |
|---|---|---|---|---|
| St. John's (Newfoundland Power/NL Hydro) | 11.80 | 11.83 | 9.05 | 3.98 |
| Charlottetown (Maritime Electric) | 14.51 | 15.18 | 12.68 | 8.36 |
| Halifax (Nova Scotia Power) | 15.01 | 14.25 | 11.99 | 9.00 |
| Moncton (NB Power) | 11.82 | 12.46 | 10.98 | 6.86 |
| Montreal (Hydro-Québec) | 6.76 | 8.85 | 7.19 | 4.51 |
| Ottawa (Hydro Ottawa) | 13.14 | 12.94 | 11.42 | 10.58 |
| Toronto (Toronto Hydro) | 13.57 | 13.41 | 11.43 | 10.46 |
| Winnipeg (Manitoba Hydro) | 7.46 | 7.29 | 5.62 | 3.69 |
| Regina (SaskPower) | 12.54 | 10.31 | 9.08 | 5.67 |
| Edmonton (EPCOR) | 12.90 | 12.41 | 11.07 | 6.97 |
| Calgary (ENMAX) | 13.89 | 11.24 | 9.53 | 8.28 |
| Vancouver (BC Hydro) | 8.78 | 9.73 | 7.08 | 3.69 |
- Notes
Provinces

Alberta was the first Canadian province to implement a deregulated electricity market. The market was established in 1996, following the adoption of the Electric Utility Act, the year before. Local distribution utilities, either investor- or municipally owned, retained the obligation to supply and the 6 largest utilities were assigned a share of the output of existing generators at a fixed price. The province moved to full retail access in 2001 and a spot market, under the Alberta Electric System Operator, was established in 2003. After consumers complained about high prices in 2000, the government implemented a Regulated Rate Option (RRO), as a means to shield consumers from price volatility.[1]
The generation sector in Alberta is dominated by TransAlta, ENMAX, and Capital Power Corporation, a spin-off of Edmonton's municipally owned company EPCOR. Although 5,700 MW of new generation was added and 1,470 of old plants were retired between 1998 and 2009,[39] coal still accounted for 73.8% of utility-generated power in 2007, followed by natural gas, with 20.6%.[40]
Installed capacity reached 12,834 MW in 2009, with coal (5,692 MW) and natural gas (5,189 MW) representing the bulk of the province's generation fleet. Recent additions to the grid have increased wind capacity to 657 MW, while hydroelectric capacity stands at 900 MW.[39] Despite tougher new emission measures announced by the federal government in June 2010, industry officials believe the province will continue using coal to generate electricity into 2050.[41] Syncrude's Mildred Lake and Aurora North Plant Sites, the coal fired Sundance Power Station and the coal fired Genesee Generating Station are the top three sources of greenhouse gases in Canada.[42]

BC Hydro was created in 1961 when the government of British Columbia, under Premier W. A. C. Bennett, passed the BC Hydro Act. This act led to the amalgamation of BC Electric Company and the BC Power Commission, and the creation of the British Columbia Hydro and Power Authority (BCHPA).[43] BC Hydro is the main electric distributor, serving 1.8 million customers in most areas,[44] with the exception of the Kootenay region, where FortisBC, a subsidiary of Fortis Inc. directly provides electric service to 111,000 customers and supplies municipally owned utilities in the same area.[45]
Between 1960 and 1984, BC Hydro completed six large hydro-electric generating projects, including the 2,730 MW W. A. C. Bennett Dam and Gordon M. Shrum Generating Station and Peace Canyon on the Peace River, Mica and Revelstoke on the Columbia River, Kootenay Canal on the Kootenay River and Seven Mile Dam, on the Pend d'Oreille River.
A third dam and 900 MW generating station on the Peace River, the Site C dam near Fort St. John, has been discussed for decades and was rejected in the early 1990s.[46] In April 2010, the British Columbia government announced moving the project to a regulatory review phase.[47] A notice of Site C construction commencing in 2015 was issued July 2015.[48] Revelstoke Dam built in 1984 was the last new dam built by BC Hydro.
The province's Liberal government has promoted the construction of a slew of small-scale hydro projects by private businesses. As of April 2010, 63 long-term power purchase agreements have been signed with Independent Power Producers for 2,629 MW of capacity and 10.3 TWh of energy.[49]
In 2015 Hydropower made up 87% of total generation, the rest being biomass, wind and some natural gas.[50]
BC Hydro via Powerex trades electricity eastward with Alberta and south to all of the western US through the Pacific-Intertie. In 2014 BC had the largest volume of electricity imports in Canada (9700 Mwh), from the Western Interconnection in the US which is 60% fossil fueled.[50][51] BC Hydro typically imports power during off-peak hours when thermal plants in the US and Alberta have excess power for sale, Then exports hydropower during peak hours when prices are higher.[52]

Manitoba Hydro is the crown corporation in charge of electricity generation, transmission and distribution in Manitoba. Its installed capacity stands, as of 2015, at 5,701 MW, mostly generated at 15 hydroelectricity generation stations on the Nelson, Saskatchewan, Laurie and the Winnipeg Rivers.[53]
The company has completed the 200-MW Wuskwatim hydroelectric project in partnership with the Nisichawayasihk Cree Nation, with first power from the project in June 2012. By advancing the completion date of the project by 3 years, Manitoba Hydro hopes to cash in on lucrative exports in the Midwestern United States.[54] The utility is currently building a new 695 MW station at Keeyask on the Nelson River, expecting completion in 2019.[55]
The utility is also planning the construction of a third HVDC power line linking northern Manitoba and the Winnipeg area. The Bipole III project involves the construction of a 1,364 km power line and two new converter stations.[56] With Keeyask under construction, Manitoba Hydro has also undertaken studies of one more large hydroelectric project, the Conawapa generation station.[54]

New Brunswick has a diversified generation mix, featuring fossil fuel, hydroelectric and nuclear capacity. Established in 1920, the provincial utility, NB Power owned 3,297 MW of installed capacity as of March 31, 2008.[58] Since then, the company retired 2 power plants and plans to permanently shut down the 300-MW oil-fired Dalhousie generating station.[59]
In the last decade, the government-owned utility has faced problems with the failure of a plan to switch two of its large thermal facilities to Orimulsion, a heavy bitumen fuel produced by PDVSA, the Venezuelan government oil company, and a 2-year delay in the mid-life refit of the Point Lepreau Nuclear Generating Station.[60]
In October 2009, the provincial government signed a memorandum of understanding with Quebec to sell most of NB Power's assets to Hydro-Québec. The controversial deal was cancelled in March 2010.[61][62]
Since then, a couple of options are discussed to modernize New Brunswick electricity infrastructure, including a plan to build a 500-MW intertie with Nova Scotia[63] and a preliminary agreement with France's Areva to evaluate the feasibility of a second nuclear generating station at the Point Lepreau site.[64] However, the nuclear expansion plan was shelved within hours of the election of a Progressive Conservative government led by David Alward in September 2010.[65]

Newfoundland and Labrador Hydro, a subsidiary of government-owned Nalcor Energy, has an installed generating capacity of 7289 MW and is the fourth largest of all utility companies in Canada. It owns and operates most generation in the province, the transmission grid and sells directly to large industrial customers. The company also serves remote communities not connected to the main power grids, on Newfoundland and in Labrador.
Newfoundland Power, a subsidiary of St. John's-based Fortis Inc., is a regulated distributor serving 239,000 customers, making up 85% of all electricity consumers in the province. The company buys 90% of its energy from Newfoundland and Labrador Hydro.[66]
Newfoundland and Labrador mainly relies on hydropower for its generation needs, supplemented by the 500-MW Holyrood Thermal Generating Station, near St. John's. The province's main power station, the 5,428-MW Churchill Falls Generating Station, was commissioned between 1971 and 1974. The generating station is owned by the Churchill Falls Labrador Corporation Limited, a joint venture between Newfoundland and Labrador Hydro (65.8%) and Hydro-Québec (34.2%). Most of the output of the plant is sold at a fixed price to the Quebec utility under a 65-year power purchase agreement due to expire in 2041.[67][68]
The Lower Churchill Project is a planned hydroelectric project in Labrador, to develop the remaining 35 per cent of the Churchill River that has not already been developed by the Churchill Falls Generating Station. The Lower Churchill's two installations at Gull Island and Muskrat Falls will have a combined capacity of over 3,074 MW and have the ability to provide 16.7 TWh of electricity per year. The Muskrat Falls Generation Facility will consist of a dam, a spillway, and a powerhouse with four Kaplan turbines and a total generating capacity of 824 MW. Construction of the Muskrat Falls Generation Facility began in 2013 and is expected to be complete in 2019.[69]

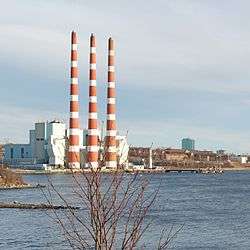
Nova Scotia Power Inc. (NSPI), a subsidiary of Halifax-based Emera, is the public utility in charge of the generation, transmission and distribution of electricity in Nova Scotia. Formerly a government-owned company, it was privatized in 1992 by the conservative government of premier Donald Cameron, in what was called at the time the biggest initial public offering (IPO) in Canadian history.[70] From the $816 million proceeds, "$616 million was used to recapitalize Nova Scotia Power by paying down debt owed by the utility".[71]
NS Power has a generating capacity of 2,293 MW:[70] 5 thermal plants fired with a mix of coal, petroleum coke, fuel oil and natural gas, provide the bulk of the 13 TWh yearly supply. The company also operates the Annapolis Royal Tidal Generating Station, the only one of its kind in North America and 33 hydroelectric generating stations,[70] most of them small ones, with the exception of the 230 MW Wreck Cove Generating Station,[72] inaugurated in 1978.[70]
Over the years, NS Power has been blamed by Nova Scotia residents for its poor maintenance record and its failure to quickly reconnect customers after storms.[73] In September 2003, 700,000 Nova Scotia residents were without power for up to two weeks after the passage of Hurricane Juan.[74] The Category 2 storm damaged 27 main transmission lines, several transmission towers, 117 distribution feeders, and 31 major electrical substations.[75] More recently, the issue of the company's investment in the provincial grid has been raised at a leaders' debate during the 2009 election campaign.[76] The company received praise from premier Darrell Dexter for its efforts in restoring power after the passage of Hurricane Earl in September 2010.[77]
For information on the small utility cooperative of Riverport and public utility electric distributors (of Lunenburg, Mahone Bay, Antigonish, Berwick and Canso) see those towns' main articles. For information on their cooperative see Municipal Electric Utilities of Nova Scotia.

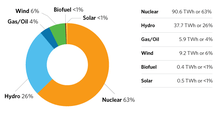
Electricity is generated in Ontario from nuclear power, hydroelectric power, natural gas[78] and renewables such as wind, solar and biomass. Total production in 2017 was 132.1 TWh (i.e. 132.1 billion kWh.)[79] The various sources of generation used in 2017 are shown in the pie chart to the right. In April 2014, Ontario eliminated coal as a source of electricity generation.[6][7] The generation mix for the current hour can be viewed at the Independent Electricity System Operator (IESO) webpage.
As noted above, total electricity production in Ontario 2017 was 132.1 TWh. Adding imports of 6.6 TWh and subtracting exports of 19.1 TWh[80] leaves 119.6 TWh usage within Ontario. With an estimated 2017 population of 14,193,384,[81] electricity usage per person in Ontario in 2017 was 9,307 kWh per year, or about 60% of the Canadian average shown in the table Electricity per person and by power source displayed earlier in this article. (Note that this number includes all use—commercial, industrial and institutional use as well as household use—and it is at the point of production, i.e. before subtracting transmission and distribution losses.) Usage per person in Ontario may be lower than the national average because natural gas is more widely available and has a significant cost advantage for heating.
Ontario has been considered a summer peaking grid since 2000,[82] however due to particularly cold winter temperatures and moderate summer temperatures, Ontario was winter peaking in 2014.[83] In its 18-Month Outlook issued September 2014, the Independent Electricity System Operator (IESO) predicts a winter 2014–2015 peak of 22,149 MW under a normal weather scenario, and a summer 2015 peak of 22,808 MW, also under a normal weather scenario.[84] The all-time record for Ontario demand was set on August 1, 2006, when peak demand for electricity reached 27,005 megawatts.[85] (See 2006 North American heat wave.)
Overall, Ontario is a net exporter of electricity. Ontario imports electricity, primarily from its neighbouring provinces of Quebec and Manitoba (both of which are primarily hydroelectric systems), and exports electricity, primarily to Michigan and New York State,[80] which rely heavily on fossil fuels—coal in the case of Michigan,[86] and natural gas in the case of New York.[87]
In 2017, Ontario's gross exports were 19.1 TWh,[80] i.e. roughly equal to half its hydro generation of 37.7 TWh in 2017.[79] (Although Canada is the world's third-largest producer of natural gas,[88] Ontario imports natural gas from the United States and from western Canada.) If all the carbon emissions associated with natural gas-fueled generation were allocated to the exports, almost all the electricity consumed within Ontario would be from non-carbon or carbon neutral sources. (Note however that the natural gas generation is not necessarily coincident with exports and natural gas plants sometimes need to be operated due to regional transmission constraints, and as backup for wind generation[89] which is intermittent and somewhat unpredictable.)
Ontario embraced nuclear power in the 1970s and 1980s, building 3 major nuclear facilities and 18 CANDU reactors, which in 2013 provided 59% of the province's electricity production, or kilowatt-hours equal to 65% of the electricity consumed within the province. The completion of the Darlington Nuclear Generating Station in 1993, "at a cost several times the original estimates", caused huge rate increases and a reassessment of Ontario's electricity policy. Three major policy documents, the Advisory Committee on Competition in Ontario’s Electricity System (1996), chaired by former federal minister Donald Macdonald, a government White Paper on electricity policy (1997) and the Market Design Committee report (1999) paved the way for a major overhaul of the industry.[1]
In April 1999, Ontario Hydro was split into five successor companies: Ontario Power Generation (OPG), in charge of generation; Hydro One, a transmission and distribution utility; the Independent Market Operator, responsible for the operation of a deregulated wholesale electric market in the province; the Electrical Safety Authority and the Ontario Electricity Financial Corporation, in charge of the $38.1 billion stranded debt, derivatives and other liabilities of the former integrated public utility.[90]
In 2001, OPG leased Canada's largest power plant, the Bruce Nuclear Generating Station to Bruce Power, a private consortium originally led by British Energy, reducing its share of the provincial generation market to 70%. The government opened the competitive market on May 1, 2002, but heat waves and droughts in the summer of 2002 caused wholesale prices to soar to peaks of $4.71/kWh in July and $10.28/kWh in September. Faced with bitter complaints from consumers, the Ernie Eves government announced a price freeze for small customers while leaving the wholesale market intact, on November 11, 2002.[1]
Although Eves was praised for the pause in generation market deregulation the cancellation of Hydro One's initial public offering and his handling of the 2003 North American blackout, the Progressive Conservatives were defeated by Dalton McGuinty's Liberals in the provincial election of 2003. In the meantime, the phasing out of coal-fired generation — including North America's largest coal plant, the 3,640-MW Nanticoke Generating Station — became a political issue. In 2002, the Conservatives promised to shut down Ontario's 5 coal plants by 2015, while McGuinty committed to a 2007 retirement date, which was pushed back to 2014.[91]
In April 2009, the Ontario legislature passed the Green Energy Act establishing feed-in tariffs for power from renewable sources and streamlining the approval process for new generation sites.[92] Two months after passing the bill, Ontario announced the suspension of a competitive process for the purchase of 2 new nuclear reactors at Darlington, citing the price tag, later evaluated at $26 billion.[93] Critics of the government strategy stress the Act will increase the price of electricity and undermine the system's reliability,[94] while pitting some local residents against wind developers.[95]
The impact of the Act has been notable in terms of the price impact on end consumers. Since 2009, electricity prices have risen by 95% for homeowners and by 115% for small businesses in the province of Ontario.[96]
As of June 2018, Ontario's wind capacity stood at 4,412 MW.[97] As of 2010, Ontario's wind capacity represented more than a third of Canada's total.[98]

Prince Edward Island is the only Canadian province without a hydroelectric power station. The province is largely dependent on imported power from NB Power generation facilities in New Brunswick. Two submarine power lines provide more than 80% of the provincial load. Since the early 2000, the provincial government has promoted the province as a good place to set up wind farms.
Maritime Electric, a subsidiary of St. John's-based Fortis Inc., operates the integrated public utility serving most of the province, with the exception of the city of Summerside, which has been providing electric service to its residents since 1920. Both utilities own and operate diesel plants, used as peakers or during emergencies.
Electricity rates in Charlottetown are the highest of the 12 large Canadian cities surveyed by Hydro-Québec in its annual compendium of North American electricity rates. According to the document, a residential customer using 1,000 kWh per month would pay 17.29 cents/kWh, a rate two and a half times higher than the one paid by consumers in Montreal, Winnipeg or Vancouver.[38]
In November 2009, Premier Robert Ghiz hoped to reduce the price of electricity while limiting atmospheric emissions by opening talks with the government of Quebec for a long term supply agreement.[99][100] Negotiations, with Hydro-Québec, and other suppliers, including current supplier NB Power, are ongoing.[101][102]

The Quebec electricity sector is dominated by Canada's largest utility, government-owned Hydro-Québec. With an installed capacity of 36,810 MW, including 34,118 MW of hydropower, the utility generated and bought 203.2 TWh in 2009, almost one-third of all electricity generated in Canada. Benefiting from low generation costs, favorable interest rates and high export prices, Hydro-Québec paid $10 billion in dividends to the Quebec government between 2005 and 2009.[68]
Since 2003, the company commissioned 8 new hydroelectric generating stations for a total of 2,343 MW[103] and is currently building 6 new power plants: Eastmain-1-A (768 MW) and Sarcelle (150 MW) scheduled for 2012,[104] and 4 generating stations on the Romaine River (1,550 MW) to be commissioned between 2014 and 2020.[105] Hydro-Québec's latest strategic plan, released in 2009, outline a further 3,500 MW of new generation capacity, including 3,000 MW of additional hydro projects, to be built by 2035. The company's total investments in generation, transmission, distribution and energy efficiency for the 2009–2013 timeframe are expected to reach $25.1 billion.[106]
Quebec also intends to increase its wind generation capacity. The government's 2006 energy strategy calls for the construction of 3,500 MW by 2015.[107] Two calls for tenders initiated in 2003 and 2005 resulted in the signing of 22 20-year Power Purchase Agreements between Hydro-Québec and independent power producers, for a total capacity of 2,990 MW.[108] A third one, geared at small-scale community- or First Nations-led projects, is expected to be completed by the end of 2010.[109] The province got 99% of its electricity from renewable sources in 2013.[110]

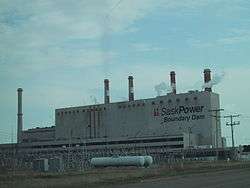
In 2007, Saskatchewan produced 12,362 GWh of electricity through its coal-fired power plants, on a total generation of 20,278 GWh. SaskPower, the government-owned public utility is the main power generator in the province. The company has a generating capacity of 3,371 MW and 17 generating facilities. These include three coal-fired baseload facilities (1682 MW), five natural gas-fired plants (674 MW), seven hydroelectric developments (854 MW), and two wind farms (161 MW). Two independent power producers, the Cory and Meridian cogeneration stations have a combined capacity of 438 MW, while 5 waste heat facilities have a maximum output of 31 MW.[111]
The current state of the electric system will require heavy investments in the next decade. Discussion have been undertaken with Manitoba about building a 138-kV interconnection between the two neighbouring provinces.[112] A new privately owned natural gas-fired combined-cycle generation turbine in North Battleford is under construction. The 260-MW facility is expected to be completed in 2013.[113]

Yukon Energy Corporation is the crown corporation that generates most of the power consumed in Yukon. Hydro is the main generation source, with a 93.2% share in 2007. It is supplemented by a wind turbine in Whitehorse and diesel generators in remote communities. Yukon has two separate grids. Neither are connected to the continental power grid. Yukon Electrical Company is the main distributor in Yukon.
In its Energy Strategy, released in 2009, the Yukon government has stated it wants to increase the supply of renewable energy, hydro and wind, by 20%. The government is also considering linking Yukon's two main power grids by completing the Carmacks to Stewart transmission line. No timetable has been set.[114]

Although the Northwest Territories are not connected to the North American power grid, there are two electric networks operating in the territory, the first one in the Yellowknife area and the other in Fort Smith. In most communities, loads are served by local diesel generators. The government-owned Northwest Territories Power Corporation is in charge of power generation, while Northland Utilities, a subsidiary of ATCO, operate the distribution networks.

The government-owned Qulliq Energy Corporation is the only power generator serving the remote communities of Nunavut. Qulliq, operating under the name Nunavut Power, has a total of 27 diesel-powered generators, serving 25 communities. The territory is not connected to the North American power grid.
Qulliq Energy plans to build a small hydroelectric project at Jaynes Inlet, not far from the territorial capital, Iqaluit, which is currently served by two diesel generators. The 5-MW generating station, which could cost upwards of $200 million, has been delayed by lower oil prices and the financial crisis. Construction could start in 2015 or 2016.[115]
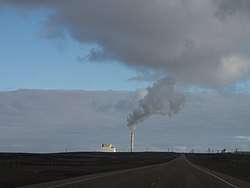
Climate change
in 2013, electricity generation was responsible for 105 Mt of carbon dioxide emissions, 20% of the nation's total, second only to transport at 32%. This represents a 18% reduction since 2005.[116]
While Canada reduces the carbon footprint in the US by exporting 10% of total hydroelectricity, more than half of all Canadian homes and businesses burn natural gas for heat.[117] Hydro power, nuclear power and wind generate 80% of Canada's electricity, coal and natural gas are burned for the remaining 20%.[118]
British Columbia which borders Alberta has undeveloped micro hydro potential of 5000 GWh.[119] As of 2008, Alberta's electricity sector was the most carbon-intensive of all Canadian provinces and territories, with total emissions of 55.9 million tonnes of CO
2 equivalent in 2008, accounting for 47% of all Canadian emissions in the electricity and heat generation sector. It is followed by Ontario (27.4 Mt CO
2 eq.), Saskatchewan (15.4 Mt CO
2 eq.) and Nova Scotia (9.4 Mt CO
2 eq.).[120] Of all provinces, Quebec has the lowest carbon intensity in the electricity sector with 2.45 g of CO
2 eq. per kWh of electricity generated.
Ontario registered a large drop in emissions in 2008, due to lower demand, natural gas prices and government instructions to Ontario Power Generation regarding a gradual decommissioning of coal-fired generation by 2014.[121] According to the Independent Electricity System Operator of Ontario, 4,700 MW of new natural gas-fired generation and 1,100 MW of wind farms have been commissioned in the province between 2003 and 2009. The new natural gas capacity will allow Ontario to retire 2 units each at the Nanticoke and Lambton generating stations by the end of 2010, on track for a complete phase-out by the end of 2014.[122]
In Alberta, TransAlta and Capital Power Corporation have undertaken the construction of a carbon capture and storage project at the 450-MW Keephills-3 supercritical sub-bituminous coal-fired power station. The project, which received a $770 million grant from the federal and provincial governments, involves storing the captured CO
2 through geological sequestration and enhanced oil recovery. It is scheduled to be operational by 2015.[123] In March 2010, SaskPower has announced its own carbon sequestration project at the Boundary Dam Power Station,[124] the province's largest coal plant. In British Columbia, the provincial government ordered BC Hydro to remove the 50-year-old gas-fired Burrard Generating Station from its roster of baseload plants.[125]
| Province/Territory | 1990 | 2004 | 2005 | 2006 | 2007 | 2008 |
|---|---|---|---|---|---|---|
| kilotonnes CO 2 equivalent | ||||||
| Newfoundland and Labrador | 1,630 | 1,450 | 1,230 | 795 | 1,230 | 1,040 |
| Prince Edward Island | 103 | 18 | 12 | 8 | - | - |
| Nova Scotia | 6,840 | 9,990 | 9,360 | 8,680 | 9,140 | 9,420 |
| New Brunswick | 6,130 | 8,690 | 8,630 | 7,060 | 7,310 | 6,830 |
| Quebec | 1,520 | 1,660 | 727 | 918 | 2,180 | 470 |
| Ontario | 26,600 | 32,300 | 34,300 | 28,600 | 32,000 | 27,400 |
| Manitoba | 569 | 393 | 511 | 382 | 497 | 488 |
| Saskatchewan | 10,400 | 16,800 | 15,500 | 14,900 | 15,700 | 15,400 |
| Alberta | 40,200 | 53,400 | 52,600 | 53,900 | 55,400 | 55,900 |
| British Columbia | 1,180 | 1,870 | 1,480 | 1,540 | 1,460 | 1,520 |
| Yukon | 94 | 8 | 8 | 8 | 11 | - |
| Northwest Territories | 222 | 264 | 282 | 222 | 256 | - |
| Nunavut | 91 | 45 | 35 | 54 | 35 | 48 |
| Canada | 95,500 | 127,000 | 125,000 | 117,000 | 125,000 | 119,000 |
International trade
Some provincial hydro companies benefited a great deal from the liberalization of the United States electricity sector brought by the Energy Policy Act of 1992 and the Federal Energy Regulatory Commission's Order 888. New Brunswick, Manitoba, Ontario and Quebec have been net exporters while BC Hydro has created an energy marketing subsidiary to actively trade on the neighbouring electricity market.
In 2009, Canada exported more than 53 TWh of electricity — approximately 9% of its output — to its southern neighbour the United States, while it imported 18 TWh.[126] While occupying a relatively small part of the overall U.S. market, Canadian supplies constitute a significant share of the power consumed in key markets, such as New England, New York State, Ohio, Michigan, Minnesota and the Pacific Northwest.
In August 2010, Hydro-Québec signed a 26-year renewal of its 225-MW power contract with the largest Vermont public utilities, Central Vermont Public Service and Green Mountain Power.[127] To facilitate the deal, a new renewable energy law, H.781,[128] was signed into law by governor Jim Douglas on June 4, 2010, after passage in both houses of the Vermont Legislature. The Act makes Vermont the first U.S. state to declare large-scale hydroelectric power as "a renewable energy resource".[129]
| Province | 2011[130] | 2010[130] | 2009[126] | 2008[131] | 2007[132] | 2006[133] | ||||||
|---|---|---|---|---|---|---|---|---|---|---|---|---|
| from the U.S. | to the U.S. | from the U.S. | to the U.S. | from the U.S. | to the U.S. | from the U.S. | to the U.S. | from the U.S. | to the U.S. | from the U.S. | to the U.S. | |
| GWh | ||||||||||||
| Alberta | 991 | 41 | 464 | 253 | 662 | 216 | 761 | 228 | 651 | 247 | 209 | 67 |
| British Columbia | 9,999 | 9,955 | 10,124 | 5,671 | 11,275 | 6,943 | 11,514 | 8,081 | 7,202 | 10,323 | 12,209 | 5,174 |
| Manitoba | 139 | 9,344 | 296 | 9,070 | 224 | 9,262 | 88 | 9,880 | 528 | 11,063 | 819 | 12,312 |
| New Brunswick | 585 | 1,056 | 844 | 1,030 | 1,408 | 1,904 | 1,081 | 1,367 | 646 | 1,598 | 511 | 2,058 |
| Nova Scotia | 146 | — | 205 | 4 | — | — | 273 | 13 | 25 | 13 | 25 | 229 |
| Ontario | 1,764 | 11,066 | 3,601 | 11,208 | 3,328 | 16,180 | 7,998 | 18,571 | 6,908 | 10,365 | 6,353 | 9,059 |
| Quebec | 443 | 19,879 | 2,502 | 17,011 | 1,057 | 18,637 | 1,352 | 17,455 | 3,359 | 16,101 | 2,535 | 11,713 |
| Saskatchewan | 321 | 991 | 414 | 464 | 334 | 110 | 432 | 137 | 203 | 392 | 1,147 | 595 |
| Canada | 14,387 | 51,341 | 18,449 | 44,373 | 18,288 | 53,252 | 23,499 | 55,732 | 19,522 | 50,102 | 23,808 | 41,207 |
Further reading
- Bolduc, André; Hogue, Clarence; Larouche, Daniel (1989). Québec : l'héritage d'un siècle d'électricité (in French) (3rd ed.). Montreal: Libre Expression/Forces. ISBN 2-89111-388-8.
- Bothwell, Robert (1988). Nucleus, the history of Atomic Energy of Canada. Toronto: University of Toronto Press. ISBN 0-8020-2670-2.
- Canadian Nuclear Association (2011). 2011 Canadian Nuclear Factbook (PDF). Ottawa: Canadian Nuclear Association.
- Dales, John H. (1957). Hydroelectricity and Industrial Development Quebec 1898–1940. Cambridge, MA: Harvard University Press.
- Froschauer, Karl (1999). White Gold: Hydroelectric Power in Canada. Vancouver: UBC Press. ISBN 0-7748-0708-3.
- International Energy Agency (2009). Energy Policies of IEA Countries - Canada 2009 Review. Paris: OECD/IEA. ISBN 978-92-64-06043-2.
- Negru, John (1990). The electric century : an illustrated history of electricity in Canada : the Canadian Electrical Association, 1891–1991. Montreal: Canadian Electrical Association. ISBN 2-9802153-0-9.
- Norrie, Kenneth; Owram, Douglas; Emery, J. C. Herbert (2008). A History of the Canadian Economy (4th ed.). Toronto: Nelson. ISBN 978-0-17-625250-2.
- Regehr, Theodore David (1990). The Beauharnois scandal: a story of Canadian entrepreneurship and politics. Toronto: University of Toronto Press. ISBN 0-8020-2629-X.
- Statistics Canada (April 2009). Electric Power Generation, Transmission and Distribution (catalog number: 57-202-X) (PDF). Ottawa: Statistics Canada. ISSN 1703-2636.
- Statistics Canada (February 2010). Report on Energy Supply and Demand in Canada (catalog number: 57-003-X) (PDF). Ottawa: Statistics Canada. ISSN 1708-1599.
- L'Ère électrique – The Electric Age from PUO - Publications en libre accès // UOP - Open access publications.
Notes
- ↑ A detailed breakdown for industrial generation by fuel source is not available.
References
- 1 2 3 4 Deewes, Donald N. (9–10 September 2005), "Electricity Restructuring and Regulation in the Provinces: Ontario and Beyond" (PDF), Energy, Sustainability and Integration. The CCGES Transatlantic Energy Conference, Toronto, retrieved 2010-09-06
- ↑ International Energy Agency 2009, p. 191
- 1 2 Statistics Canada 2009, p. 11
- ↑ International Energy Agency, Key World Energy Statistics 2010 (PDF), Paris: IEA/OECD, p. 19, retrieved 2010-09-07
- ↑ "Top 10 Nuclear Generating Countries [2013]". Nuclear Energy Institute. Retrieved 4 October 2014.
- 1 2 "Thunder Bay Generating Station stops burning coal". CBC/Radio-Canada. April 15, 2014. Retrieved 4 October 2014.
- 1 2 "2014 Summer Reliability Assessment" (PDF). North American Electric Reliability Corporation (NERC). May 2014. p. 21. Retrieved 5 October 2014.
In April 2014, Thunder Bay Generating Station burned its last supply of coal. As a result, Ontario is now the first jurisdiction in North America to fully eliminate coal as a source of electricity generation.
- ↑ Barber, Katherine, ed. (1998). The Canadian Oxford dictionary. Toronto; New York: Oxford University Press. p. 694. ISBN 0-19-541120-X.
- ↑ World Bank, Electric power consumption (kWh per capita), Washington, D.C.: World Bank, retrieved 2010-09-02
- ↑ Oberhuber, dirigé par Olivier Asselin, Silvestra Mariniello, Andrea; Mariniello, Silvestra; Oberhuber, Andrea (2011). L'ère électrique = The electric age. [Ottawa]: Presses de l'Université d'Ottawa. p. 316. ISBN 978-2-7603-0704-9. Retrieved 12 February 2015.
- 1 2 3 International Energy Agency 2009, pp. 193–195
- ↑ Nova Scotia, Nova Scotia Power Privatization Act. 1992, c. 8, Halifax: Nova Scotia House of Assembly, retrieved 2010-09-06
- ↑ National Energy Board (2010), Who we are & our governance, Calgary, retrieved 2010-09-07
- ↑ Canadian Nuclear Safety Commission (2010), About CNSC, archived from the original on 2010-02-10, retrieved 2010-09-07
- ↑ Blake, Cassels & Graydon LLP (March 2008), Overview of Electricity Regulation in Canada (PDF), archived from the original (PDF) on 2011-07-08, retrieved 2010-09-07
- ↑ Alcan (May 2005), Water Energy : The Management of Lac Saint-Jean (PDF), archived from the original (PDF) on 2011-07-07, retrieved 2010-08-23
- ↑ Rio Tinto Alcan, Power Operations/Watershed Management, retrieved 2010-08-27
- ↑ Independent Power Producers Association of British Columbia, Quick IPP Facts List, archived from the original on 2010-09-04, retrieved 2010-09-07
- ↑ Statistics Canada, Electric Power Generating Stations - Data Quality Statements (PDF), Ottawa: Statistics Canada, retrieved 2010-09-09
- 1 2 Statistics Canada, Installed generating capacity, by class of electricity producer, annual, Ottawa: Statistics Canada, retrieved 2013-01-02
- ↑ Canadian Electricity Association (2006), Power Generation in Canada: A Guide (PDF), Ottawa: Canadian Electricity Association, retrieved 2010-09-03
- ↑ https://www.iea.org/publications/freepublications/publication/EnergyPoliciesofIEACountriesCanada2015Review.pdf pg20
- 1 2 Statistics Canada, Table 127-0002 - Electric power generation, by class of electricity producer, monthly (megawatt hour), Ottawa: Statistics Canada, retrieved 2013-01-04
- 1 2 Statistics Canada, Table 127-0006 - Electricity generated from fuels, by electric utility thermal plants, annual (megawatt hour), Ottawa: Statistics Canada, retrieved 2013-01-04
- ↑ Statistics Canada 2009, p. 13
- ↑ Adams, Tom (30 October 2009). "Deal offers N.B. a life raft". Telegraph-Journal. Saint John, NB. p. A9. Retrieved 2009-10-30.
- ↑ Statistics Canada. Table 127-0009 - Installed generating capacity, by class of electricity producer, annual (kilowatts) (accessed: August 18, 2017)
- ↑ Energy in Sweden, Facts and figures, The Swedish Energy Agency, (in Swedish: Energiläget i siffror), Table: Specific electricity production per inhabitant with breakdown by power source (kWh/person), Source: IEA/OECD 2006 T23 Archived July 4, 2011, at the Wayback Machine., 2007 T25 Archived July 4, 2011, at the Wayback Machine., 2008 T26 Archived July 4, 2011, at the Wayback Machine., 2009 T25 Archived January 20, 2011, at the Wayback Machine. and 2010 T49 Archived October 16, 2013, at the Wayback Machine..
- 1 2 Energy in Sweden 2010, Facts and figures, Table49 Archived October 16, 2013, at the Wayback Machine..
- ↑ Energy in Sweden 2009, Facts and figures, 2009 Table 25 Archived January 20, 2011, at the Wayback Machine.
- ↑ International Energy Agency 2009, p. 204
- ↑ IEEE Global History Network, Milestones:First 735 kV AC Transmission System, 1965, retrieved 2010-09-02
- ↑ IEEE Global History Network, Milestones:Nelson River HVDC Transmission System, 1972, retrieved 2010-09-02
- ↑ https://www.iea.org/publications/freepublications/publication/EnergyPoliciesofIEACountriesCanada2015Review.pdf pg224
- ↑ Hamilton, Tyler (21 September 2009), "Hydro One to start major transmission projects", Toronto Star, retrieved 2010-09-03
- ↑ Alberta Electric System Operator (15 December 2008), Southern Alberta Transmission Reinforcement Needs Identification Document (PDF), archived from the original (PDF) on 10 June 2011, retrieved 2010-09-02
- ↑ Hydro-Québec (12 August 2010), Demande relative au projet d'intégration des parcs éoliens de l’appel d’offres A\O 2005-03 au réseau de transport d'Hydro-Québec (Docket R-3742-2010) (PDF), Montreal: Régie de l'énergie du Québec, archived from the original (PDF) on 6 July 2011
- 1 2 Hydro-Québec (October 2012), Comparison of Electricity Prices in Major North American Cities: Rates effective April 1, 2012 (PDF), Montreal, p. 20, ISBN 978-2-550-65827-6, retrieved 2013-01-04
- 1 2 Government of Alberta, Electricity Statistics, Energy Alberta, retrieved 2010-09-06
- ↑ Statistics Canada 2009, pp. 20–21
- ↑ O'Meara, Dina (23 June 2010), "Industry needs time to move from coal-fired power", Calgary Herald, Calgary, retrieved 2010-09-06
- ↑ http://maps-cartes.ec.gc.ca/indicators-indicateurs/TableView.aspx?ID=1&lang=en
- ↑ B.C. Hydro. Power Pioneers (1998). Gaslights to gigawatts : A human history of BC Hydro and its predecessors. Vancouver: Hurricane Press. p. 135. ISBN 0-9698845-2-4.
- ↑ BC Hydro (June 2010), Quick Facts for the Year Ended March 31, 2010 (PDF), archived from the original (PDF) on 2012-03-05, retrieved 2010-08-24
- ↑ FortisBC, Our Vision and Values, archived from the original on 2010-09-21, retrieved 2010-09-06
- ↑ Max Fawcett (April 9, 2010), "Must the 'Big Smoke' Always Have its Way?", The Tyee, Vancouver, retrieved 2010-09-06
- ↑ BC Hydro (April 19, 2010), Province announces Site C Clean Energy Project, BC Hydro, archived from the original on 2010-04-27, retrieved 2010-09-06
- ↑ https://www.sitecproject.com/sites/default/files/Notice%20of%20Construction%20Activities%20-%20July%202015.pdf
- ↑ BC Hydro (1 April 2010), Independent Power Producers (IPPs) currently supplying power to BC Hydro (PDF), archived from the original (PDF) on 2011-06-11, retrieved 2010-08-27
- 1 2 https://www.iea.org/publications/freepublications/publication/EnergyPoliciesofIEACountriesCanada2015Review.pdf
- ↑ https://www.wecc.biz/Reliability/2016%20SOTI%20Final.pdf
- ↑ http://web.uvic.ca/~kooten/documents/BCgeneratingSystem.pdf pg17
- ↑ http://www.hydro.mb.ca/corporate/facilities/generating_stations.shtml
- 1 2 Manitoba Hydro (2010), Building a Powerful Future: Manitoba Hydro-Electric Board 59th Annual Report For the Year Ended March 31, 2010 (PDF), Winnipeg: Manitoba Hydro, archived from the original (PDF) on 2011-07-28, retrieved 2010-09-03
- ↑ http://www.winnipegfreepress.com/local/Construction-of-Keeyask-generating-station-kicks-off-267382071.html Winnipeg Free Press, July 16, 2014
- ↑ Manitoba Hydro, Bipole III Project Description, retrieved 2010-09-03
- ↑ Weston, Greg (31 July 2010), "Wind power plan on track: Keir", Times & Transcript, Moncton, p. A5, archived from the original on 7 March 2012, retrieved 2010-08-01
- ↑ NB Power (2008), Annual report 2007–2008 (PDF), Fredericton, retrieved 2009-10-29
- ↑ CBC News (29 March 2010), "Dalhousie power plant's demise still looms: Death of NB Power deal may not save northern power plant", Canadian Broadcasting Corporation, retrieved 2010-09-03
- ↑ CBC News (6 August 2010), "N.B. nuclear plant another year behind schedule", Canadian Broadcasting Corporation, retrieved 2010-09-03
- ↑ CBC News (24 March 2010). "Quebec balked at NB Power sale costs". Canadian Broadcasting Corporation. Retrieved 2010-08-20.
- ↑ Corbeil, Michel (25 March 2010). "Entente avortée entre Hydro-Québec et Énergie NB: un mauvais calcul politique". Le Soleil (in French). Quebec City. Retrieved 2010-03-25.
- ↑ CBC News (20 July 2010), "New power line route explored by N.B., N.S.: 500-MW connection envisioned", Canadian Broadcasting Corporation, retrieved 2010-09-03
- ↑ CBC News (8 July 2010), "Areva, N.B. reveal nuclear plans: French company considers second N.B. reactor", Canadian Broadcasting Corporation, retrieved 2010-09-03
- ↑ Penty, Rebecca (29 September 2010). "Alward to shelve Areva deal". Telegraph-Journal. Saint John, NB. p. B1. Retrieved 2010-09-29.
- ↑ Newfoundland Power, Corporate Profile, archived from the original on 2012-09-05, retrieved 2010-09-06
- ↑ Nalcor Energy, Churchill Falls, retrieved 2010-08-24
- 1 2 Hydro-Québec (April 2010), Shaping The Future : Annual Report 2009 (PDF), Montreal, ISBN 978-2-550-58101-7, ISSN 0702-6706, retrieved 2010-04-08
- ↑ "Lower Churchill Project". Nalcor Energy. Retrieved June 8, 2013.
- 1 2 3 4 Nova Scotia Power, Quick facts about Nova Scotia Power, NSPI, archived from the original on 2009-09-25, retrieved 2010-09-05
- ↑ Levac, Mylène; Woorbridge, Philip (Summer 1997), "The fiscal impact of privatization in Canada" (PDF), Bank of Canada Review, Ottawa: Bank of Canada, pp. 25–40
- ↑ New Brunswick System Operator; Nova Scotia Power; Maritime Electric; Northern Maine ISA (2008), NPCC 2007 Maritimes Area Comprehensive Review of Resource Adequacy, NPCC, p. 18, archived from the original on 2011-07-27
- ↑ CBC News (15 November 2004), "Residents blast Nova Scotia Power after storm leaves thousands in dark", Canadian Broadcasting Corporation, retrieved 2010-09-06
- ↑ Chris Fogarty (2003). "Hurricane Juan Storm Summary" (PDF). Canadian Hurricane Centre/Environment Canada. Retrieved 2006-11-20.
- ↑ "Climate SMART: Be cool, reduce global warming, pollution and climate risks". Halifax Regional Municipality. 2003. Archived from the original on 2013-12-26. Retrieved 2010-09-06.
- ↑ CBC News (3 June 2009), "Make power utility reinvest in province: Liberal leader", Canadian Broadcasting Corporation, retrieved 2010-09-06
- ↑ CBC News (6 September 2010), "Nova Scotia tries to get power on after Earl", Canadian Broadcasting Corporation, retrieved 2010-09-06
- ↑ "Ontario's Energy Sector: The Electricity Sector". Ontario Energy Board. Retrieved 4 October 2014.
- 1 2 "IESO Supply Overview". IESO. Retrieved 5 October 2014.
- 1 2 3 "IESO Backgrounder - Imports and Exports". IESO. Retrieved 5 October 2014.
- ↑ "Population by year, by province and territory". Statistics Canada (Government of Canada). Retrieved 5 October 2014.
- ↑ "Wind and the Electrical Grid: Mitigating the Rise in Electricity Rates and Greenhouse Gas Emissions" (PDF). Ontario Society of Professional Engineers (OSPE). 14 March 2012. p. 8.
Ontario has been a summer peaking grid since 2000 mainly due to the growth in air conditioning.
- ↑ "Demand Overview: Hourly Ontario and Market Demands, year-to-date [2014]". IESO. Retrieved 5 October 2014.
- ↑ "18-Month Outlook" (PDF). Independent Electricity System Operator (IESO). 4 September 2014. Retrieved 5 October 2014.
- ↑ "Demand Overview: Electricity Demand Records". IESO. Retrieved 5 October 2014.
- ↑ "Michigan: State Profile and Energy Estimates". U.S. Department of Energy, Energy Information Administration. Retrieved 6 October 2014.
- ↑ "New York: State Profile and Energy Estimates". U.S. Department of Energy, Energy Information Administration. Retrieved 6 October 2014.
- ↑ "Additional Statistics on Energy: Table 5. Energy facts [2010]". Natural Resources Canada (Government of Canada). Retrieved 5 October 2014.
- ↑ "In Ontario, electricity bills are reason to weep". The Globe and Mail. 12 September 2013. Retrieved 5 October 2014.
the province is relying more on another fossil fuel, natural gas, to back up unpredictable wind and solar.
- ↑ Ontario Electricity Financial Corporation (2000), Annual Report 1999–2000 (PDF), Toronto: Ontario Electricity Financial Corporation, p. 6, retrieved 2010-09-06
- ↑ Wilson, Jennifer (25 September 2007), "Ontario's power crunch: What's the answer?", CBC News, retrieved 2010-09-06
- ↑ Government of Ontario (2009), Ontario's Green Energy Act: Our Path to a Green Economy, Ministry of Energy and Infrastructure, retrieved 2010-09-06
- ↑ Hamilton, Tyler (14 July 2009), "$26B cost killed nuclear bid", Toronto Star, Toronto, retrieved 2010-09-06
- ↑ McCarthy, Shawn (9 April 2010), "Ontario green power plan sparks cost concerns", The Globe and Mail, Toronto, retrieved 2010-09-06
- ↑ Mehler Paperny, Anna (1 August 2010), "Green energy project gives cottage country the blues", The Globe and Mail, Toronto, retrieved 2010-09-06
- ↑ "How to Save Money on Energy in Ontario". EnPowered. 25 April 2016.
- ↑ "IESO Supply Overview: Ontario's installed generation capacity". Retrieved 4 October 2014.
- ↑ Canadian Wind Energy Association (September 2010), Canada's Current Wind Capacity (PDF), retrieved 2010-09-06
- ↑ Thibodeau, Wayne (14 November 2009), "P.E.I. looks to Quebec for cheaper electricity", The Guardian, Charlottetown, archived from the original on 14 September 2012, retrieved 2009-11-15
- ↑ Schaëffner, Yves (13 November 2009), "Énergie : le Québec vise l'Île du Prince-Édouard", La Presse, archived from the original on 15 November 2009, retrieved 2009-11-13
- ↑ Casey, Quentin (9 September 2010), "P.E.I. in pursuit of cheaper power", Telegraph-Journal, Saint John, NB, p. B1, retrieved 2010-09-09
- ↑ Casey, Quentin (10 September 2010), "It's a good time to seek cheap rates: ex-regulator", Telegraph-Journal, Saint John, NB, retrieved 2010-09-10
- ↑ Hydro-Québec Production (2010), Hydroelectric Generating Stations (as of December 31, 2009), Hydro-Québec, retrieved 2010-08-21
- ↑ Hydro-Québec, "Project Description", Eastmain-1-A/Sarcelle/Rupert Project, retrieved 2010-09-03
- ↑ Hydro-Québec, "En bref", Projet de la Romaine (in French), retrieved 2010-09-03
- ↑ Hydro-Québec (July 2009), Strategic Plan 2009–2013: Energy efficiency, renewable energies and technological innovation (PDF), Montreal, pp. 22–23, ISBN 978-2-550-56207-8, retrieved 2010-09-03
- ↑ Government of Quebec (2006), Using energy to build the Québec of tomorrow (PDF), Quebec City: Quebec Department of Natural Resources and Wildlife, ISBN 2-550-46952-6, retrieved 2010-09-03
- ↑ Hydro-Québec, Electricity Supply Contracts by Technology, retrieved 2010-09-03
- ↑ Hydro-Québec (2010), Call for Tenders A/O 2009-02: Wind Power – 2 X 250 MW, archived from the original on 2010-09-25, retrieved 2010-09-03
- ↑ "Archived copy" (PDF). Archived from the original (PDF) on 2016-03-06. Retrieved 2016-01-29.
- ↑ SaskPower (2010), Securing tomorrow's energy begins today: SaskPower Annual Report 2009 (PDF), Regina: SaskPower, p. 95, archived from the original (PDF) on 2010-11-29
- ↑ Canadian Press (2 February 2010), "Sask., Man., to study inter-provincial energy sharing", Canadian Broadcasting Corporation, retrieved 2010-09-03
- ↑ Northland Power Income Fund (14 June 2010), North Battleford Energy Centre Project Breaks Ground at Official Ceremonies, retrieved 2010-09-03
- ↑ Yukon (January 2009), Energy Strategy for Yukon, Whitehorse: Yukon Government, ISBN 1-55362-402-5
- ↑ CBC News (19 March 2009), "Global financial crisis delays Iqaluit hydro dam project", Canadian Broadcasting Corporation, retrieved 2010-09-03
- ↑ https://www.iea.org/publications/freepublications/publication/EnergyPoliciesofIEACountriesCanada2015Review.pdf pg 42
- ↑ http://www.nrcan.gc.ca/energy/sources/natural-gas/17894
- ↑ http://www.nrcan.gc.ca/energy/electricity-infrastructure/about-electricity/7359
- ↑ https://www.bchydro.com/content/dam/hydro/medialib/internet/documents/environment/pdf/environment_microhydro_inventory_pdf.pdf page 63
- 1 2 Environment Canada (15 April 2010). National Inventory Report Greenhouse Gas Sources and Sinks in Canada 1990–2008 (3 volumes). UNFCCC.
- ↑ Government of Ontario (3 September 2009), Ontario's Coal Phase Out Plan, Ministry of Energy and Infrastructure, retrieved 2010-09-06
- ↑ Independent Electricity System Operator (December 2009), The Ontario reliability outlook (PDF), Toronto: IESO, retrieved 2010-09-08
- ↑ Canadian Electricity Association (2010), The Power of Innovation: Sustainable Electricity Annual Report 2009 (PDF), Ottawa, p. 7, retrieved 2010-09-08
- ↑ Government of Saskatchewan (3 March 2010), SaskPower Selects Carbon Capture Technology for Boundary Dam Project, archived from the original on 17 March 2010, retrieved 2010-09-08
- ↑ Simpson, Scott (30 October 2009), "Government clears way for greener power expansion", Vancouver Sun, Vancouver, archived from the original on 10 November 2012, retrieved June 30, 2011
- 1 2 National Energy Board (June 2010), Canadian Energy Overview 2009 - Energy Market Assessment (PDF), Calgary: National Energy Board, p. 37, retrieved 2010-09-06
- ↑ Remsen, Nancy (12 August 2010), "Vermont, Quebec seal power deal for electricity supply through 2038", Burlington Free Press, Burlington, VT, retrieved 2010-09-06
- ↑ State of Vermont (June 4, 2010). "An Act Relating to Renewable Energy". Vermont Legislature. Retrieved 2010-07-04.
- ↑ Barlow, Daniel (June 5, 2010). "For the last time, Gov. Douglas signs a bill into law". Times-Argus. Montpellier, VT. Archived from the original on 2016-01-11. Retrieved 2010-06-05.
- 1 2 Statistics Canada, Electric power generation, receipts, deliveries and availability of electricity, annual, Ottawa: Statistics Canada, retrieved 2013-01-04
- ↑ National Energy Board (May 2009), Canadian Energy Overview 2008 - Energy Market Assessment (PDF), Calgary: National Energy Board, p. 46, retrieved 2010-09-06
- ↑ National Energy Board (May 2008), Canadian Energy Overview 2007 - Energy Market Assessment (PDF), Calgary: National Energy Board, p. 37, retrieved 2010-09-06
- ↑ National Energy Board (May 2007), Canadian Energy Overview 2006 - Energy Market Assessment (PDF), Calgary: National Energy Board, p. 33, retrieved 2010-09-06