Electricity sector in the United Kingdom
| Data | |
|---|---|
| Electricity coverage | 100% (91.8% grid 2017[1]) |
| Continuity of supply | 99.9999% |
| Installed capacity | 85 GW (2014) [1] |
| Share of fossil energy | 47.1% (2017) |
| Share of renewable energy | 29.3% (2017)[1] |
| GHG emissions from electricity generation (2017) | 225 t CO2 per GWh |
| Average electricity use (2009) | 5,958 kWh/person |
| Transmission & Distribution losses (2017) | 7.5% |
| Institutions | |
| Responsibility for regulation | Office of Gas and Electricity Markets |
| Responsibility for policy-setting | Parliament of the United Kingdom |
| Electricity sector law | Electricity Act 1989 |
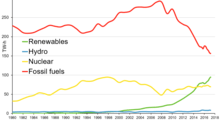
As of 2017 the electricity sector in the United Kingdom is powered by around 50% fossil fuelled power, roughly 20% nuclear power and 30% renewable power. Renewable power is showing strong growth, while fossil fuel generator use in general and coal use in particular is shrinking, with coal generators now mainly being run in winter due to pollution and costs.
In 2008 nuclear electricity production was 860 kWh pro person. In 2014, 28.1 TW·h of energy was generated by wind power, which contributed 9.3% of the UK's electricity requirement.[3] In 2015, 40.4 TW·h of energy was generated by wind power, and the quarterly generation record was set in the three-month period from October to December 2015, with 13% of the nation’s electricity demand met by wind.[4] Wind power contributed 15% of UK electricity generation in 2017 and 18.5% in the final quarter of 2017.[5]
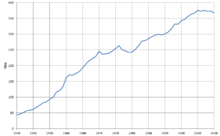
The United Kingdom voluntarily ended the use of incandescent lightbulbs in 2011. Between 2007 and 2012, the UK's peak electrical demand has fallen from 61.5 GW to 57.5 GW[6] The use of electricity declined 11% in 2009 compared to 2004 and respectively.
History

National grid
The first to use Nikola Tesla's three-phase high-voltage electric power distribution in the United Kingdom was Charles Merz, of the Merz & McLellan consulting partnership, at his Neptune Bank Power Station near Newcastle upon Tyne. This opened in 1901,[8] and by 1912 had developed into the largest integrated power system in Europe.[9] The rest of the country, however, continued to use a patchwork of small supply networks.
In 1925, the British government asked Lord Weir, a Glaswegian industrialist, to solve the problem of Britain's inefficient and fragmented electricity supply industry. Weir consulted Merz, and the result was the Electricity (Supply) Act 1926, which recommended that a "national gridiron" supply system be created.[10] The 1926 Act created the Central Electricity Board, which set up the UK's first synchronised, nationwide AC grid, running at 132 kV, 50 Hz.
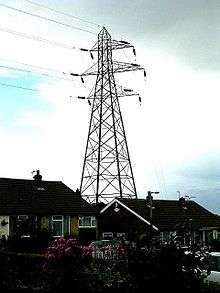
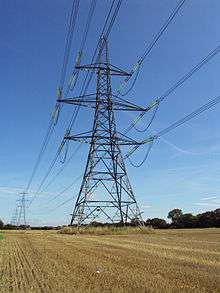
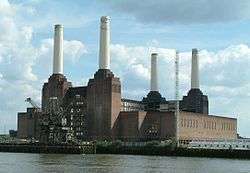
The grid was created with 4,000 miles of cables- mostly overhead cables, linking the 122 most efficient power stations. The first "grid tower" was erected near Edinburgh on 14 July 1928[11], and work was completed in September 1933, ahead of schedule and on budget.[12][13] It began operating in 1933 as a series of regional grids with auxiliary interconnections for emergency use. Following the unauthorised but successful short term parallelling of all regional grids by the night-time engineers on 29 October 1937,[14] by 1938 the grid was operating as a national system. The growth by then in the number of electricity users was the fastest in the world, rising from three quarters of a million in 1920 to nine million in 1938.[15] It proved its worth during the Blitz when South Wales provided power to replace lost output from Battersea and Fulham power stations.[15] The grid was nationalised by the Electricity Act 1947, which also created the British Electricity Authority. In 1949, the British Electricity Authority decided to upgrade the grid by adding 275 kV links.
At its inception in 1950, the 275 kV Transmission System was designed to form part of a national supply system with an anticipated total demand of 30,000 MW by 1970. The predicted demand was already exceeded by 1960. The rapid load growth led the Central Electricity Generating Board to carry out a study in 1960 of future transmission needs. The report was completed in September 1960, and its study is described in a paper presented to the Institution of Electrical Engineers by Messrs E.S. Booth, D. Clark, J.L. Egginton and J.S. Forrest in 1962.
Considered in the study, together with the increased demand, was the effect on the transmission system of the rapid advances in generator design resulting in projected power stations of 2,000–3,000 MW installed capacity. These new stations were mostly to be sited where advantage could be taken of a surplus of cheap low-grade fuel and adequate supplies of cooling water, but these situations did not coincide with the load centres. West Burton with 4 x 500 MW machines, sited at the Nottinghamshire coalfield near the River Trent, is a typical example. These developments shifted the emphasis on the transmission system, from interconnection to the primary function of bulk power transfers from the generation areas to the load centres, such as the anticipated transfer in 1970 of some 6,000 MW from The Midlands to the Home counties.
Continued reinforcement and extension of the existing 275 kV systems was examined as a possible solution. However, in addition to the technical problem of very high fault levels, many more lines would have been required to obtain the estimated transfers at 275 kV. As this was not consistent with the Central Electricity Generating Board's policy of preservation of amenities a further solution was sought. Consideration was given to both a 400 kV and 500 kV scheme as the alternatives, either of which gave a sufficient margin for future expansion. The decision in favour of a 400 kV system was made for two main reasons. Firstly the majority of the 275 kV lines could be uprated to 400 kV, and secondly it was envisaged that the operation at 400 kV could commence in 1965 compared with 1968 for a 500 kV scheme. Design work was started and in order to meet the programme for 1965 it was necessary for the contract engineering for the first projects to run concurrently with the design. One of these projects was the West Burton 400 kV Indoor Substation, the first section of which was commissioned in June 1965. From 1965, the grid was partly upgraded to 400 kV, beginning with a 150-mile (241 km) line from Sundon to West Burton, to become the Supergrid.
With the development of the national grid, the switch to using electricity, United Kingdom electricity consumption increased by around 150% between the post war nationalisation of the industry in 1948 and the mid-1960s. During the 1960s growth slowed as the market became saturated.
On the breakup of the Central Electricity Generating Board in 1990, the ownership and operation of the National Grid in England and Wales passed to National Grid Company plc, later to become National Grid Transco, and now National Grid plc. In Scotland the grid split into two separate entities, one for southern and central Scotland and the other for northern Scotland, connected by interconnectors to each other. The first is owned and maintained by SP Energy Networks, a subsidiary of Scottish Power, and the other by SSE. However, National Grid plc remains the System Operator for the whole UK Grid.
UK 'energy gap'

In the early years of the 2000s, concerns grew over the prospect of an 'energy gap' in United Kingdom generating capacity. This was forecast to arise because it was expected that a number of coal fired power stations would close due to being unable to meet the clean air requirements of the European Large Combustion Plant Directive (directive 2001/80/EC).[17] In addition, the United Kingdom's remaining Magnox nuclear stations were to have closed by 2015. The oldest AGR nuclear power station has had its life extended by ten years,[18] and it was likely many of the others could be life-extended, reducing the potential gap suggested by the current accounting closure dates of between 2014 and 2023 for the AGR power stations.[19]
A report from the industry in 2005 forecast that, without action to fill the gap, there would be a 20% shortfall in electricity generation capacity by 2015. Similar concerns were raised by a report published in 2000 by the Royal Commission on Environmental Pollution (Energy - The Changing Climate). The 2006 Energy Review attracted considerable press coverage - in particular in relation to the prospect of constructing a new generation of nuclear power stations, in order to prevent the rise in carbon dioxide emissions that would arise if other conventional power stations were to be built.
Among the public, according to a November 2005 poll conducted by YouGov for Deloitte, 35% of the population expect that by 2020 the majority of electricity generation will come from renewable energy (more than double the government's target, and far larger than the 5.5% generated as of 2008),[20] 23% expect that the majority will come from nuclear power, and only 18% that the majority will come from fossil fuels. 92% thought the Government should do more to explore alternative power generation technologies to reduce carbon emissions.[21]
In June 2013, the industry regulator Ofgem warned that the UK's energy sector faces "unprecedented challenges" and that "spare electricity power production capacity could fall to 2% by 2015, increasing the risk of blackouts". Proposed solutions "could include negotiating with major power users for them to reduce demand during peak times in return for payment".[22]
Plugging the energy gap
The first move to plug the United Kingdom's projected energy gap was the construction of the conventionally gas-fired Langage Power Station and Marchwood Power Station which became operational in 2010.
In 2007, proposals for the construction of two new coal-fired power stations were announced, in Tilbury, Essex and in Kingsnorth, Kent. If built, they will be the first coal-fired stations to be built in the United Kingdom in 20 years.[23]
Beyond these new plants, there were a number of options that might be used to provide the new generating capacity, while minimising carbon emissions and producing less residues and contamination. Fossil fuel power plants might provide a solution if there was a satisfactory and economical way of reducing their carbon emissions. Carbon capture might provide a way of doing this; however the technology is relatively untried and costs are relatively high. As of 2006 there were no power plants in operation with a full carbon capture and storage system, and as of 2018 the situation is little better.
Energy gap disappears
However, due to reducing demand in the late-2000s recession removing any medium term gap, and high gas prices, in 2011 and 2012 over 2 GW of older, less efficient, gas generation plant was mothballed.[24][25] In 2011 electricity demand dropped 4%, and about 6.5 GW of additional gas-fired capacity is being added over 2011 and 2012. Early in 2012 the reserve margin stood at the high level of 32%.[26]
Another important factor in reduced electrical demand in recent years has come from the phasing out of incandescent light bulbs and a switch to compact fluorescent and LED lighting. Research by the University of Oxford[6] has shown that the average annual electrical consumption for lighting in a UK home fell from 720 kWh in 1997 to 508 kWh in 2012. Between 2007 and 2015, the UK's peak electrical demand fell from 61.5 GW to 52.7.GW.[6][27]
Production
| Electricity production in the United Kingdom (GWh) | ||||||||||||
|---|---|---|---|---|---|---|---|---|---|---|---|---|
| Production | Supplied | Conventional thermal and other | CCGT | Nuclear | Non thermal renewables | Pumped storage | ||||||
| 2017[28] | 323,157 | 319,298 | 60,681 | 128,153 | 63,887 | 67,394 | 2,862 | |||||
Electricity per person and by power source
| Electricity per person in the United Kingdom (kWh/ hab.) | ||||||||||||
|---|---|---|---|---|---|---|---|---|---|---|---|---|
| Use | Production | Import | Import % | Fossil | Nuclear | Nuc. % | Other RE* | Bio+waste | Wind | Non RE use* | RE %* | |
| 2004 | 6,741 | 6,615 | 125 | 1.9% | 4,988 | 1,337 | 19.8% | 159 | 132 | 6,450 | 4.3% | |
| 2005 | 6,791 | 6,651 | 139 | 2.0% | 4,902 | 1,355 | 20.0% | 180 | 214 | 6,397 | 5.8% | |
| 2006 | 6,624 | 6,539 | 86 | 1.3% | 5,059 | 1,026 | 15.5% | 251 | 203 | 6,171 | 6.8% | |
| 2008 | 6,573 | 6,392 | 180 | 2.8% | 5,069 | 860 | 13.1% | 266 | 198 | 6,108 | 7.1% | |
| 2009 | 6,005 | 5,958 | 47 | 0.8% | 4,411 | 1,120 | 18.7% | 84* | 204 | 138* | 5,579 | 7.1% |
| * Other RE is waterpower, solar and geothermal electricity and windpower until 2008 * Non RE use = use – production of renewable electricity * RE % = (production of RE / use) * 100% Note: EU calculates the share of renewable energies in gross electrical consumption. | ||||||||||||
Modes of production
The mode of production has changed over the years.
During the 1940s some 90% of the generating capacity was fired by coal, with oil providing most of the remainder.
The United Kingdom started to develop a nuclear generating capacity in the 1950s, with Calder Hall being connected to the grid on 27 August 1956. Though the production of weapons-grade plutonium was the main reason behind this power station, other civil stations followed, and 26% of the nation's electricity was generated from nuclear power at its peak in 1997.
During the 1960s and 70s, coal plants were built to supply consumption despite economic challenges. During the 1970s and 80s some nuclear sites were built. From the 1990s gas power plants benefited from the Dash for Gas supplied by North Sea gas. After the 2000s, renewables like solar and wind added significant capacity.[29] In Q3 2016, nuclear and renewables each supplied a quarter of British electricity, with coal supplying 3.6%.[30][31]
Despite the flow of North Sea oil from the mid-1970s, oil fuelled generation remained relatively small and continued to decline.
Starting in 1993, and continuing through the 1990s, a combination of factors led to a so-called Dash for Gas, during which the use of coal was scaled back in favour of gas-fuelled generation. This was sparked by political concerns, the privatisation of the National Coal Board, British Gas and the Central Electricity Generating Board; the introduction of laws facilitating competition within the energy markets; the availability of cheap gas from the North Sea and elsewhere and the high efficiency and reduced pollution from combined cycle gas turbine (CCGT) generation. In 1990 just 1.09% of all gas consumed in the country was used in electricity generation; by 2004 the figure was 30.25%.[32]
By 2004, coal use in power stations had fallen to 50.5 million tonnes, representing 82.4% of all coal used in 2004 (a fall of 43.6% compared to 1980 levels), though up slightly from its low in 1999.[32] On several occasions in May 2016, Britain burned no coal for electricity for the first time since 1882.[33][34] On 21 April 2017, Britain went a full day without using coal power for the first time since the Industrial Revolution, according to the National Grid.[35]
From the mid-1990s new renewable energy sources began to contribute to the electricity generated, adding to a small hydroelectricity generating capacity.
In 2016, total electricity production stood at 357 TWh (down from a peak of 385 TWh in 2005), generated from the following sources:[36][37]

- Gas: 40.2% (0.05% in 1990)
- Nuclear: 20.1% (19% in 1990)
- Wind: 10.6% (0% in 1990), of which:
- Onshore Wind: 5.7%
- Offshore Wind: 4.9%
- Coal: 8.6 (67% in 1990)
- Bio-Energy: 8.4% (0% in 1990)
- Solar: 2.8% (0% in 1990)
- Hydroelectric: 1.5% (2.6% in 1990)
- Oil and other: 7.8% (12% in 1990)
The UK Government energy policy had targeted a total contribution from renewables to achieve 10% by 2010, but it was not until 2012 that this figure was exceeded; renewable energy sources supplied 11.3% (41.3 TWh) of the electricity generated in the United Kingdom in 2012.[38] The Scottish Government has a target of generating 17% to 18% of Scotland's electricity from renewables by 2010,[39] rising to 40% by 2020.[40]
|
|
The gross production of electricity was 393 TWh in 2004 which gave the 9th position in the world top producers in 2004.[49]
The 6 major companies which dominate the British electricity market ("The Big Six") are: EDF, Centrica (British Gas), E.ON, RWE npower, Scottish Power and Southern & Scottish Energy.
The UK is planning to reform its Electricity Market. It has introduced a capacity mechanism and a Contract for Difference (CfD) subsidised purchase to encourage the building of new more environmentally friendly generation.
Gas and coal
Electricity was produced with gas 160 TWh in 2004 and 177 TWh in 2008. The United Kingdom was 4th top electricity producer from gas both in 2004 and in 2008. In 2005 the UK produced 3.2% of the world total natural gas having the 5th top position after Russia (21.8%), United States (18%), Canada (6.5%) and Algeria (3.2%). In 2009 the UK’s own gas production was less and natural gas was also imported.[49][50]
Due to reducing demand in the late-2000s recession and high gas prices, in 2011 and 2012 over 2 GW of older, less efficient, gas generation plant was mothballed.[51][25]
On several occasions in May 2016, Britain burned no coal for electricity for the first time since 1882.[52][53] Due to lower gas prices, economy of coal plants is strained, and 3 coal plants closed in 2016.[54] On 21st April 2017, the mainland grid burnt no coal to make electricity for the first complete 24 hour period.[55][56]
Nuclear power
Nuclear power in the United Kingdom generates around a quarter of the country's electricity as of 2016, projected to rise to a third by 2035.[57] The UK has 15 operational nuclear reactors at seven plants (14 advanced gas-cooled reactors (AGR) and one pressurised water reactor (PWR)), as well as nuclear reprocessing plants at Sellafield and the Tails Management Facility (TMF) operated by Urenco in Capenhurst.
Renewable energy
From the mid-1990s renewable energy began to contribute to the electricity generated in the United Kingdom, adding to a small hydroelectricity generating capacity. Renewable energy sources provided for 11.3% of the electricity generated in the United Kingdom in 2012,[58] reaching 41.3 TWh of electricity generated. As of 2nd quarter 2017, renewables generated 29.8% of the UK's electricity.[59]
Currently, the biggest renewable source of energy in the UK is wind power, and the UK has some of the best wind resources in Europe. The UK has relatively small hydroelectricity deployment and resources, although some pumped storage exists. Solar power is rapidly growing and provides significant power during daylight hours, but total energy provided is still small. Biofuels are also used as a significant sources of power. Geothermal is not highly accessible and is not a significant source. Tidal resources are present and experimental projects are being tested, but are likely to be expensive.
Wind power delivers a growing percentage of the energy of the United Kingdom and by the beginning of February 2018, it consisted of 8,655 wind turbines with a total installed capacity of over 18.4 gigawatts: 12,083 megawatts of onshore capacity and 6,361 megawatts of offshore capacity.[60] This placed the United Kingdom at this time as the world's sixth largest producer of wind power.[61] Polling of public opinion consistently shows strong support for wind power in the UK, with nearly three quarters of the population agreeing with its use, even for people living near onshore wind turbines.[62][63][64][65][66][67] Wind power is expected to continue growing in the UK for the foreseeable future, RenewableUK estimates that more than 2 GW of capacity will be deployed per year for the next five years.[68] Within the UK, wind power was the second largest source of renewable energy after biomass in 2013.[58]
According to Imperial College Britain could have 40% of electricity from solar power in sunny days by 2020 in 10 million homes compared to a half a million homes in start of 2014. If a third of households would generate solar energy it could equal 6% of British total electricity consumption.[69]
Diesel
Britain has a growing number of Diesel farms for balancing the fluctuating output of renewables, such as wind farms.[70]
Power stations
|
| |
|
| |
|
|
Consumption
Lighting
The European Commission banned low efficiency general-purpose, non-directional incandescent lightbulbs from 2012, though similarly shaped higher-efficiency halogen bulbs continue to be available (although halogen cannot be considered high-efficiency when compared to Compact fluorescent lamp and LED bulbs). The United Kingdom banned them voluntarily from 2011 after Ireland in 2009.
Export/import
There are undersea interconnections to northern France (HVDC Cross-Channel), Northern Ireland (HVDC Moyle), the Isle of Man (Isle of Man to England Interconnector), the Netherlands (BritNed) and the Republic of Ireland (EWIC).
The export of electricity was 1-3% of consumption between 2004-2009. According to IEA the UK was the 6th highest electricity importer, importing 11 TWh, after Brazil (42TWh), Italy (40TWh), United States (33TWh), Netherlands (16TWh) and Finland (14TWh).[50]
The UK grid is connected to adjacent European and Irish electrical grids by submarine power cables, including for links to northern France (HVDC Cross-Channel), Northern Ireland (HVDC Moyle), Republic of Ireland (East–West Interconnector), the Isle of Man (Isle of Man to England Interconnector), and the Netherlands (BritNed). There are also plans to lay cables to link the UK with Iceland and Norway (Scotland–Norway interconnector) in the future.
Electricity billing
In the UK, an electricity supplier is a retailer of electricity. For each supply point the supplier has to pay the various costs of transmission, distribution, meter operation, data collection, tax etc. The supplier then adds in energy costs and the supplier's own charge.
See also
References
- 1 2 3 https://www.gov.uk/government/statistics/electricity-chapter-5-digest-of-united-kingdom-energy-statistics-dukes
- ↑ "Digest of UK energy statistics: 60th Anniversary Report". Retrieved 16 December 2013.
- ↑ RenewableUK News website article Archived 2015-05-09 at the Wayback Machine.
- ↑ RenewableUK. "RenewableUK – RenewableUK News – New-records-set-in-best-ever-year-for-British-wind-energy-generation". renewableuk.com. Retrieved 20 October 2016.
- ↑ "Record year for wind energy – Government releases official figures". 29 March 2018. Retrieved 18 April 2018.
- 1 2 3 "Peak Light Bulb". New Scientist. 4 January 2014. p. 4.
- ↑ "Digest of UK energy statistics: 60th Anniversary Report". Retrieved 16 December 2013.
- ↑ Alan Shaw (29 September 2005). "Kelvin to Weir, and on to GB SYS 2005" (PDF). Royal Society of Edinburgh.
- ↑ "Survey of Belford 1995". North Northumberland Online.
- ↑ "Lighting by electricity". The National Trust. Archived from the original on 29 June 2011.
- ↑ Electricity supply in the United Kingdom : a chronology – from the beginnings of the industry to 31 December 1985. Electricity Council. The Council. 1987. ISBN 085188105X. OCLC 17343802.
- ↑ The Secret Life of the National Grid: Wiring the Nation
- ↑ "Power struggle: The National Grid was created to provide energy for all – but that's when the problems really began | Features | Culture". The Independent. Retrieved 2016-08-21.
- ↑ Cochrane, Rob (1985). Power to the People. ISBN 0600358755.
- 1 2 Gerard Gilbert (22 October 2010). "Power struggle: The National Grid was created to provide energy for all – but that's when the problems really began". The Independent. Retrieved 17 October 2012.
- ↑ Department of Energy and Climate Change (25 July 2013). "Energy consumption in the UK". GOV.UK. Retrieved 5 October 2013.
- ↑ Directive 2001/80/EC
- ↑ 10-year life extension at Dungeness B nuclear power station, British Energy, 15 September 2005, archived from the original on 22 March 2006, retrieved 19 June 2008
- ↑ Stephen Seawright (13 June 2006), Nuclear stations may stay on line to bridge the gap, London: Daily Telegraph, retrieved 30 August 2008
- ↑ , page 23, Department of Energy and Climate Change, published 2009-07-30, accessed 28 August 2009
- ↑ Support for nuclear and renewable energy, Deloitte, published 2005-12-02, retrieved 17 March 2007
- ↑ "BBC News - Ofgem warns danger of power shortages has increased". Bbc.co.uk. 27 June 2013. Retrieved 5 October 2013.
- ↑ Plans for two coal power stations announced, BBC, published 2007-03-14, accessed 17 March 2007.
- ↑ Andreas Walstad (2 August 2011). "UK power plants mothballed on higher gas prices". National Gas Daily. Interfax. Retrieved 9 April 2012.
- 1 2 "Centrica idles gas-fired plant amid low spark spreads". Argus Media. 12 March 2012. Retrieved 9 April 2012.
- ↑ Kari Lundgren (23 February 2012). "Centrica May Mothball More Gas Plants as Capacity Trims Profits". Bloomberg. Retrieved 9 April 2012.
- ↑ "UK Electricity production and demand 2015" (PDF). p. 124.
- ↑ https://assets.publishing.service.gov.uk/government/uploads/system/uploads/attachment_data/file/728465/DUKES_5.1.3.xls Electricity generated and supplied, 1970 to 2017 (DUKES 5.1.3)
- ↑ "Mapped: How the UK generates its electricity - Carbon Brief". Carbon Brief. 12 October 2015. Retrieved 6 October 2016.
- ↑ "UK Energy Statistics, Q3 2016" (PDF). 22 December 2016. Retrieved 24 December 2016.
Low carbon electricity’s share of generation accounted for a record high 50.0 per cent in the third quarter of 2016, up from 45.3 per cent in the same period of 2015, with increased generation from renewables (wind and solar) and nuclear. Coal’s share fell to 3.6%
- ↑ "UK hits clean energy milestone: 50% of electricity from low carbon sources". the Guardian. 22 December 2016. Retrieved 24 December 2016.
- 1 2 UK Energy in Brief July 2005, DTI statistics
- ↑ "Britain passes historic milestone with first days of coal-free power". Financial Times. Retrieved 19 June 2016.
- ↑ "Britain gets no power from coal for 'first time on record'". The Telegraph. 10 May 2016. Retrieved 19 June 2016.
- ↑ "First coal-free day in Britain since Industrial Revolution". BBC News. 22 April 2017. Retrieved 22 April 2017.
- ↑ "UK Energy Statistics, 2016" (PDF).
- ↑ "Digest of UK Energy Statistics - Department of Business, Energy & Industrial Strategy - GOV.UK". beis.gov.uk. Retrieved 24 October 2017.
- ↑ "Department of Energy and Climate Change: Annual tables: 'Digest of UK energy statistics' (DUKES) - Chapter 6: Renewable Sources of energy". Retrieved 1 September 2013.
- ↑ http://www.scotland.gov.uk/Resource/Doc/1050/0002275.pdf
- ↑ "Ministers confirm 40 per cent renewables target". Scotland.gov.uk. 25 March 2003. Retrieved 5 October 2013.
- ↑ Internation Energy Statistics
- ↑ "Archived copy" (PDF). Archived from the original (PDF) on 3 July 2016. Retrieved 14 August 2016.
- ↑ "Archived copy" (PDF). Archived from the original (PDF) on 8 October 2016. Retrieved 14 August 2016.
- ↑ https://www.gov.uk/government/statistics/electricity-section-5-energy-trends
- ↑
- ↑ "Archived copy" (PDF). Archived from the original (PDF) on 2016-07-03. Retrieved 2016-08-14.
- ↑ "Archived copy" (PDF). Archived from the original (PDF) on 2016-10-08. Retrieved 2016-08-14.
- ↑ https://www.gov.uk/government/statistics/electricity-section-5-energy-trends
- 1 2 IEA Key energy statistics 2006
- 1 2 IEA Key energy statistics 2010 pages electricity 27 gas 13,25 fossil 25 nuclear 17
- ↑ Andreas Walstad (2 August 2011). "UK power plants mothballed on higher gas prices". National Gas Daily. Interfax. Retrieved 9 April 2012.
- ↑ "Britain passes historic milestone with first days of coal-free power". Financial Times. Retrieved 19 June 2016.
- ↑ "Britain gets no power from coal for 'first time on record'". The Telegraph. 10 May 2016. Retrieved 19 June 2016.
- ↑ Countdown to 2025: Tracking the UK coal phase out 21 July 2016.
- ↑ https://www.theguardian.com/environment/2017/apr/21/britain-set-for-first-coal-free-day-since-the-industrial-revolution
- ↑ "National Grid can confirm that for the past 24 hours, it has supplied GB's electricity demand without the need for #coal generation."
- ↑ The Department of Energy & Climate Change: Nuclear power in the UK, page 19, National Audit Office, published 2016-07-13, accessed 10 November 2017
- 1 2 "Department of Energy and Climate Change: Annual tables: 'Digest of UK energy statistics' (DUKES) - Chapter 6: Renewable Sources of energy". Retrieved 1 September 2013.
- ↑ https://www.gov.uk/government/uploads/system/uploads/attachment_data/file/647388/Electricity.pdf Chart 5.2
- ↑ "UK Wind Energy Database (UKWED)". RenewableUK. Retrieved 7 February 2018.
- ↑ "Wind power production for main countries". thewindpower.net. Retrieved 31 May 2016.
- ↑ "Wind Energy and the Environment" (PDF). Retrieved 17 January 2012.
- ↑ "A Summary of Opinion Surveys on Wind Power" (PDF). Retrieved 17 January 2012.
- ↑ "Public attitudes to wind farms". Eon-uk.com. 28 February 2008. Retrieved 17 January 2012.
- ↑ "The Social Acceptance of Wind Energy". European Commission. Archived from the original on 28 March 2009.
- ↑ "'Rise in Scots wind farm support'". BBC News. 19 October 2010.
- ↑ "An investigation into the potential barriers facing the development of offshore wind energy in Scotland" (PDF). 7 March 2012.
- ↑ RenewableUK. "RenewableUK - The Voice of Wind & Marine Energy". bwea.com. Archived from the original on 2012-10-21.
- ↑ UK should have 10 million homes with solar panels by 2020, experts say, Imperial College says Britain could get as much as 40% of its electricity from solar power on sunny days by decade's end 29 January 2014
- ↑ https://www.theguardian.com/business/2016/dec/06/diesel-farms-national-grid-tax-breaks