Delaware's at-large congressional district
| Delaware's At-large congressional district | |
|---|---|
 | |
| Current Representative | Lisa Blunt Rochester (D–Wilmington) |
| Area | 2,489 sq mi (6,450 km2) |
| Distribution |
|
| Population (2015) | 945,934 |
| Median income | 57,357 |
| Ethnicity | |
| Cook PVI | D+6[2] |
Delaware's at-large congressional district is a congressional district that includes the entire U.S. state of Delaware.
It is currently represented by Democrat Lisa Blunt Rochester.
Voting
| Election results from presidential races | ||
|---|---|---|
| Year | Office | Results |
| 1992 | President | Clinton 44–35% |
| 1996 | President | Clinton 52–37% |
| 2000 | President | Gore 55–42% |
| 2004 | President | Kerry 53–45% |
| 2008 | President | Obama 61–36% |
| 2012 | President | Obama 59–40% |
| 2016 | President | Clinton 53–42% |
History
Delaware has always had only one U.S. Representative, except for 10 years between 1813 and 1823, when the state had two at-large representatives. The two seats were filled by a statewide ballot, with the two candidates receiving the highest votes being elected.
Former U.S. Representative Michael N. Castle, a Republican and former Governor of Delaware, held this seat from January 1993 until his retirement in January 2011, after his unsuccessful bid for the Republican nomination to run for the U.S. Senate. Even as Delaware swung heavily Democratic at the state and national level, Castle was usually reelected without serious difficulty. Since his retirement, however, the Democrats have held it with no substantive opposition.
List of representatives
| # | Representative | Years | Party | Congress(es) | Electoral history |
|---|---|---|---|---|---|
| 1 |  |
March 4, 1789 – March 3, 1793 |
Pro- Administration |
1 2 |
Elected in 1789. Retired. |
| 2 |  |
March 4, 1793 – February 14, 1794 |
Anti- Administration |
3 | Elected in 1792. Lost election contest. |
| 3 |  |
February 14, 1794 – February 7, 1795 |
Pro- Administration |
3 | Won election contest. Lost re-election. |
| 4 | |
March 4, 1795 – March 3, 1797 |
Democratic- Republican |
4 | Elected in 1794. [Data unknown/missing.] |
| 5 |  |
March 4, 1797 – March 3, 1803 |
Federalist | 5 6 7 |
Elected in 1796. [Data unknown/missing.] |
| 6 |  |
March 4, 1803 – March 3, 1805 |
Democratic- Republican |
8 17 |
Elected in 1802. [Data unknown/missing.] |
| 7 |  |
March 4, 1805 – October 6, 1807 |
Federalist | 9 10 |
Elected in 1804. [Data unknown/missing.] |
| 8 |  |
October 6, 1807 – March 3, 1811 |
Federalist | 10 11 |
Elected in 1807. [Data unknown/missing.] |
| 9 |  |
March 4, 1811 – March 3, 1815 |
Federalist | 12 13 |
Elected in 1810. [Data unknown/missing.] |
| 10 |  |
March 4, 1815 – March 3, 1817 |
Federalist | 14 | Elected in 1814. [Data unknown/missing.] |
| 11 |  |
March 4, 1817 – March 3, 1827 |
Federalist | 15 16 17 |
Elected in 1816. [Data unknown/missing.] |
| Crawford Federalist | 18 | ||||
| Jacksonian | 19 | ||||
| 12 |  |
October 2, 1827 – March 3, 1831 |
Adams | 20 | Elected in 1827. [Data unknown/missing.] |
| Anti- Jacksonian |
21 | ||||
| 13 |  |
March 4, 1831 – March 3, 1839 |
Anti- Jacksonian |
22 23 24 |
Elected in 1830. [Data unknown/missing.] |
| Whig | 25 | ||||
| 14 | |
March 4, 1839 – March 3, 1841 |
Democratic | 26 | Elected in 1838. [Data unknown/missing.] |
| 15 | |
March 4, 1841 – March 3, 1845 |
Whig | 27 28 |
Elected in 1840. [Data unknown/missing.] |
| 16 | |
March 4, 1845 – March 3, 1851 |
Whig | 29 30 31 |
Elected in 1844. [Data unknown/missing.] |
| 17 |  |
March 4, 1851 – March 3, 1855 |
Democratic | 32 33 |
Elected in 1850. [Data unknown/missing.] |
| 18 | |
March 4, 1855 – March 3, 1857 |
Know Nothing |
34 | Elected in 1854. [Data unknown/missing.] |
| 19 |  |
March 4, 1857 – March 3, 1861 |
Democratic | 35 36 |
Elected in 1856. [Data unknown/missing.] |
| 20 |  |
March 4, 1861 – March 3, 1863 |
Unionist | 37 | Elected in 1860. [Data unknown/missing.] |
| 21 |  |
March 4, 1863 – May 28, 1863 |
Democratic | 38 | Elected in 1862. [Data unknown/missing.] |
| 22 | .jpg) |
December 7, 1863 – March 3, 1865 |
Unconditional Unionist | 38 | Elected in 1863. [Data unknown/missing.] |
| 23 |  |
March 4, 1865 – March 3, 1869 |
Democratic | 39 40 |
Elected in 1864. [Data unknown/missing.] |
| 24 |  |
March 4, 1869 – March 3, 1873 |
Democratic | 41 42 |
Elected in 1868. [Data unknown/missing.] |
| 25 | |
March 4, 1873 – March 3, 1875 |
Republican | 43 | Elected in 1872. [Data unknown/missing.] |
| 26 |  |
March 4, 1875 – March 3, 1879 |
Democratic | 44 45 |
Elected in 1874. [Data unknown/missing.] |
| 27 | |
March 4, 1879 – March 3, 1883 |
Democratic | 46 47 |
Elected in 1878. [Data unknown/missing.] |
| 28 | .jpg) |
March 4, 1883 – March 3, 1887 |
Democratic | 48 49 |
Elected in 1882. [Data unknown/missing.] |
| 29 | |
March 4, 1887 – March 3, 1891 |
Democratic | 50 51 |
Elected in 1886. [Data unknown/missing.] |
| 30 |  |
March 4, 1891 – March 3, 1895 |
Democratic | 52 53 |
Elected in 1890. [Data unknown/missing.] |
| 31 |  |
March 4, 1895 – March 3, 1897 |
Republican | 54 | Elected in 1894. [Data unknown/missing.] |
| 32 | .jpg) |
March 4, 1897 – March 3, 1899 |
Democratic | 55 | Elected in 1896. [Data unknown/missing.] |
| 33 |  |
March 4, 1899 – June 16, 1900 |
Republican | 56 | Elected in 1898. [Data unknown/missing.] |
| 34 | |
November 6, 1900 – March 3, 1901 |
Republican | 56 | Elected in 1900. [Data unknown/missing.] |
| 35 |  |
March 4, 1901 – March 3, 1903 |
Republican | 57 | Elected in 1900. [Data unknown/missing.] |
| 36 | |
March 4, 1903 – March 3, 1905 |
Democratic | 58 | Elected in 1902. [Data unknown/missing.] |
| 37 |  |
March 4, 1905 – March 3, 1909 |
Republican | 59 60 |
Elected in 1904. [Data unknown/missing.] |
| 38 | .jpg) |
March 4, 1909 – March 3, 1913 |
Republican | 61 62 |
Elected in 1908. [Data unknown/missing.] |
| 39 |  |
March 4, 1913 – March 3, 1915 |
Democratic | 63 | Elected in 1912. [Data unknown/missing.] |
| 40 |  |
March 4, 1915 – March 3, 1917 |
Republican | 64 | Elected in 1914. [Data unknown/missing.] |
| 41 |  |
March 4, 1917 – March 3, 1919 |
Democratic | 65 | Elected in 1916. [Data unknown/missing.] |
| 42 |  |
March 4, 1919 – March 3, 1923 |
Republican | 66 67 |
Elected in 1918. [Data unknown/missing.] |
| 43 |  |
March 4, 1923 – March 3, 1925 |
Democratic | 68 | Elected in 1922. [Data unknown/missing.] |
| 44 |  |
March 4, 1925 – March 3, 1933 |
Republican | 69 70 71 72 |
Elected in 1924. [Data unknown/missing.] |
| 45 | Wilbur L. Adams | March 4, 1933 – January 3, 1935 |
Democratic | 73 | Elected in 1932. [Data unknown/missing.] |
| 46 |  |
January 3, 1935 – January 3, 1937 |
Republican | 74 | Elected in 1934. [Data unknown/missing.] |
| 47 | |
January 3, 1937 – January 3, 1939 |
Democratic | 75 | Elected in 1936. [Data unknown/missing.] |
| 48 | |
January 3, 1939 – January 3, 1941 |
Republican | 76 | Elected in 1938. [Data unknown/missing.] |
| 49 | |
January 3, 1941 – January 3, 1943 |
Democratic | 77 | Elected in 1940. [Data unknown/missing.] |
| 50 | |
January 3, 1943 – January 3, 1945 |
Republican | 78 | Elected in 1942. [Data unknown/missing.] |
| 51 | |
January 3, 1945 – January 3, 1947 |
Democratic | 79 | Elected in 1944. [Data unknown/missing.] |
| 52 |  |
January 3, 1947 – January 3, 1953 |
Republican | 80 81 82 |
Elected in 1946. [Data unknown/missing.] |
| 53 | .jpg) |
January 3, 1953 – January 3, 1955 |
Republican | 83 | Elected in 1952. [Data unknown/missing.] |
| 54 |  |
January 3, 1955 – January 3, 1957 |
Democratic | 84 | Elected in 1954. [Data unknown/missing.] |
| 55 | .jpg) |
January 3, 1957 – January 3, 1959 |
Republican | 85 | Elected in 1956. [Data unknown/missing.] |
| 56 | |
January 3, 1959 – January 3, 1967 |
Democratic | 86 87 88 89 |
Elected in 1958. [Data unknown/missing.] |
| 57 | .jpg) |
January 3, 1967 – December 31, 1970 |
Republican | 90 91 |
Elected in 1966. [Data unknown/missing.] |
| 58 |  |
January 3, 1971 – January 3, 1977 |
Republican | 92 93 94 |
Elected in 1970. [Data unknown/missing.] |
| 59 |  |
January 3, 1977 – January 3, 1983 |
Republican | 95 96 97 |
Elected in 1976. [Data unknown/missing.] |
| 60 |  |
January 3, 1983 – January 3, 1993 |
Democratic | 98 99 100 101 102 |
Elected in 1982. Retired to run for Governor of Delaware |
| 61 |  |
January 3, 1993 – January 3, 2011 |
Republican | 103 104 105 106 107 108 109 110 111 |
Elected in 1992. Retired to run for U.S. Senate |
| 62 |  |
January 3, 2011 – January 3, 2017 |
Democratic | 112 113 114 |
Elected in 2010. Re-elected in 2012. Re-elected in 2014. Retired to run for Governor of Delaware. |
| 63 | 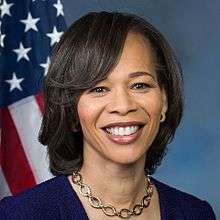 |
January 3, 2017 – Present |
Democratic | 115 | Elected in 2016. |
Second at-large seat: 1813–1823
From 1813 to 1823, Delaware elected two members of the United States House of Representatives. Both were elected statewide at-large. This is a list of the four men who held that second seat during that decade.
| # | Representative | Years | Party | Congress | Electoral history |
|---|---|---|---|---|---|
| 1 | |
March 4, 1813 – March 3, 1817 |
Federalist | 13 14 |
Elected in 1812. Re-elected in 1814. [Data unknown/missing.] |
| 2 |  |
March 4, 1817 – January 22, 1821 |
Democratic- Republican |
15 | Elected in 1816. Re-elected in 1818. Lost re-election and resigned early |
| 16 | |||||
| Vacant | January 22, 1821 – March 4, 1821 |
||||
| 3 | |
March 4, 1821 – January 24, 1822 |
Democratic- Republican |
17 | Elected in 1820. Resigned when elected to the U.S. Senate |
| Vacant | January 24, 1822 – October 1, 1822 |
||||
| 4 |  |
October 1, 1822 – March 3, 1823 |
Federalist | Elected in 1822. to finish his cousin's term. [Data unknown/missing.] | |
Recent election results
|
1920 • 1922 • 1924 • 1926 • 1928 • 1930 • 1932 • 1934 • 1936 • 1938 • 1940 • 1942 • 1944 • 1946 • 1948 • 1950 • 1952 • 1954 • 1956 • 1958 • 1960 • 1962 • 1964 • 1966 • 1968 • 1970 • 1972 • 1974 • 1976 • 1978 • 1980 • 1982 • 1984 • 1986 • 1988 • 1990 • 1992 • 1994 • 1996 • 1998 • 2000 • 2002 • 2004 • 2006 • 2008 • 2010 • 2012 • 2014 • 2016 |
1920
| Party | Candidate | Votes | % | |
|---|---|---|---|---|
| Republican | Caleb R. Layton (incumbent) | 52,145 | 56% | |
| Democratic | James R. Clements | 40,206 | 43% | |
| Socialist | Robert A. Walker | 1,063 | .01% | |
| Independent | Howard T. Ennis | 196 | 0.02% | |
| Total votes | 93,609 | 100% | ||
| Turnout | ||||
| Republican hold | ||||
1922
| Party | Candidate | Votes | % | |||
|---|---|---|---|---|---|---|
| Democratic | William H. Boyce | 39,126 | 54% | |||
| Republican | Caleb R. Layton (incumbent) | 32,577 | 45% | |||
| Independent | Frank A. Houck | 908 | .01% | |||
| Total votes | 72,611 | 100% | ||||
| Turnout | ||||||
| Democratic gain from Republican | ||||||
1924
| Party | Candidate | Votes | % | |||
|---|---|---|---|---|---|---|
| Republican | Robert G. Houston | 51,536 | 59% | |||
| Democratic | William H. Boyce (incumbent) | 35,943 | 41% | |||
| Independent | Florence Garvin | 519 | 0.05 | |||
| Total votes | 87,998 | 100% | ||||
| Turnout | ||||||
| Republican gain from Democratic | ||||||
1926
| Party | Candidate | Votes | % | |
|---|---|---|---|---|
| Republican | Robert G. Houston (incumbent) | 38,919 | 52% | |
| Democratic | Merrill H. Tilghman | 35,943 | 48% | |
| Total votes | 74,862 | 100% | ||
| Turnout | ||||
| Republican hold | ||||
1928
| Party | Candidate | Votes | % | |
|---|---|---|---|---|
| Republican | Robert G. Houston (incumbent) | 66,361 | 64% | |
| Democratic | John M. Richardson | 38,045 | 36% | |
| Total votes | 104,406 | 100% | ||
| Turnout | ||||
| Republican hold | ||||
1930
| Party | Candidate | Votes | % | |
|---|---|---|---|---|
| Republican | Robert G. Houston (incumbent) | 48,493 | 56% | |
| Democratic | John P. Le Fevre | 38,391 | 44% | |
| Independent | Arnold Williams | 127 | 0.01% | |
| Total votes | 87,011 | 100% | ||
| Turnout | ||||
| Republican hold | ||||
1932
| Party | Candidate | Votes | % | |||
|---|---|---|---|---|---|---|
| Democratic | Wilbur L. Adams | 51,698 | 46% | |||
| Republican | Reuben Satterthwaite, Jr. | 48,841 | 44% | |||
| Prohibition | Francis B. Short | 10,560 | 9% | |||
| Socialist | Edgar G. Shaeffer | 887 | 0.08% | |||
| Communist | Frank Rhoades | 110 | 0.01% | |||
| Total votes | 112,096 | 100% | ||||
| Turnout | ||||||
| Democratic gain from Republican | ||||||
1934
| Party | Candidate | Votes | % | |||
|---|---|---|---|---|---|---|
| Republican | J. George Stewart | 52,829 | 53% | |||
| Democratic | John C. Hazzard | 45,771 | 46% | |||
| Socialist | William A. Mayor | 404 | 0.4% | |||
| Communist | Joseph P. Daniels | 58 | .006% | |||
| Total votes | 99,062 | 100% | ||||
| Turnout | ||||||
| Republican gain from Democratic | ||||||
1936
| Party | Candidate | Votes | % | |||
|---|---|---|---|---|---|---|
| Democratic | William F. Allen | 65,485 | 52% | |||
| Republican | J. George Stewart (incumbent) | 55,664 | 44% | |||
| Republican | James A. Ellison | 5,338 | 4% | |||
| Socialist | William A. Mayor | 176 | 0.01% | |||
| Total votes | 126,663 | 100% | ||||
| Turnout | ||||||
| Democratic gain from Republican | ||||||
1938
| Party | Candidate | Votes | % | |||
|---|---|---|---|---|---|---|
| Republican | George S. Williams | 60,661 | 56% | |||
| Democratic | William F. Allen (incumbent) | 46,989 | 43% | |||
| Republican | William J. Highfield | 816 | 0.07% | |||
| Progressive | Ralph L. Brown | 105 | 0.01% | |||
| Total votes | 108,571 | 100% | ||||
| Turnout | ||||||
| Republican gain from Democratic | ||||||
1940
| Party | Candidate | Votes | % | |||
|---|---|---|---|---|---|---|
| Democratic | Philip A. Traynor | 68,205 | 51% | |||
| Republican | George S. Williams (incumbent) | 64,384 | 48% | |||
| Independent | Royden C. Caulk | 816 | 0.06% | |||
| Total votes | 133,405 | 100% | ||||
| Turnout | ||||||
| Democratic gain from Republican | ||||||
1980
| Party | Candidate | Votes | % | |
|---|---|---|---|---|
| Republican | Tom Evans (incumbent) | 133,842 | 62% | |
| Democratic | Robert Maxwell | 81,227 | 37% | |
| Libertarian | Lawrence Sullivan | 1,506 | 1% | |
| Total votes | 216,575 | 100% | ||
| Republican hold | ||||
1982
| Party | Candidate | Votes | % | |||
|---|---|---|---|---|---|---|
| Democratic | Thomas R. Carper | 98,533 | 52% | |||
| Republican | Tom Evans (incumbent) | 87,153 | 46% | |||
| American | Mary Gies | 1,109 | 1% | |||
| Libertarian | Richard Cohen | 711 | 0.38% | |||
| N/A | David Nuttall | 558 | 0.30% | |||
| Total votes | 188,064 | 100% | ||||
| Democratic gain from Republican | ||||||
1984
| Party | Candidate | Votes | % | |
|---|---|---|---|---|
| Democratic | Thomas R. Carper (incumbent) | 142,070 | 58% | |
| Republican | Elise du Pont | 100,650 | 41% | |
| Libertarian | V. Luther Etzel | 294 | 0.12% | |
| Total votes | 243,014 | 100% | ||
| Democratic hold | ||||
1986
| Party | Candidate | Votes | % | |
|---|---|---|---|---|
| Democratic | Thomas R. Carper (incumbent) | 106,351 | 66% | |
| Republican | Thomas Nueberger | 53,767 | 33% | |
| American | Patrick Harrison | 639 | 0.40% | |
| Total votes | 160,757 | 100% | ||
| Democratic hold | ||||
1988
| Party | Candidate | Votes | % | |
|---|---|---|---|---|
| Democratic | Thomas R. Carper (incumbent) | 158,338 | 68% | |
| Republican | James P. Krapf | 76,179 | 32% | |
| Total votes | 234,517 | 100% | ||
| Democratic hold | ||||
1990
| Party | Candidate | Votes | % | |
|---|---|---|---|---|
| Democratic | Thomas R. Carper (incumbent) | 116,274 | 66% | |
| Republican | Ralph Williams | 58,037 | 33% | |
| Libertarian | Richard Cohen | 3,121 | 1% | |
| N/A | Write-ins | 3 | <0.01% | |
| Total votes | 177,435 | 100% | ||
| Democratic hold | ||||
1992
| Party | Candidate | Votes | % | |||
|---|---|---|---|---|---|---|
| Republican | Mike Castle | 153,037 | 55% | |||
| Democratic | S. B. Woo | 117,426 | 43% | |||
| Libertarian | Peggy Schmitt | 5,661 | 2% | |||
| Total votes | 276,124 | 100% | ||||
| Republican gain from Democratic | ||||||
1994
| Party | Candidate | Votes | % | |
|---|---|---|---|---|
| Republican | Mike Castle (incumbent) | 137,945 | 71% | |
| Democratic | Carol Ann DeSantis | 51,793 | 27% | |
| Libertarian | Danny Ray Beaver | 3,866 | 2% | |
| Delaware Independent | Donald M. Hockmuth | 1,404 | 0.72% | |
| Total votes | 195,008 | 100% | ||
| Republican hold | ||||
1996
| Party | Candidate | Votes | % | |
|---|---|---|---|---|
| Republican | Mike Castle (incumbent) | 185,577 | 70% | |
| Democratic | Dennis E. Williams | 73,258 | 27% | |
| Libertarian | George A. Jurgensen | 4,000 | 2% | |
| Constitution | Felicia B. Johnson | 3,009 | 1% | |
| Natural Law | Bob Mattson | 987 | 0.37% | |
| Total votes | 266,831 | 100% | ||
| Republican hold | ||||
1998
| Party | Candidate | Votes | % | |
|---|---|---|---|---|
| Republican | Mike Castle (incumbent) | 119,811 | 66% | |
| Democratic | Micheal C. Miller | 57,446 | 32% | |
| Constitution | James P. Webster | 2,411 | 1% | |
| Natural Law | Kim Stanley Bemis | 859 | 1% | |
| N/A | Write-ins | 2 | <0.01% | |
| Total votes | 180,529 | 100% | ||
| Republican hold | ||||
2000
| Party | Candidate | Votes | % | |
|---|---|---|---|---|
| Republican | Mike Castle (incumbent) | 211,797 | 68% | |
| Democratic | Micheal C. Miller | 96,488 | 31% | |
| Constitution | James P. Webster | 2,490 | 0.5% | |
| Libertarian | Brad C. Thomas | 2,351 | 0.5% | |
| Total votes | 313,126 | 100% | ||
| Republican hold | ||||
2002
| Party | Candidate | Votes | % | |
|---|---|---|---|---|
| Republican | Mike Castle (incumbent) | 164,605 | 72% | |
| Democratic | Micheal C. Miller | 61,011 | 27% | |
| Libertarian | Brad C. Thomas | 2,789 | 1% | |
| Total votes | 228,405 | 100% | ||
| Republican hold | ||||
2004
| Party | Candidate | Votes | % | |
|---|---|---|---|---|
| Republican | Mike Castle (incumbent) | 245,978 | 69% | |
| Democratic | Paul Donnelly | 105,716 | 30% | |
| Delaware Independent | Maurice J. Barros (write-in) | 2,337 | 0.5% | |
| Libertarian | William E. Morris | 2,014 | 0.5% | |
| Total votes | 356,045 | 100% | ||
| Republican hold | ||||
2006
| Party | Candidate | Votes | % | |
|---|---|---|---|---|
| Republican | Mike Castle (incumbent) | 143,897 | 57% | |
| Democratic | Dennis Spivack | 97,565 | 39% | |
| Delaware Independent | Karen M. Hartley-Nagle | 5,769 | 2% | |
| Green | Michael Berg | 4,463 | 2% | |
| Total votes | 251,694 | 100% | ||
| Republican hold | ||||
2008
| Party | Candidate | Votes | % | |
|---|---|---|---|---|
| Republican | Michael Castle (incumbent) | 235,437 | 61% | |
| Democratic | Karen Hartley-Nagle | 146,434 | 38% | |
| Libertarian | Mark Parks | 3,586 | 1% | |
| Total votes | 385,457 | 100% | ||
| Republican hold | ||||
2010
| Party | Candidate | Votes | % | |||
|---|---|---|---|---|---|---|
| Democratic | John Carney | 173,543 | 57% | |||
| Republican | Glen Urquhart | 125,442 | 41% | |||
| Independent | Earl R. Lofland | 3,704 | 1% | |||
| Libertarian | Brent Wangen | 1,986 | 1% | |||
| Independent | Jeffrey Brown | 961 | 0.31% | |||
| Total votes | 305,636 | 100% | ||||
| Turnout | ||||||
| Democratic gain from Republican | ||||||
2012
| Party | Candidate | Votes | % | |
|---|---|---|---|---|
| Democratic | John Carney (incumbent) | 249,905 | 64% | |
| Republican | Tom Kovach | 129,749 | 33% | |
| Green | Bernard August | 4,273 | 2% | |
| Libertarian | Scott Gesty | 4,096 | 1% | |
| Total votes | 388,023 | 100% | ||
| Democratic hold | ||||
2014
| Party | Candidate | Votes | % | |
|---|---|---|---|---|
| Democratic | John Carney (incumbent) | 137,251 | 59% | |
| Republican | Rose Izzo | 85,146 | 37% | |
| Green | Bernard August | 4,801 | 2% | |
| Libertarian | Scott Gesty | 4,419 | 2% | |
| Total votes | 231,617 | 100% | ||
| Democratic hold | ||||
2016
| Party | Candidate | Votes | % | |
|---|---|---|---|---|
| Democratic | Lisa Blunt Rochester | 233,554 | 56% | |
| Republican | Hans Reigle | 172,301 | 41% | |
| Green | Mark Andrew Perri | 8,326 | 2% | |
| Libertarian | Scott Gesty | 6,436 | 2% | |
| Total votes | 420,617 | 100% | ||
| Democratic hold | ||||
Living former Members
As of January 2017, there are six former members of the U.S. House of Representatives from Delaware's at-large congressional district who are currently living at this time.
| Representative | Term of office | District | Date of birth (and age) |
|---|---|---|---|
| Harry G. Haskell, Jr. | 1957–1959 | At-large | May 27, 1921 |
| Pete du Pont | 1971–1977 | At-large | January 22, 1935 |
| Thomas B. Evans, Jr. | 1977–1983 | At-large | November 5, 1931 |
| Tom Carper | 1983–1993 | At-large | January 23, 1947 |
| Michael Castle | 1993–2011 | At-large | July 2, 1939 |
| John Carney | 2011–2017 | At-large | May 20, 1956 |
References
- Barone, Michael; Richard E. Cohen (2005). The Almanac of American Politics. Washington: National Journal Group. ISBN 0-89234-112-2.
- Martin, Roger A. (1995). Memoirs of the Senate. Newark, DE: Roger A. Martin.
- ↑ "Urban Rural Population United States in 2010 - Distribution". Statista. Archived from the original on 1 February 2018. Retrieved 7 May 2018.
- ↑ "Partisan Voting Index – Districts of the 115th Congress" (PDF). The Cook Political Report. April 7, 2017. Archived (PDF) from the original on June 7, 2017. Retrieved April 7, 2017.
- ↑ Representatives, Office of the Clerk, U.S. House of. "Office of the Clerk of the U.S. House of Representatives - 404". clerk.house.gov. Archived from the original on 25 March 2016. Retrieved 7 May 2018.
- ↑ Representatives, Office of the Clerk, U.S. House of. "Office of the Clerk of the U.S. House of Representatives - 404". clerk.house.gov. Archived from the original on 4 March 2016. Retrieved 7 May 2018.
- ↑ Representatives, Office of the Clerk, U.S. House of. "Office of the Clerk of the U.S. House of Representatives - 404". clerk.house.gov. Archived from the original on 27 February 2015. Retrieved 7 May 2018.
- ↑ Representatives, Office of the Clerk, U.S. House of. "Office of the Clerk of the U.S. House of Representatives - 404". clerk.house.gov. Archived from the original on 25 March 2016. Retrieved 7 May 2018.
- ↑ Representatives, Office of the Clerk, U.S. House of. "Office of the Clerk of the U.S. House of Representatives - 404". clerk.house.gov. Archived from the original on 17 March 2016. Retrieved 7 May 2018.
- ↑ Representatives, Office of the Clerk, U.S. House of. "Office of the Clerk of the U.S. House of Representatives - 404". clerk.house.gov. Archived from the original on 24 March 2016. Retrieved 7 May 2018.
- ↑ Representatives, Office of the Clerk, U.S. House of. "Office of the Clerk of the U.S. House of Representatives - 404". clerk.house.gov. Archived from the original on 26 March 2016. Retrieved 7 May 2018.
- ↑ Representatives, Office of the Clerk, U.S. House of. "Office of the Clerk of the U.S. House of Representatives - 404". clerk.house.gov. Archived from the original on 4 March 2016. Retrieved 7 May 2018.
- ↑ Representatives, Office of the Clerk, U.S. House of. "Office of the Clerk of the U.S. House of Representatives - 404". clerk.house.gov. Archived from the original on 10 June 2011. Retrieved 7 May 2018.
- ↑ Representatives, Office of the Clerk, U.S. House of. "Office of the Clerk of the U.S. House of Representatives - 404". clerk.house.gov. Archived from the original on 10 June 2011. Retrieved 7 May 2018.
- ↑ "2000 ELECTION STATISTICS". clerk.house.gov. Archived from the original on 21 July 2011. Retrieved 7 May 2018.
- ↑ "2002 ELECTION STATISTICS". clerk.house.gov. Archived from the original on 13 September 2009. Retrieved 7 May 2018.
- ↑ "2004 ELECTION STATISTICS". clerk.house.gov. Archived from the original on 10 June 2011. Retrieved 7 May 2018.
- ↑ "2006 Election Statistics". clerk.house.gov. Archived from the original on 24 August 2011. Retrieved 7 May 2018.
- ↑ "State of Delaware Primary Election Official Results". State of Delaware. Archived from the original on November 7, 2012. Retrieved November 7, 2012.
- 1 2 "State of Delaware General Election (Official Results)". State of Delaware Election Commissioner. Archived from the original on November 26, 2014. Retrieved November 27, 2014.