Climate of Sydney
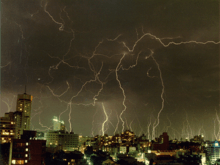
The climate of Sydney is humid subtropical (Köppen Cfa),[1] shifting from mild and cool in winter to warm and hot in the summer, with no extreme seasonal differences as the weather is moderated by proximity to the ocean.[2] More contrasting temperatures are recorded in the inland western suburbs. Although there is no distinct dry or wet season, rainfall peaks in the first half of the year and is at its lowest in the second half.[3] Precipitation varies across the region, with areas adjacent to the coast being the wettest.[4] The city receives around 20 thunderstorms per year.[5]
Sydney has 103.9 clear days annually,[6][7] with the monthly percent possible sunshine ranging from 53% in January to 72% in August.[8] Sydney's heat is predominantly dry in spring, but usually humid in the summertime,[9] especially late summer – however, when temperatures soar over 35 °C (95 °F), the humidity is generally low as such high temperatures are brought by searing winds from the Australian desert.[10][11] In some hot summer days, low pressure troughs would increase humidity and southerly busters would decrease temperatures by late afternoon or early evening.[12][13] In late autumn and winter, east coast lows can bring large amounts of rainfall.[14]
Sydney experiences an urban heat island effect,[15] making certain parts of the city more vulnerable to extreme heat, particularly the west.[15] Efforts have been introduced to investigate and mitigate this heat effect, including increasing shade from tree canopies, adding rooftop gardens to high rise structures and changing pavement colour.[16][17] The El Niño Southern Oscillation plays an important role in determining Sydney's weather patterns: drought and bushfire on the one hand, and storms and flooding on the other. Sydney is prone to heat waves and drought, which have become more common in recent years.[18][19][20][21]
Climate data
Climate data for Sydney (Observatory Hill) | |||||||||||||
|---|---|---|---|---|---|---|---|---|---|---|---|---|---|
| Month | Jan | Feb | Mar | Apr | May | Jun | Jul | Aug | Sep | Oct | Nov | Dec | Year |
| Record high °C (°F) | 45.8 (114.4) |
42.1 (107.8) |
39.8 (103.6) |
35.4 (95.7) |
30.0 (86) |
26.9 (80.4) |
26.5 (79.7) |
31.3 (88.3) |
34.6 (94.3) |
38.2 (100.8) |
41.8 (107.2) |
42.2 (108) |
45.8 (114.4) |
| Average high °C (°F) | 26.5 (79.7) |
26.5 (79.7) |
25.4 (77.7) |
23.3 (73.9) |
20.6 (69.1) |
18.0 (64.4) |
17.4 (63.3) |
18.9 (66) |
21.2 (70.2) |
22.8 (73) |
23.8 (74.8) |
25.5 (77.9) |
22.5 (72.5) |
| Daily mean °C (°F) | 23.0 (73.4) |
23.1 (73.6) |
21.7 (71.1) |
20.7 (69.3) |
16.5 (61.7) |
13.9 (57) |
13.0 (55.4) |
14.3 (57.7) |
16.6 (61.9) |
18.6 (65.5) |
20.0 (68) |
21.9 (71.4) |
18.5 (65.3) |
| Average low °C (°F) | 19.6 (67.3) |
19.7 (67.5) |
18.1 (64.6) |
15.3 (59.5) |
12.5 (54.5) |
9.8 (49.6) |
8.7 (47.7) |
9.7 (49.5) |
12.0 (53.6) |
14.4 (57.9) |
16.3 (61.3) |
18.3 (64.9) |
14.5 (58.1) |
| Record low °C (°F) | 10.6 (51.1) |
9.6 (49.3) |
9.3 (48.7) |
7.0 (44.6) |
4.4 (39.9) |
2.1 (35.8) |
2.2 (36) |
2.7 (36.9) |
4.9 (40.8) |
5.7 (42.3) |
7.7 (45.9) |
9.1 (48.4) |
2.1 (35.8) |
| Average rainfall mm (inches) | 96.0 (3.78) |
136.6 (5.378) |
109.4 (4.307) |
137.0 (5.394) |
117.6 (4.63) |
117.8 (4.638) |
80.8 (3.181) |
91.8 (3.614) |
69.2 (2.724) |
82.2 (3.236) |
104.8 (4.126) |
79.4 (3.126) |
1,222.7 (48.138) |
| Average rainy days | 12.3 | 12.9 | 13.3 | 11.1 | 12.2 | 10.5 | 10.2 | 8.4 | 8.8 | 11.1 | 12.7 | 11.2 | 134.7 |
| Average afternoon relative humidity (%) | 61 | 62 | 60 | 59 | 58 | 56 | 52 | 48 | 50 | 53 | 57 | 58 | 56 |
| Mean monthly sunshine hours | 235.6 | 202.4 | 213.9 | 207.0 | 195.3 | 177.0 | 204.6 | 244.9 | 237.0 | 244.9 | 228.0 | 244.9 | 2,635.5 |
| Percent possible sunshine | 53 | 54 | 56 | 61 | 59 | 60 | 65 | 72 | 66 | 61 | 55 | 55 | 60 |
| Source #1: Bureau of Meteorology[7][22] (1981–2010 averages, records 1861–) | |||||||||||||
| Source #2: Bureau of Meteorology, Sydney Airport (sunshine hours)[23] | |||||||||||||
| Climate data for Sydney | |||||||||||||
|---|---|---|---|---|---|---|---|---|---|---|---|---|---|
| Month | Jan | Feb | Mar | Apr | May | Jun | Jul | Aug | Sep | Oct | Nov | Dec | Year |
| Average sea temperature °C (°F) | 23.3 (73.9) |
23.7 (74.7) |
23.4 (74.1) |
22.7 (72.8) |
20.7 (69.3) |
19.3 (66.8) |
19.1 (66.4) |
18.8 (65.8) |
18.5 (65.3) |
19.2 (66.5) |
20.6 (69.0) |
21.9 (71.4) |
19.6 (67.2) |
| Mean daily daylight hours | 13.5 | 13.4 | 12.4 | 11.3 | 10.4 | 10.0 | 10.1 | 10.9 | 11.9 | 13.0 | 13.9 | 14.4 | 12.1 |
| Average Ultraviolet index | 13 | 12 | 9 | 6 | 4 | 3 | 3 | 4 | 6 | 9 | 11 | 12 | 8.0 |
| Source: Bureau of Meteorology (UV index)[24] | |||||||||||||
| Source #2: Metoc (sea temperature) [25] | |||||||||||||
| Climate data for Sydney Airport (Eastern Sydney) | |||||||||||||
|---|---|---|---|---|---|---|---|---|---|---|---|---|---|
| Month | Jan | Feb | Mar | Apr | May | Jun | Jul | Aug | Sep | Oct | Nov | Dec | Year |
| Record high °C (°F) | 46.4 (115.5) |
42.9 (109.2) |
41.2 (106.2) |
36.8 (98.2) |
30.0 (86) |
26.8 (80.2) |
27.0 (80.6) |
31.1 (88) |
35.6 (96.1) |
39.1 (102.4) |
43.4 (110.1) |
43.2 (109.8) |
46.4 (115.5) |
| Average high °C (°F) | 26.6 (79.9) |
26.4 (79.5) |
25.3 (77.5) |
22.9 (73.2) |
20.1 (68.2) |
17.6 (63.7) |
17.1 (62.8) |
18.4 (65.1) |
20.6 (69.1) |
22.7 (72.9) |
24.1 (75.4) |
25.8 (78.4) |
22.3 (72.1) |
| Average low °C (°F) | 18.9 (66) |
19.1 (66.4) |
17.6 (63.7) |
14.3 (57.7) |
11.0 (51.8) |
8.7 (47.7) |
7.2 (45) |
8.2 (46.8) |
10.5 (50.9) |
13.3 (55.9) |
15.5 (59.9) |
17.6 (63.7) |
13.5 (56.3) |
| Record low °C (°F) | 9.7 (49.5) |
11.2 (52.2) |
7.4 (45.3) |
6.1 (43) |
3.0 (37.4) |
1.0 (33.8) |
−0.1 (31.8) |
1.2 (34.2) |
2.3 (36.1) |
4.8 (40.6) |
5.9 (42.6) |
8.2 (46.8) |
−0.1 (31.8) |
| Average rainfall mm (inches) | 79.4 (3.126) |
118.4 (4.661) |
88.4 (3.48) |
118.9 (4.681) |
106.2 (4.181) |
100.1 (3.941) |
72.6 (2.858) |
73.7 (2.902) |
61.8 (2.433) |
63.9 (2.516) |
85.1 (3.35) |
73.6 (2.898) |
1,042 (41.024) |
| Average rainy days (≥ 0.2mm) | 10.9 | 12.1 | 12.1 | 10.5 | 11.8 | 10.3 | 9.8 | 8.1 | 8.3 | 10.5 | 11.7 | 10.7 | 126.8 |
| Average afternoon relative humidity (%) | 59 | 62 | 60 | 60 | 59 | 57 | 53 | 48 | 49 | 52 | 57 | 57 | 56 |
| Source #1: Bureau of Meteorology[26] (1981-2010 averages, records 1939-) | |||||||||||||
| Source #2: [27] | |||||||||||||
| Climate data for Pennant Hills (Hills District) | |||||||||||||
|---|---|---|---|---|---|---|---|---|---|---|---|---|---|
| Month | Jan | Feb | Mar | Apr | May | Jun | Jul | Aug | Sep | Oct | Nov | Dec | Year |
| Average high °C (°F) | 27.6 (81.7) |
27.3 (81.1) |
25.5 (77.9) |
22.2 (72) |
19.1 (66.4) |
16.3 (61.3) |
15.8 (60.4) |
17.9 (64.2) |
20.9 (69.6) |
23.4 (74.1) |
25.1 (77.2) |
27.0 (80.6) |
22.3 (72.1) |
| Average low °C (°F) | 16.1 (61) |
16.1 (61) |
14.8 (58.6) |
11.8 (53.2) |
8.6 (47.5) |
6.3 (43.3) |
5.2 (41.4) |
6.1 (43) |
8.1 (46.6) |
10.8 (51.4) |
13.1 (55.6) |
15.0 (59) |
11.0 (51.8) |
| Average precipitation mm (inches) | 100.6 (3.961) |
115.8 (4.559) |
121.7 (4.791) |
104.5 (4.114) |
81.9 (3.224) |
111.4 (4.386) |
80.6 (3.173) |
63.5 (2.5) |
56.3 (2.217) |
69.0 (2.717) |
78.0 (3.071) |
92.1 (3.626) |
1,074.7 (42.311) |
| Average precipitation days (≥ 0.2 mm) | 10.6 | 11.4 | 12.1 | 11.3 | 9.5 | 10.9 | 9.2 | 8.5 | 8.8 | 9.5 | 9.9 | 10.6 | 122.3 |
| Source: [28] | |||||||||||||
| Climate data for Parramatta (Western Sydney) | |||||||||||||
|---|---|---|---|---|---|---|---|---|---|---|---|---|---|
| Month | Jan | Feb | Mar | Apr | May | Jun | Jul | Aug | Sep | Oct | Nov | Dec | Year |
| Record high °C (°F) | 45.5 (113.9) |
44.5 (112.1) |
40.5 (104.9) |
37.0 (98.6) |
29.2 (84.6) |
25.5 (77.9) |
25.9 (78.6) |
30.6 (87.1) |
35.4 (95.7) |
40.1 (104.2) |
42.7 (108.9) |
43.9 (111) |
45.5 (113.9) |
| Average high °C (°F) | 28.5 (83.3) |
27.9 (82.2) |
26.3 (79.3) |
23.8 (74.8) |
20.6 (69.1) |
17.8 (64) |
17.4 (63.3) |
19.1 (66.4) |
21.7 (71.1) |
24.0 (75.2) |
25.4 (77.7) |
27.5 (81.5) |
23.3 (73.9) |
| Average low °C (°F) | 17.6 (63.7) |
17.6 (63.7) |
15.9 (60.6) |
12.8 (55) |
9.9 (49.8) |
7.5 (45.5) |
6.3 (43.3) |
7.1 (44.8) |
9.4 (48.9) |
12.0 (53.6) |
14.1 (57.4) |
16.3 (61.3) |
12.2 (54) |
| Record low °C (°F) | 10.1 (50.2) |
9.2 (48.6) |
6.8 (44.2) |
4.0 (39.2) |
1.4 (34.5) |
0.8 (33.4) |
−1.0 (30.2) |
0.7 (33.3) |
0.7 (33.3) |
3.6 (38.5) |
4.0 (39.2) |
7.7 (45.9) |
−1.0 (30.2) |
| Average rainfall mm (inches) | 100.7 (3.965) |
124.8 (4.913) |
109.3 (4.303) |
88.5 (3.484) |
70.5 (2.776) |
87.1 (3.429) |
45.6 (1.795) |
56.1 (2.209) |
52.8 (2.079) |
68.1 (2.681) |
87.0 (3.425) |
70.2 (2.764) |
958.6 (37.74) |
| Average rainy days (≥ 0.2 or 0.1 mm) | 12.0 | 12.1 | 12.6 | 9.4 | 9.8 | 10.6 | 8.2 | 7.9 | 8.0 | 10.1 | 11.7 | 10.2 | 122.6 |
| Average afternoon relative humidity (%) | 57 | 59 | 59 | 58 | 60 | 59 | 55 | 46 | 46 | 49 | 54 | 55 | 55 |
| Source #1: Bureau of Meteorology[29] | |||||||||||||
| Source #2: [30] | |||||||||||||
| Climate data for Liverpool (South-western Sydney) | |||||||||||||
|---|---|---|---|---|---|---|---|---|---|---|---|---|---|
| Month | Jan | Feb | Mar | Apr | May | Jun | Jul | Aug | Sep | Oct | Nov | Dec | Year |
| Record high °C (°F) | 44.8 (112.6) |
45.8 (114.4) |
41.0 (105.8) |
37.1 (98.8) |
29.6 (85.3) |
25.9 (78.6) |
26.8 (80.2) |
30.5 (86.9) |
35.4 (95.7) |
39.8 (103.6) |
43.3 (109.9) |
43.5 (110.3) |
45.8 (114.4) |
| Average high °C (°F) | 28.2 (82.8) |
27.9 (82.2) |
26.4 (79.5) |
23.9 (75) |
20.5 (68.9) |
17.8 (64) |
17.3 (63.1) |
18.9 (66) |
21.5 (70.7) |
23.7 (74.7) |
25.3 (77.5) |
27.5 (81.5) |
23.2 (73.8) |
| Average low °C (°F) | 17.6 (63.7) |
17.7 (63.9) |
15.9 (60.6) |
12.4 (54.3) |
9.3 (48.7) |
6.3 (43.3) |
4.7 (40.5) |
5.8 (42.4) |
8.3 (46.9) |
11.5 (52.7) |
13.8 (56.8) |
16.2 (61.2) |
11.6 (52.9) |
| Record low °C (°F) | 7.8 (46) |
9.4 (48.9) |
5.0 (41) |
3.2 (37.8) |
−1.5 (29.3) |
−2.0 (28.4) |
−5.0 (23) |
−3.4 (25.9) |
−1.8 (28.8) |
3.3 (37.9) |
4.7 (40.5) |
7.8 (46) |
−5.0 (23) |
| Average precipitation mm (inches) | 97.6 (3.843) |
94.9 (3.736) |
101.0 (3.976) |
85.3 (3.358) |
68.8 (2.709) |
71.3 (2.807) |
40.2 (1.583) |
55.9 (2.201) |
45.6 (1.795) |
61.6 (2.425) |
78.3 (3.083) |
67.4 (2.654) |
867.7 (34.161) |
| Average precipitation days (≥ 0.1 mm) | 10.7 | 10.4 | 10.9 | 8.3 | 9.3 | 8.6 | 7.2 | 7.4 | 8.0 | 9.3 | 10.4 | 9.1 | 109.6 |
| Average afternoon relative humidity (%) | 54 | 55 | 56 | 52 | 58 | 54 | 50 | 44 | 45 | 45 | 49 | 51 | 51 |
| Source: [31] | |||||||||||||
| Climate data for Camden Airport AWS (South-western Sydney) | |||||||||||||
|---|---|---|---|---|---|---|---|---|---|---|---|---|---|
| Month | Jan | Feb | Mar | Apr | May | Jun | Jul | Aug | Sep | Oct | Nov | Dec | Year |
| Record high °C (°F) | 46.4 (115.5) |
45.6 (114.1) |
41.0 (105.8) |
38.5 (101.3) |
29.5 (85.1) |
24.9 (76.8) |
27.0 (80.6) |
30.2 (86.4) |
36.5 (97.7) |
40.5 (104.9) |
42.6 (108.7) |
43.1 (109.6) |
46.4 (115.5) |
| Average high °C (°F) | 29.5 (85.1) |
28.6 (83.5) |
26.8 (80.2) |
23.8 (74.8) |
20.6 (69.1) |
17.7 (63.9) |
17.3 (63.1) |
19.0 (66.2) |
21.9 (71.4) |
24.3 (75.7) |
26.3 (79.3) |
28.5 (83.3) |
23.7 (74.7) |
| Average low °C (°F) | 16.8 (62.2) |
16.8 (62.2) |
14.9 (58.8) |
11.1 (52) |
7.1 (44.8) |
4.6 (40.3) |
3.0 (37.4) |
3.9 (39) |
6.8 (44.2) |
9.9 (49.8) |
13.0 (55.4) |
15.2 (59.4) |
10.2 (50.4) |
| Record low °C (°F) | 7.9 (46.2) |
7.2 (45) |
1.0 (33.8) |
−0.7 (30.7) |
−2.2 (28) |
−5.4 (22.3) |
−6.0 (21.2) |
−4.0 (24.8) |
−1.8 (28.8) |
1.3 (34.3) |
3.8 (38.8) |
5.7 (42.3) |
−6.0 (21.2) |
| Average precipitation mm (inches) | 84.1 (3.311) |
96.9 (3.815) |
89.3 (3.516) |
68.5 (2.697) |
53.5 (2.106) |
67.0 (2.638) |
37.6 (1.48) |
46.0 (1.811) |
39.6 (1.559) |
61.2 (2.409) |
75.8 (2.984) |
56.8 (2.236) |
777.3 (30.602) |
| Average precipitation days (≥ 0.1 mm) | 10.5 | 11.0 | 10.5 | 10.0 | 8.9 | 9.3 | 8.5 | 8.0 | 8.3 | 9.6 | 10.3 | 9.2 | 105.2 |
| Average afternoon relative humidity (%) | 49 | 52 | 52 | 52 | 52 | 53 | 50 | 43 | 44 | 47 | 50 | 46 | 49 |
| Source: [32] | |||||||||||||
| Climate data for Richmond RAAF (Greater Western Sydney) | |||||||||||||
|---|---|---|---|---|---|---|---|---|---|---|---|---|---|
| Month | Jan | Feb | Mar | Apr | May | Jun | Jul | Aug | Sep | Oct | Nov | Dec | Year |
| Record high °C (°F) | 46.4 (115.5) |
47.0 (116.6) |
40.0 (104) |
36.6 (97.9) |
28.5 (83.3) |
26.2 (79.2) |
27.9 (82.2) |
31.3 (88.3) |
35.0 (95) |
40.1 (104.2) |
45.3 (113.5) |
43.7 (110.7) |
47.0 (116.6) |
| Average high °C (°F) | 30.1 (86.2) |
29.0 (84.2) |
27.0 (80.6) |
24.0 (75.2) |
20.8 (69.4) |
18.0 (64.4) |
17.6 (63.7) |
19.7 (67.5) |
22.7 (72.9) |
25.3 (77.5) |
27.1 (80.8) |
28.7 (83.7) |
24.2 (75.5) |
| Average low °C (°F) | 17.7 (63.9) |
17.7 (63.9) |
15.6 (60.1) |
11.6 (52.9) |
7.6 (45.7) |
5.2 (41.4) |
3.7 (38.7) |
4.5 (40.1) |
8.1 (46.6) |
11.0 (51.8) |
14.2 (57.6) |
16.1 (61) |
11.1 (52) |
| Record low °C (°F) | 8.6 (47.5) |
10.3 (50.5) |
6.0 (42.8) |
−0.4 (31.3) |
−2.1 (28.2) |
−4.8 (23.4) |
−5.2 (22.6) |
−4.0 (24.8) |
−1.4 (29.5) |
3.0 (37.4) |
5.3 (41.5) |
7.0 (44.6) |
−5.2 (22.6) |
| Average precipitation mm (inches) | 75.7 (2.98) |
122.9 (4.839) |
75.8 (2.984) |
48.6 (1.913) |
48.9 (1.925) |
47.5 (1.87) |
28.5 (1.122) |
33.2 (1.307) |
48.4 (1.906) |
50.6 (1.992) |
82.7 (3.256) |
59.8 (2.354) |
719.0 (28.307) |
| Average precipitation days (≥ 0.2 mm) | 11.3 | 11.8 | 11.3 | 9.6 | 10.2 | 9.1 | 8.1 | 6.4 | 7.3 | 8.9 | 12.1 | 10.6 | 117.5 |
| Average afternoon relative humidity (%) | 50 | 54 | 52 | 53 | 54 | 55 | 49 | 45 | 42 | 45 | 45 | 48 | 49 |
| Source #1: [33] (averages) | |||||||||||||
| Source #2: [34] (humidity and records only) [35] (Daily maximum temperatures) | |||||||||||||
| Climate data for Katoomba (Blue Mountains) | |||||||||||||
|---|---|---|---|---|---|---|---|---|---|---|---|---|---|
| Month | Jan | Feb | Mar | Apr | May | Jun | Jul | Aug | Sep | Oct | Nov | Dec | Year |
| Record high °C (°F) | 36.4 (97.5) |
37.6 (99.7) |
34.0 (93.2) |
28.7 (83.7) |
22.2 (72) |
19.4 (66.9) |
18.8 (65.8) |
22.0 (71.6) |
26.6 (79.9) |
31.2 (88.2) |
36.0 (96.8) |
35.0 (95) |
37.6 (99.7) |
| Average high °C (°F) | 23.2 (73.8) |
22.4 (72.3) |
20.3 (68.5) |
16.7 (62.1) |
13.1 (55.6) |
10.0 (50) |
9.4 (48.9) |
11.1 (52) |
14.5 (58.1) |
17.6 (63.7) |
20.3 (68.5) |
22.4 (72.3) |
16.8 (62.2) |
| Average low °C (°F) | 12.8 (55) |
12.9 (55.2) |
11.4 (52.5) |
8.7 (47.7) |
6.1 (43) |
3.7 (38.7) |
2.6 (36.7) |
3.3 (37.9) |
5.4 (41.7) |
7.7 (45.9) |
9.9 (49.8) |
11.6 (52.9) |
8.0 (46.4) |
| Record low °C (°F) | 4.2 (39.6) |
3.9 (39) |
1.7 (35.1) |
−0.5 (31.1) |
−2.8 (27) |
−8.2 (17.2) |
−5.4 (22.3) |
−5.6 (21.9) |
−2.8 (27) |
−1.0 (30.2) |
−0.1 (31.8) |
2.4 (36.3) |
−8.2 (17.2) |
| Average precipitation mm (inches) | 162.4 (6.394) |
177.7 (6.996) |
166.2 (6.543) |
121.9 (4.799) |
101.9 (4.012) |
118.6 (4.669) |
84.0 (3.307) |
78.7 (3.098) |
72.2 (2.843) |
92.0 (3.622) |
107.9 (4.248) |
123.2 (4.85) |
1,407.3 (55.406) |
| Average rainy days | 13.5 | 13.2 | 13.4 | 10.4 | 9.6 | 9.9 | 9.4 | 9.4 | 9.4 | 10.7 | 11.7 | 12.4 | 133.0 |
| Average afternoon relative humidity (%) | 58 | 62 | 63 | 65 | 68 | 71 | 67 | 59 | 54 | 53 | 54 | 55 | 61 |
| Source: [36] | |||||||||||||
Seasons
Summer
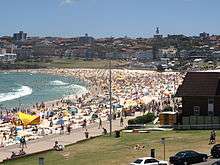
Summer in Sydney tends to vary, but it is generally warm to hot.[37] The western suburbs are significantly hotter than the Sydney CBD by 2–5 °C (4–9 °F) due to urban sprawl exacerbating the urban heat island effect and less exposure to mitigating sea breezes. In extreme occasions, the coast would have a temperature of 25 °C (77 °F) with a sea breeze, while a suburb 30 km (19 mi) inland bakes in 38 °C (100 °F) heat. At times, sea breezes do eventually reach the inland suburbs later in the day and would moderate the temperatures and raise humidity. Temperatures tend to be stable in late summer where they rarely go below 21 °C (70 °F) or over 40 °C (104 °F), unlike late spring and early summer where such extremities would occur.[7] The far-western suburbs, which lie on the foothills of Blue Mountains, have a Föhn effect originating from the Great Dividing Range. The lifting of the warm, dry winds originating from Central Australia over the Blue Mountains forces the air to descend into the Sydney basin, where it would become hotter by the time it reaches the Sydney basin (providing it isn't cooled by the sea breeze further east).[38][39]
When temperatures reach over 30 °C (86 °F), the relative humidity would seldom exceed 45%, although low pressure troughs would increase humidity in some hot days, especially in late summer. Furthermore, most mornings and nights would still be muggy, with the 9am relative humidity ranging from 69% to 75%.[7][40] The average 3pm dewpoint temperature in the summer ranges from 16.2 °C (61.2 °F) at the coast, to 14.4 °C (57.9 °F) inland. Dewpoints would be higher in late summer, reaching 20 °C (68 °F), especially in the mornings and evenings, although they would usually be lower in the heat of the day, dipping as low as 9C in the extremely hot day.[41]
In late spring and summer, Sydney can sometimes get northwesterly winds from the Outback, which are dry and hot, making the temperatures soar above 38 °C (100 °F), with the relative humidity as low as 15%. This happens after the northwesterlies are carried entirely over the continental landmass, not picking up additional moisture from a body of water and retaining most of their heat. On these occasions, Sydney can experience the fury of the desert climate,[42] although they are often ended with a Southerly Buster, which is a cold front that sweeps up from the southeast abruptly cooling the temperature. At times, this cold front would bring thunderstorms, rainfall and gale winds.[43][44]
In the Sydney central business district, an average of 15 days a year have temperatures of more than 30 °C (86 °F) and 3 days with temperatures over 35 °C (95 °F).[7] In contrast, western suburbs such as Liverpool and Penrith have 41 and 67 days with temperatures above 30 °C (86 °F), 10 and 19 days above 35 °C (95 °F), and, 1 and 4 days above 40 °C (104 °F), respectively.[40][45] The highest recorded maximum temperature at Observatory Hill was 45.8 °C (114.4 °F) on 18 January 2013 during a prolonged heat wave across Australia from early December 2012 to late January 2013.[46] The highest recorded minimum at Observatory Hill is 27.6 °C (81.7 °F), registered on 6 February 2011.[7] A similar minimum temperature has also been recorded in the western suburbs.[40]
Autumn
.jpg)
Late summer conditions usually continue until the first few weeks of April where maximum temperatures hover around 25 °C (77 °F) and 29 °C (84 °F) with the dewpoint being around 16 °C (61 °F) and 17 °C (63 °F) on average. Although, unlike late summer, the nights may be seemingly cooler and crispier.
The transition from late summer to autumn is gradual, where noticeably cooler and crisper conditions taking in affect by around mid-April, however summery conditions can persist well into May. In mid-autumn, the highs typically average at a pleasant 24 °C (75 °F), rarely going above 30 °C (86 °F) or below 20 °C (68 °F). In May, the average highs would be around 22 °C (72 °F) and 19 °C (66 °F) with cool and usually humid nights, that seldom dip below 10 °C (50 °F). Wintry highs of 18 °C (64 °F) may be expected in the last week of autumn.[47]
Temperatures in autumn are usually consistent and stable, lacking any extremes that tend to be experienced in spring and summer. Due to moist easterlies that prevail in this season, foggy mornings and overcast conditions should be expected. The average 9am relative humidity in autumn ranges from 72% to 80% in the Sydney region, the highest in the year.[40] The lowest maximum temperature in autumn is 11.3 °C (52.3 °F), recorded in 24 May 1904.[7]
Winter
In winter, the diurnal range in the western suburbs is relatively high, with temperatures being as high as 19 °C (66 °F) during the day and as low as 3 °C (37 °F) at nights. Such low temperatures may provide mild to moderate frost in the western suburbs.[48] Winter in central Sydney tends to be more mild where the lows rarely drop below 7 °C (45 °F), mainly due to proximity to the ocean.[7]
.jpg)
In the west, Liverpool and Richmond have 4 and 38 nights, respectively, where temperatures dip below 2 °C (36 °F). On average, only 1 night in Liverpool and 17 nights in Richmond have lows going below 0 °C (32 °F). The lowest maximum temperature in Liverpool was 8.2 °C (47 °F), recorded on 28 July 1981. Similar low maximums have been recorded in the Sydney region in winter.[40] 9am humidity ranges from 61% to 74% across the Sydney region, with the more higher figures experienced in June mornings.[7][40]
Fog is common in winter mornings, namely in June when moist easterlies dominate. The western suburbs are more prone to fog than Sydney CBD. Heavier rain and cloudiness are also to be expected more in June, on average, than the latter winter months. Highs of 12 °C (54 °F), whilst rare, are not unheard of in winter.[49] During late winter, warm dry westerly winds which dominate may raise the maximum temperatures as high as 30 °C (86 °F) in some instances. The dry westerlies also bring more sunny days, hence why August has the highest sunshine percentage than any other month.[50]
The lowest recorded minimum at Observatory Hill was 2.1 °C (35.8 °F) on 22 June 1932,[7] while the coldest in the Sydney metropolitan area was −8 °C (18 °F), in Richmond. The lowest recorded maximum temperature at Observatory Hill was 7.7 °C (45.9 °F). Although not usually considered a suburb of Sydney, Picton, a town in the Macarthur Region of Sydney, recorded a low of −10.0 °C (14.0 °F) on 16 July 1970.[51]
Spring

Early spring is rapidly transitional. Cool conditions from late winter may continue in September with the maximum temperature dipping as low as 18 °C (64 °F) at the coldest, but due to the drastic transition, temperatures above 30 °C (86 °F) can also be expected in that month. By November, summery conditions begin, with temperatures normally ranging between 24 °C (75 °F) and as high as 30 °C (86 °F), albeit with relatively low humidity.[52]
Spring generally tends to be mostly be sunny, warm and dry with the temperatures averaging at around 21 °C (70 °F) and 25 °C (77 °F) with relatively low dewpoints, hovering around 4 °C (39 °F) and 12 °C (54 °F). Some days may be windy due to the dry westerlies and nights may be relatively cool, where temperatures plummet down to around 7 °C (45 °F) in some suburbs. Hot air from the interior that soar temperatures to over 35 °C (95 °F) can be expected, especially in the months of October and November. These conditions are rare in September, but not unheard of.[48]
Extreme, changeable and inconsistent temperatures are much more prevalent in spring than other seasons. In some occasions, hot dry days are cooled down by a southerly buster, which eventually lower the temperatures from 40 °C (104 °F) to as low as 19 °C (66 °F).[53] Such extremes usually happen in mid-late spring. Other seasons seldom see such fluctuations in a day's span. Furthermore, the diurnal range is higher in this season than it is in autumn.[7]
The lowest maximum temperature in spring was 9.5 °C (49.1 °F), recorded in 8 September 1869.[7] 9am relative humidity is the lowest in the year during spring, ranging from 58% to 68%, with early spring receiving lower figures.[40]
Warm and cool periods
The Bureau of Meteorology has reported that 2002 to 2005 were the warmest summers in Sydney since records began in 1859. 2004 saw an average daily maximum temperature of 23.4 °C (74.1 °F), 2005 of 23.4 °C (74.1 °F), 2002 of 22.9 °C (73.2 °F), and 2003 of 22.7 °C (72.9 °F). The average daily maximum between 1859 and 2004 was 21.6 °C (70.9 °F). Seven (of the ten) warmest years on 151 years of record have occurred in the ten years between 2001 and 2010, with this decade being the warmest on record for minimum temperatures.[54][55]
The Bureau of Meteorology reported that the summer of 2007–08 was the coolest in 11 years, the wettest in six years, the cloudiest in 16 years, and one of only three summers in recorded history to lack a maximum temperature above 31 °C (88 °F).[56]
The Bureau of Meteorology reported that 2009 was a warm year. The average annual daytime temperature at Observatory Hill was 22.9 °C (73.2 °F), which is 0.9 °C (1.6 °F) above the historical annual average. This ranks as seventh highest annual average maximum temperature since records commenced in 1859.[57] 2010 was the equal fourth warmest year on record for Sydney, with an average maximum of 22.6 °C (72.7 °F), which was 0.6 °C (1.1 °F) above the historical annual average.
In 2013, the city had the warmest July and September on record,[58][59] with September being one of the driest. In September, temperatures were 4 °C (7 °F) above average[60] and the city had over seven days where temperatures reached 28 °C (82 °F), making it more similar to November's weather pattern.[61] October 2015 had the warmest nights on record, which were 3.3 °C (5.9 °F) above average.[62] The warming trend continued in 2016 as Sydney's warmest autumn ever was recorded.[63]
Sydney experienced its hottest summer since records began in the summer of 2016-17, with more than 10 days over 35 °C (95 °F). Sydney's 2017 mean temperature of 19.5 °C (67.1 °F) degrees was 1.7 °C (35.1 °F) degrees above the long term average and the second highest value in 158 years of records. The warmest year on record was 2016, with a mean temperature of 19.6 °C (67.3 °F) degrees.[64] On 7 January 2018, Sydney was the hottest place on Earth.[65] On April 2018, Sydney had the longest running hot spell for that month with nine consecutive days of temperatures reaching 25 °C (77 °F). Furthermore, the airport and parts of the western suburbs also broke heat records in that month.[66]
Precipitation
Rainfall is fairly evenly spread through the year, with moderate to low variability. Precipitation is slightly higher during the first half of the year when easterly winds dominate (February–June), and lower in the second half (mainly July–September).[67][68] Due to the unpredictability of rain, the wettest and driest months would change in a yearly basis.[69] Within the city and surrounds, rainfall varies, from around 700 mm (27.56 in) at Badgerys Creek[70] (in the west) to 1,400 mm (55.12 in) at Turramurra (the northeast).[71]
Rain hours are longer in the winter than in the summer. In the warm months, rain comes in heavy downpours in the afternoons, usually cooling the conditions. Sometimes these afternoon showers give away to the sun again. In the cool months, the rain is moderate and it would linger on for the whole day. In some days, rain may come in drizzle form.[7][40] Even in its months of highest rainfall Sydney has relatively few rainy days, on average less than 13 rainy days per month.[72]
_04.jpg)
In the cool months, Sydney CBD is more prone to rain than the inland suburbs, mainly due to the wonted east coast low that strikes between the months of May and August. The low would usually dump more rain in the CBD than the inland areas, usually by 20 mm (0.79 in) or more. Also in winter, thanks to onshore winds and Sydney's coastal proximity, the CBD would be susceptible to some light rain and drizzle – these conditions usually don't penetrate the inland suburbs. However, the western suburbs are more inclined to have heavy rain and thunder in the summer.[74]
The city is rarely affected by cyclones, although remnants of ex-cyclones do affect the city.[75] The city is prone to severe hail storms, such as the 1947 Sydney hailstorm, wind storms, and flash flooding from rain caused either by East Coast Lows (during autumn-winter periods) and ex-tropical cyclone remnants (during summer periods). East Coast Lows are low pressure depressions that can bring significant damage by heavy rain, cyclonic winds and huge swells. Scientists have predicted that rainfall will become more unpredictable and temperatures will be on the rise.[76][77]
Notable events
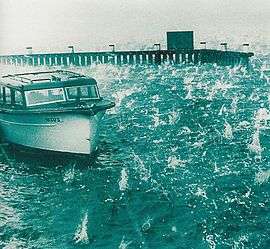
A notable event was the great Sydney flood which occurred on 6 August 1986 (unusual in that month) and dumped a record 327.6 mm (12.90 in) on the city in 24 hours. This caused major traffic problems and damage in many parts of the metropolitan area.[78] The next notable event was the 1999 hailstorm, which caused severe damage in many suburbs. The storm produced hailstones of up to 9 cm (3.5 in) in diameter and resulted in insurance losses of around A$1.7 billion in less than five hours.[79]
In February 2010, Sydney received some of the highest rainfalls in 25 years with 65 mm (2.6 in) of rain falling in one night at Observatory Hill. In the first weeks of the month, some suburbs were hit by thunderstorms which brought heavy rain and gusty winds which cut out power and damaged homes.[80][81][82] The heavy rain was caused by remnants of ex-tropical Cyclone Olga and humid north-easterly winds feeding into the low pressure trough.[83][84] 2010 was an overly wet year with the cloudiest October and the third cloudiest July on record. In 2011, Sydney recorded its wettest July since 1950. The CBD recorded 244 mm (9.61 in) of rain that month. 2011 was also the wettest year since records began in 1858.[85]
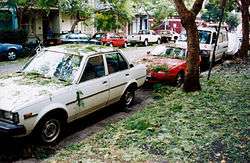
On 18 November 2013, a tornado hit Hornsby, a suburb in the Upper North Shore.[86] The tornado's path was 2 km (1.2 mi) long and 50 m (160 ft) wide. The tornado blew off roofs and toppled large trees. The winds in the tornado reached 140 kilometres per hour (87 mph).[87][88] A total of 12 people were injured in the tornado.[86]
On 15 October 2014, a rainstorm described as a "once-in-a-decade event" hit the Sydney region. Parts of Sydney received the heaviest amount of rain in a span of hours in decades. 94 mm (3.70 in) of rain fell in Strathfield in just over three hours. The winds were cyclonic in nature, with Sydney Airport having over 107 km/h (66 mph) gusts, reaching category 1 strength. This event happened due to the formation of an east coast low, which ignited several other low pressure systems.[89]
On 20 April 2015, Sydney recorded 119.4 mm (4.70 in) of rainfall, the most in any day since February 2002. Winds were "cyclonic" in nature, reaching 135 km/h (84 mph). This east coast low was formed with "a really pronounced upper level trough of cold air that had moved in from Victoria", Mr Sharpe said.[90] The maximum temperature was only 15.4 °C (60 °F), making it the coldest April day since 1983, according to BOM.[91]
Snowfall
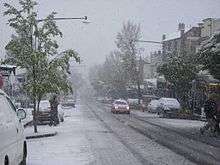
Snow is extremely rare in Sydney and was last reported in the Sydney area in 1836. T. A. Browne, who kept weather observations, noted that "the years 1836, 1837 and 1838 were years of drought, and in one of these years (1836) a remarkable thing happened. There was a fall of snow; we made snowballs at Enmore and enjoyed the usual schoolboy amusements therewith". The Sydney Herald reported on the same incident, saying, "for the first time in the memory of the oldest inhabitants, snow fell in Sydney on the morning of Tuesday last. 27 June 1836, about 7 o'clock in the morning, a drifting fall covered the streets nearly one inch in depth."[92] A July 2008 fall of graupel, or soft hail, mistaken by many for snow, has raised the possibility that the 1836 event was not snow.[93]
The Blue Mountains, a temperate oceanic region bordering on Sydney's metropolitan area, have a reputation for snow in winter, with places such as Katoomba and Blackheath receiving the most snow due to their higher elevation. Despite the reputation though, there are only around five snowy days per year in the upper mountains area with two settled falls per season, and another five to ten days of light snow showers or sleet. Settled snow has become less common in recent decades.[94] It is extremely rare to see snow below Lawson.[95]
Wind
Averaging at 13.8 km/h (8.6 mph), November is the windiest month, whilst March is the calmest at 11.3 km/h (7.0 mph).[7] The prevailing wind annually is northeasterly. In the warm months, only 40% of the time Sydney would get wind directions from the northwest or southwest, which are the dry winds flown from the heated interior of Australia.[96]
Northeasterlies and easterly sea breezes are dominant in late spring to early autumn. Westerlies are dominant in late winter to mid-spring. Southerly busters are expected from November to the end of February. They typically look like as if a sheet of cloud is rolled up like a scroll by the advancing wind. The change of wind (in the warm months) is sometimes very sudden, where it may be fresh northeasterly and in ten minutes a southerly gale.
When the subtropical ridge is north of Sydney in the second half of the year (spring), the wind would come from the west or inland. As the ridge moves south in late summer and autumn, the winds become easterly and, because they are coming off the Tasman Sea, they are moist. It is usually at this time of the year (autumn to early winter) where rainfall would be the highest.[97][98]
Drought
Sydney's climate appears to be becoming drier; The city has had fewer rain days in recent years than shown in the long-term climate table above. In summer, Sydney can go for long periods without rainfall. The other phenomenon that arises from these long, dry and hot periods is bushfires, which occur frequently in the areas surrounding the city. Water supply is a recurring concern for the city during drought periods.
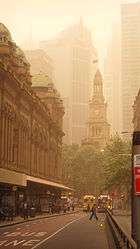
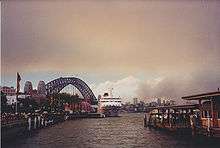
In 2005 the reservoirs reached an all-time low. However, water levels since then have recovered in 2013. The years 2009 and 2010 had dry conditions, according to Bureau of Meteorology.[99] On 23 September 2009, a dust storm that started in South Australia and inland New South Wales blanketed the city with reddish orange skies.[100] It stretched as far north as southern Queensland and it was the worst dust storm in 70 years.[101] During that year, Sydney experienced a number of warm winter days, dry gusty winds and another milder dust storm.[102][103]
.jpg)
In 2011, Sydney had the driest February in 30 years with only 18 mm (0.71 in) of rain falling, which is well below than the average 118 mm (4.6 in). Some of the western suburbs recorded the lowest total February rainfall on record.[104] In September 2013, the combination of dry weather, warm temperatures and strong winds brought early-season bushfires. Major bushfires impacted western Sydney and the Blue Mountains, resulting in some evacuations, closed roads, and destroyed homes.[59]
The summer of 2013-14 was the driest in 72 years. The precipitation of December 2013 and January 2014, inclusively, only added up to 48.4 mm (1.91 in), which is only a quarter of a typical amount for December and January. Observatory Hill only received 17 mm (0.67 in) of rain in January.[105] September 2017 was the driest on record, with the gauge receiving only 0.2 mm (0.0079 in) of rain. Furthermore, in that year, the city received less than half of its long-term average rainfall between July and December.[106]
Many areas of the city bordering bushland have experienced bushfires, notably in 1994 and 2001–02 — these tend to occur during the spring and summer. Heatwaves, which are regularly occurring in recent years, would usually lead to water restrictions and a high risk of bushfires, which sometimes bring a smoky haze to the city. Smog is noticeable in hot days, even without bushfires.[107][108][109]
Aboriginal seasons
The Sydney Basin was in the Tharawal country. Each clan had knowledge of their area and the season changes. These were the seasons of the Sydney region according to the Aboriginal people living there:[110]
- January/February/March (Burran) - Warm and wet
- April/May/June (Marrai'gang) - Wet, becoming cooler
- June/July (Burrugin) - Cold, frosty, short days
- August (Wiritjiribin) - Cold and windy
- September/October (Ngoonungi) - Cool, getting warmer
- November/December (Parra'dowee) - Hot and dry
See also
References
- ↑ "Modelling and simulation of seasonal rainfall" (PDF). Centre for Computer Assisted Research Mathematics and its Applications (CARMA). 20 May 2014. Retrieved 25 February 2016.
Brisbane and Sydney each have a humid sub-tropical or temperate climate with no pronounced dry season...the classification is Cfa
- ↑ "Australian climatic zones". Australian Government. Bureau of Meteorology. Archived from the original on 5 July 2008. Retrieved 21 December 2008.
- ↑ "Climate and the Sydney 2000 Olympic Games". Australian Government. Australian Bureau of Statistics. 24 September 2007. Archived from the original on 10 June 2008. Retrieved 21 December 2008.
- ↑ "Sydney Basin - climate". New South Wales Government. Department of Environment and Climate Change. Retrieved 21 December 2008.
- ↑ Average annual thunder-day map
- ↑ "Weather in Sydney". Weather in Sydney. Tourism Australia 2014. Retrieved 1 November 2014.
- 1 2 3 4 5 6 7 8 9 10 11 12 13 14 "Sydney (Observatory Hill) Period 1981-2010". Bureau of Meteorology. Retrieved 30 October 2016.
- ↑ "Climate statistics for Australian locations Sydney Airport AMO". Bureau of Meteorology.
- ↑ "Australian Climate Averages - Relative Humidity (February)". Bureau of Meteorology. Retrieved 11 January 2018.
- ↑ "Hot Enough? Things are going to get hotter". The Sydney Morning Herald. 2014. Retrieved 30 October 2014.
- ↑ "Sydney heatwave". Daily Liberal. 2013. Retrieved 4 February 2014.
- ↑ "Sea Breezes on the NSW Coast". BOM. Ken Batt. Retrieved 12 November 2014.
- ↑ Batt, K, 1995: Sea breezes on the NSW coast, Offshore Yachting, Oct/Nov 1995, Jamieson Publishing.
- ↑ "About East Coast Lows". Bureau of Meteorology. Retrieved 6 April 2013.
- 1 2 "Sydney area an 'urban heat island' vulnerable to extreme temperatures". The Sydney Morning Herald. 14 January 2016. Retrieved 14 January 2016.
- ↑ "Urban heat island effect - City of Sydney". City of Sydney.com. Retrieved 14 January 2016.
- ↑ "Cooling cities - urban heat island effect" (PDF). aila.org.au. 2013. Retrieved 14 January 2016.
- ↑ "Sydney heatwave: Is it hot enough for you?". The Sydney Morning Herald. 10 October 2013. Retrieved 23 January 2014.
- ↑ "Living in Sydney". Sydney Institute of Business & Technology. Archived from the original on 1 August 2008. Retrieved 21 December 2008.
- ↑ "Water quality and drought". Sydney Water. Archived from the original on 20 November 2009.
- ↑ "Drought". Archived from the original on 15 January 2012.
- ↑ "Sydney (Observatory Hill): all years". Bureau of Meteorology. Retrieved 4 June 2018.
- ↑ "Climate statistics for Australian locations Sydney Airport AMO". Bureau of Meteorology.
- ↑ "Average solar ultraviolet (UV) Index". Bureau of Meteorology. Retrieved 31 March 2017.
- ↑ "Monthly Sydney water temperature chart". World sea temperature. Retrieved 6 August 2017.
- ↑ "Sydney Airport AMO". Climate statistics for Australian locations. Bureau of Meteorology. Retrieved 5 August 2017.
- ↑ http://www.bom.gov.au/jsp/ncc/cdio/weatherData/av?p_nccObsCode=122&p_display_type=dailyDataFile&p_startYear=2016&p_c=-872174116&p_stn_num=066037
http://www.bom.gov.au/jsp/ncc/cdio/weatherData/av?p_nccObsCode=123&p_display_type=dailyDataFile&p_startYear=2016&p_c=-872174312&p_stn_num=066037 - ↑ "Climate statistics for Pennant Hills". Bureau of Meteorology. Retrieved 19 November 2013.
- ↑ "Parramatta". Climate statistics for Australian locations. Bureau of Meteorology. Retrieved 5 August 2017.
- ↑ "Definitions for rainfall". Bureau of Meteorology. Retrieved 5 July 2016.
- ↑ "Climate statistics for Liverpool". Australian Bureau of Meteorology.
- ↑ "Climate statistics for Camden". Australian Bureau of Meteorology. Retrieved 5 October 2017.
- ↑ "Climate Statistics: Richmond RAAF (1993–present)". Bureau of Meteorology. Retrieved 5 August 2017.
- ↑ "Climate Statistics: Richmond RAAF (1928–1994)". Bureau of Meteorology. Retrieved 5 September 2014.
- ↑ "Climate Statistics: Richmond RAAF (1928–1994)". Bureau of Meteorology.
- ↑ "Climate statistics for Katoomba". Australian Bureau of Meteorology. Retrieved 13 April 2013.
- ↑ McDonald, Josephine (2008). Dreamtime superhighway an analysis of Sydney Basin rock art and prehistoric information exchange. Canberra, A.C.T.: ANU E Press. p. 11. ISBN 9781921536175.
- ↑ Sharples, J.J. Mills, G.A., McRae, R.H.D., Weber, R.O. (2010) Elevated fire danger conditions associated with foehn-like winds in southeastern Australia. Journal of Applied Meteorology and Climatology.
- ↑ Sharples, J.J., McRae, R.H.D., Weber, R.O., Mills, G.A. (2009) Foehn-like winds and fire danger anomalies in southeastern Australia. Proceedings of the 18th IMACS World Congress and MODSIM09. 13-17 July, Cairns.
- 1 2 3 4 5 6 7 8 "Liverpool". Climate statistics for Australian locations. Bureau of Meteorology. Retrieved 15 November 2014.
- ↑ Torok, S. and Nicholls, N. 1996. A historical annual temperature dataset for Australia. Aust. Met. Mag., 45, 251–60.
- ↑ Heatwave blows in on a fiery desert wind
- ↑ Sydney Weather
- ↑ Southerly buster
- ↑ "Climate statistics for Penrith Lakes". Bureau of Meteorology. Retrieved 21 Feb 2015.
- ↑ "Special Climate Statement 43 – extreme heat in January 2013" (PDF). Bureau of Meteorology. 1 February 2013. Retrieved 2 February 2013.
- ↑ Power, S., Tseitkin, F., Torok, S., Lavery, B., Dahni, R. and McAvaney, B. 1998. Australian temperature, Australian rainfall and the Southern Oscillation, 1910–1992: coherent variability and recent changes. Aust. Met. Mag., 47, 85–101
- 1 2 Sydney’s Climate
- ↑ Russell, H. C. 1877. Climate of New South Wales: Descriptive, Historical, and Tabular. C. Potter, Sydney, Australia.
- ↑ Evans, J. P., Ji, F., Lee, C., Smith, P., Argüeso, D., and Fita, L. (2014) A regional climate modelling projection ensemble experiment – NARCliM, Geoscientific Model Development, 7(2), 621-629, doi: 10.5194/gmd-7-621- 2014.
- ↑ "Climate statistics for Picton". Bureau of Meteorology. Retrieved 18 November 2013.
- ↑ in August 2013: Warm, dry, sunny end to winter
- ↑ Climate Change in the Sydney Metropolitan Catchments
- ↑ Sydney in 2010: 18th consecutive warm year
- ↑ Special Climate Statement 27 - An exceptional summer heatwave in greater Sydney and the Hunter Valley.
- ↑ Sydney has coolest summer in 11 years in Sydney Climate Summary — NSW Regional Office, Bureau of Meteorology. Retrieved 25 March 2008.
- ↑ Year 2009: Very warm with below average rainfall in Sydney
- ↑ Sydney in July 2013: Warmest July on record
- 1 2 Sydney in September 2013: Warmest September on record
- ↑ Climate Council reports warmest September on record
- ↑ September’s average temperature for Sydney beats 33-year-old record
- ↑ October blew away heat records for any month of any year: Bureau of Meteorology
- ↑ "Warm weather set to continue as smoke from burns lingers in Sydney". ABC. 22 May 2016. Retrieved 31 May 2016.
- ↑ "Weather forecast: Sydney, Brisbane, Adelaide heatwave hell". News.com.au. 10 February 2017. Retrieved 10 February 2017.
- ↑ McInnes, William (2018-01-08). "Sydney clocks the hottest place on Earth as hot weather continues". The Sydney Morning Herald. Retrieved 2018-01-08.
- ↑ Kennedy, Jean (2018-01-08). "Sydney has its hottest April day on record and the endless summer looks set to continue". ABC news. Retrieved 2018-04-10.
- ↑ Climate of Sydney Australia the Good and the Bad
- ↑ Australia > New South Wales > Sydney Archived 18 February 2011 at the Wayback Machine.
- ↑ "Climate statistics for Bankstown Airport". Bureau of Meteorology. Retrieved 13 April 2013.
- ↑ "Badgerys Creek AWS". Climate statistics for Australian locations. Bureau of Meteorology. Retrieved 19 January 2014.
- ↑ Ku-ring-gai Historical Society. "Turramurra".
- ↑ "The Lost Seasons".
- ↑ Bureau of Meteorology. "Extremes in 2014". Commonwealth of Australia. Retrieved 22 January 2015.
- ↑ Storm hits Sydney after scorching day of hot weather
- ↑ Tropical Cyclones in New South Wales
- ↑ < "Weather & climate". Retrieved 25 December 2014.
- ↑ East Coast Lows
- ↑ Rain in Sydney, 1986 in Australian Climate Extremes, Bureau of Meteorology. Retrieved 9 September 2006.
- ↑ "The Sydney Hailstorm - 14 April 1999". Bureau of Meteorology. Retrieved 5 October 2006.
- ↑ "Storm drenches Sydney". UPI.com. 12 February 2010. Retrieved 1 June 2010.
- ↑ "Sydney dries out but regional threatened". News.smh.com.au. 12 February 2010. Retrieved 1 June 2010.
- ↑ "Weather News - Wild storms lash Sydney". Weatherzone.com.au. 13 February 2010. Retrieved 1 June 2010.
- ↑ "Rain swamps Sydney's water catchments". Smh.com.au. 7 February 2010. Retrieved 1 June 2010.
- ↑ Huffer, Julie (10 February 2010). "Heaviest rain in almost 20 years - Environment - News | Hornsby & Upper North Shore Advocate". Hornsby-advocate.whereilive.com.au. Archived from the original on 20 January 2013. Retrieved 1 June 2010.
- ↑ Sydney records its wettest July in 50 years as parts of NSW are declared disaster zones
- 1 2 http://www.news.com.au/national/hornsby-hit-by-mini-tornado-which-sounded-like-a-freight-train-and-ripped-the-roof-off-the-myer-building/news-story/7d529d6b5b7e45385bb11459df16e077
- ↑ Clean-up continues after tornado strikes at Hornsby in Sydney's north
- ↑ "Hornsby was hit by a tornado, Bureau of Meteorology confirms". The Sydney Morning Herald.
- ↑ "'Once every 100 years': what made the Sydney storm so ferocious". The Sydney Morning Herald. 15 October 2014.
- ↑ Sydney weather: It's not a cyclone but it sure felt like one
- ↑ NSW wild weather: Three killed, homes washed away in Dungog as 'cyclonic' winds batter Sydney, Hunter and Central Coast
- ↑ MacDonnell, Freda. Thomas Nelson (Australia) Limited, 1967. Before King's Cross
- ↑ "Sydney weather hail, not snow". AAP. 27 July 2008. Archived from the original on 6 January 2009. Retrieved 11 August 2008.
- ↑ "Blackheath". The Sydney Morning Herald. 15 August 2007. Retrieved 24 June 2013.
- ↑ "Climate Statistics for Australian Locations". web page. Australian Government Bureau of Meteorology. 2011. Retrieved 31 May 2011.
- ↑ Wind & weather statistics Botany Bay/Sydney Airport
- ↑ Sydney weather: fog shrouds city before the sun finally emerges
- ↑ Sydney weather: Planes diverted, ferries cancelled as city blanketed in fog
- ↑ "Year 2009: Very warm with below average rainfall in Sydney". Bom.gov.au. 4 January 2010. Retrieved 19 January 2014.
- ↑ Ramachandran, Arjun (23 September 2009). "Sydney turns red: dust storm blankets city". The Sydney Morning Herald.
- ↑ Brisbane on alert as dust storms sweep east
- ↑ "Sydney in Autumn 2010". Bom.gov.au. Retrieved 1 June 2010.
- ↑ "Third warmest winter on record for Sydney". Bom.gov.au. 27 August 1995. Retrieved 1 June 2010.
- ↑ Sydney in January 2011: Warm start to 2011
- ↑ "Sydney in midst of driest summer for more than 70 years". The Sydney Morning Herald. 3 February 2014. Retrieved 28 January 2015.
- ↑ "2017 brought another year of weather extremes as drought and heat took its toll". Sydney Morning Herald. 2017. Retrieved 2 January 2018.
- ↑ The Best Time to Visit Sydney - Summer
- ↑ "Sydney climate and weather averages". Weather2Travel. 2014. Retrieved 5 October 2014.
- ↑ "Bondi Beach water temperature". Meteo365.com. 2013. Retrieved 5 October 2014.
- ↑ "Indigenous Weather Knowledge". Bom.gov.au. Retrieved 9 December 2014.
External links
| Wikimedia Commons has media related to Weather events in Sydney. |