Clearwater, British Columbia
| Clearwater | |
|---|---|
| District municipality | |
| District of Clearwater[1] | |
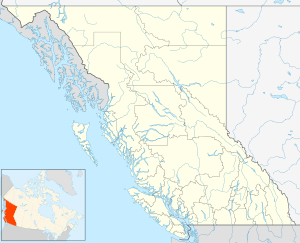 Location of Clearwater in British Columbia | |
| Coordinates: 51°39′N 120°02′W / 51.650°N 120.033°WCoordinates: 51°39′N 120°02′W / 51.650°N 120.033°W | |
| Country | Canada |
| Province | British Columbia |
| Regional District | Thompson-Nicola |
| Incorporated | 2007 |
| Area | |
| • Total | 55.68 km2 (21.50 sq mi) |
| Elevation | 460 m (1,510 ft) |
| Population (2016) | |
| • Total | 2,324 |
| • Density | 42/km2 (110/sq mi) |
| Time zone | UTC−8 (PST) |
| • Summer (DST) | UTC−7 (PDT) |
| Postal Code | V0E |
| Area code(s) | 250 / 778 / 236 |
| Highways |
|
| Website |
www |
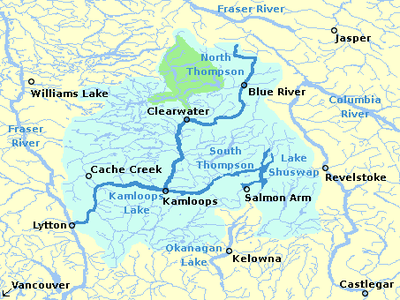
Clearwater is a district municipality in the North Thompson River valley in British Columbia, Canada, where the Clearwater River empties into the North Thompson River. It is located 124 km (77 mi) north of Kamloops. With a population of 2,331, Clearwater's workforce is predominantly employed directly or indirectly by the forest industry.
Overview
The Overlanders expedition to the Cariboo goldfields rafted down the North Thompson River in 1862. When they first arrived at the mouth of the Clearwater River, they named it for its distinct clarity compared to the relatively muddy waters of the North Thompson. The Overlanders also named Raft Mountain, which rises northeast of Clearwater to a height of 2,450 m (8,038 ft).[2]
The forest industry, tourism ,and related outdoors and sports services are major industries in the area. Wells Gray Provincial Park is located just to the north. The park encompasses 5,250 square kilometres, with four rivers, six major lakes, and 39 named waterfalls, including Canada's fourth highest, Helmcken Falls. A municipal government was incorporated in December 2007.
Via Rail's The Canadian calls at the Clearwater railway station three times per week in each direction; this is a flag stop.
Clearwater has two schools: Raft River Elementary with approximately 300 students and Clearwater Secondary School with about 225 students. Clearwater Secondary School's team sports are named "The Raiders" and include soccer, volleyball, and basketball. Currently, they play in single "A" categories.
Climate
| Climate data for Vavenby | |||||||||||||
|---|---|---|---|---|---|---|---|---|---|---|---|---|---|
| Month | Jan | Feb | Mar | Apr | May | Jun | Jul | Aug | Sep | Oct | Nov | Dec | Year |
| Record high °C (°F) | 12.8 (55) |
15.6 (60.1) |
22.8 (73) |
32.8 (91) |
37.8 (100) |
37.8 (100) |
41.1 (106) |
38.3 (100.9) |
35.0 (95) |
26.1 (79) |
20.0 (68) |
15.0 (59) |
41.1 (106) |
| Average high °C (°F) | −3.67 (25.39) |
1.44 (34.59) |
7.44 (45.39) |
14.64 (58.35) |
19.76 (67.57) |
23.05 (73.49) |
26.31 (79.36) |
25.46 (77.83) |
29.39 (84.9) |
10.66 (51.19) |
2.62 (36.72) |
−1.88 (28.62) |
12.10 (53.78) |
| Daily mean °C (°F) | −7.14 (19.15) |
−2.82 (26.92) |
1.91 (35.44) |
7.45 (45.41) |
12.10 (53.78) |
15.59 (60.06) |
18.04 (64.47) |
17.28 (63.1) |
12.28 (54.1) |
5.84 (42.51) |
−0.42 (31.24) |
−4.87 (23.23) |
6.27 (43.29) |
| Average low °C (°F) | −10.55 (13.01) |
−7.0 (19.4) |
−3.63 (25.47) |
0.21 (32.38) |
4.37 (39.87) |
8.07 (46.53) |
9.72 (49.5) |
9.05 (48.29) |
5.14 (41.25) |
0.97 (33.75) |
−3.45 (25.79) |
−7.81 (17.94) |
0.42 (32.76) |
| Record low °C (°F) | −46.10 (−50.98) |
−41.10 (−41.98) |
−31.70 (−25.06) |
−16.10 (3.02) |
−7.20 (19.04) |
−3.30 (26.06) |
0.60 (33.08) |
−1.70 (28.94) |
−8.30 (17.06) |
−19.0 (−2.2) |
−32.00 (−25.6) |
−41.70 (−43.06) |
−46.10 (−50.98) |
| Average precipitation mm (inches) | 43.04 (1.6945) |
24.02 (0.9457) |
22.37 (0.8807) |
25.01 (0.9846) |
37.95 (1.4941) |
53.33 (2.0996) |
46.51 (1.8311) |
42.73 (1.6823) |
35.25 (1.3878) |
39.87 (1.5697) |
40.01 (1.5752) |
43.38 (1.7079) |
453.46 (17.8528) |
| Average rainfall mm (inches) | 9.44 (0.3717) |
9.28 (0.3654) |
16.61 (0.6539) |
24.09 (0.9484) |
37.89 (1.4917) |
53.33 (2.0996) |
46.51 (1.8311) |
42.73 (1.6823) |
35.21 (1.3862) |
38.37 (1.5106) |
23.12 (0.9102) |
10.94 (0.4307) |
347.52 (13.6819) |
| Average snowfall cm (inches) | 33.47 (13.177) |
14.75 (5.807) |
5.76 (2.268) |
0.92 (0.362) |
0.06 (0.024) |
0 (0) |
0 (0) |
0 (0) |
0.04 (0.016) |
1.49 (0.587) |
16.88 (6.646) |
32.45 (12.776) |
105.82 (41.661) |
| Source: [3] | |||||||||||||
References
- ↑ "British Columbia Regional Districts, Municipalities, Corporate Name, Date of Incorporation and Postal Address" (XLS). British Columbia Ministry of Communities, Sport and Cultural Development. Archived from the original on July 13, 2014. Retrieved November 2, 2014.
- ↑ Neave, Roland (2004). Exploring Wells Gray Park, 5th edition. Wells Gray Tours, Kamloops, BC. ISBN 0-9681932-1-8.
- ↑ "Calculation Information for 1950 to 2007 Canadian Normals Data". Environment Canada. Retrieved February 27, 2017.
| Subdivisions | 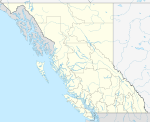 | |
|---|---|---|
| Communities | ||
| Metro areas and agglomerations | ||
| District municipalities |
| |
| ||