Casile, Cabuyao
| Barangay Casile Barangay Kasili (Bahay ni Marcos) | |
|---|---|
| Upland Barangay | |
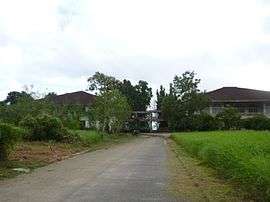 Marcos Twin Mansion in Casile, Cabuyao, Laguna | |
| Nickname(s): Nayon ng Casile, Barrio Casile | |
| Country |
|
| Region | Calabarzon (Region IV-A) |
| Province | Laguna |
| City | Cabuyao |
| Incorporated (settlement) | 1571 |
| Government | |
| • Type | Sangguniang Barangay, with Chairman as its head supported by seven (7) Barangay Councilors |
| • Barangay Chairman | Orlando P. de Sagun |
| Area | |
| • Upland Barangay | 1.18 km2 (1.00387 sq mi) |
| • Urban | 2.6 km2 (1.00387 sq mi) |
| Population (May 2010) | |
| • Upland Barangay | 2,128 |
| • Density | 1,800/km2 (2,100/sq mi) |
| • Urban | 2,128 |
| • Urban density | 820/km2 (2,100/sq mi) |
| Time zone | UTC+8 (PST) |
| • Summer (DST) | Manila |
| Zip Code | 4025 |
| Area code(s) | 049 |
| Demonym | Casileños |
| Range | Marikina Valley Fault Ridge |
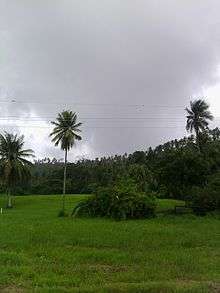
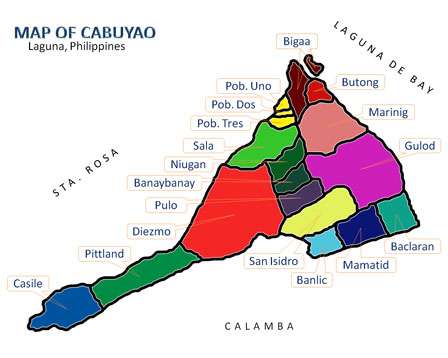
Barangay Casile is an upland barangay and one of the eighteen (18) urbanized[1] barangays comprising the City of Cabuyao in the province of Laguna, Philippines. It is about twenty three kilometres away from the city proper of Cabuyao and is situated at the western and high elevation portion of the city. According to the 2010 Census,[2] it has a population of 2,128 inhabitants (grew from 1,555 in Census 2007[3]). Casile is ranked second to last when it comes to population among the barangays of the town.
Barangay Casile is popular for its natural heritage and the "Matang Tubig River and Falls", which is now the water source that flows in the whole city. It is also the site of the "Marcos Twin Mansion" which is now owned by the government.
Demography
According to 2010 Census,[2] it has a population of 2,128 inhabitants, grew from 1,555 in Census 2007.[3]
West Valley Fault
The West Valley Fault or Marikina Valley Fault System is an active fault, located at the greater of Metro Manila in Marikina.
| No. | Barangay | Rank | Population (2007) | Population (2010) | Population Density (2010) | Annual Growth Rate (Average) |
|---|---|---|---|---|---|---|
| 1 | Baclaran | 9th | 12,683 | 12,192 | 6,985/km2 | |
| 2 | Banay-Banay | 4th | 17,419 | 21,934 | 7.073/km2 | |
| 3 | Banlic | 7th | 9,707 | 12,675 | 5,511/km2 | |
| 4 | Bigaa | 10th | 8,649 | 10,051 | 4,807/km2 | |
| 5 | Butong | 8th | 12,274 | 12,360 | 7,630/km2 | |
| 6 | Casile | 16th | 1,555 | 2,128 | 669/km2 | |
| 7 | Diezmo | 15th | 2,689 | 2,681 | 1,686/km2 | |
| 8 | Gulod | 11th | 10,127 | 9,417 | 2,304/km2 | |
| 9 | Mamatid | 1st | 37,166 | 50,213 | 19,313/km2 | |
| 10 | Marinig | 2nd | 25,619 | 37,169 | 9,494/km2 | |
| 11 | Niugan | 3rd | 21,993 | 26,807 | 7,615/km2 | |
| 12 | Pittland | 18th | 1,627 | 1,740 | 598/km2 | |
| 13 | Pulo | 6th | 13,193 | 15,124 | 5,041/km2 | |
| 14 | Sala | 12th | 7,491 | 8,275 | 5,353/km2 | |
| 15 | San Isidro | 5th | 15,495 | 18,145 | 5,767/km2 | |
| 16 | Barangay I Poblacion | 14th | 2,589 | 2,839 | 12,334/km2 | |
| 17 | Barangay II Poblacion | 17th | 1,947 | 1,840 | 7,886/km2 | |
| 18 | Barangay III Poblacion | 13th | 3,153 | 2,846 | 12,034/km2 | |
| TOTAL | 6th | 205,376 | 248,436 | 5,700/km2 |
See also
References
- ↑ Philippine Standard Geographic Code Archived November 14, 2011, at the Wayback Machine.
- 1 2 "Final Results - 2010 Census of Population". census.gov.ph. Archived from the original on 2012-07-07. Retrieved 2012-06-16.
- 1 2 2007 Census table for Laguna Archived June 7, 2011, at the Wayback Machine. - National Statistics Office
External links
Places adjacent to Casile, Cabuyao | ||||||||||
|---|---|---|---|---|---|---|---|---|---|---|
| ||||||||||
| Aplaya | |
|---|---|
| Central District | |
| Mamatid District | |
| West District | |
| City Proper District | |
Barangays in italics are unofficial
| |
| Geography |
|  | |||
|---|---|---|---|---|---|
| City | |||||
| Officials | |||||
| History |
| ||||
| Barangays | |||||
| Notable people | |||||
| |||||
Coordinates: 14°16′42″N 121°7′29″E / 14.27833°N 121.12472°E