Alberta municipal censuses, 2018
|
| ||
| ||
|
| ||
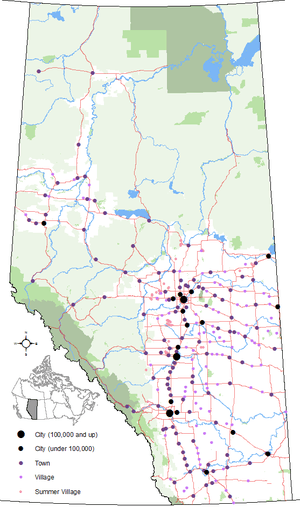 Distribution of Alberta's 269 urban municipalities | ||
Alberta has provincial legislation allowing its municipalities to conduct municipal censuses between April 1 and June 30 inclusive.[1][2] Municipalities choose to conduct their own censuses for multiple reasons such as to better inform municipal service planning and provision, to capitalize on per capita based grant funding from higher levels of government, or to simply update their populations since the last federal census.[3]
Alberta began the year of 2018 with 354 municipalities.[4] Of these, at least 26 (7.3%) conducted a municipal census in 2018.
Some municipalities achieved population milestones as a result of their 2018 censuses. Blackfalds exceeded 10,000 residents, making it eligible for city status. The Municipal District of Greenview No. 16 grew beyond the 6,000 mark for the first time.
Municipal census results
The following summarizes the results of the numerous municipal censuses conducted in 2018.
| 2018 municipal census summary | 2016 federal census comparison[5] | Previous municipal census comparison[6][7] | |||||||||
|---|---|---|---|---|---|---|---|---|---|---|---|
| Municipality | Status | Census date |
2018 pop. |
2016 pop. |
Absolute growth |
Absolute change |
Annual growth rate |
Prev. pop. |
Prev. census year |
Absolute growth |
Annual growth rate |
| Airdrie | City | 68,091[8] | 61,581 | 6,510 | 10.6% | 5.2% | 64,922 | 2017 | 3,169 | 4.9% | |
| Beaumont | Town | 18,829[9] | 17,396 | 1,433 | 8.2% | 4.0% | 18,320 | 2017 | 509 | 2.8% | |
| Blackfalds | Town | 10,125[10] | 9,328 | 797 | 8.5% | 4.2% | 9,916 | 2017 | 209 | 2.1% | |
| Boyle | Village | 925[11] | 845 | 80 | 9.5% | 4.6% | 918 | 2009 | 7 | 0.1% | |
| Bruderheim | Town | 1,359[12] | 1,308 | 51 | 3.9% | 1.9% | 1,348 | 2014 | 11 | 0.2% | |
| Calgary | City | 1,267,344[13] | 1,239,220 | 28,124 | 2.3% | 1.1% | 1,246,337 | 2017 | 21,007 | 1.7% | |
| Cardston | Town | 3,909[14] | 3,585 | 324 | 9% | 4.4% | 3,578 | 2007 | 331 | 0.8% | |
| Chestermere | City | 20,732[15] | 19,887 | 845 | 4.2% | 2.1% | 20,331 | 2017 | 401 | 2.0% | |
| Coalhurst | Town | 2,767[16] | 2,668 | 99 | 3.7% | 1.8% | 2,522 | 2015 | 245 | 3.1% | |
| Cochrane | Town | 27,960[17] | 25,853 | 2,107 | 8.1% | 4.0% | 26,320 | 2017 | 1,640 | 6.2% | |
| Crossfield | Town | 3,308[18] | 2,983 | 325 | 10.9% | 5.3% | 3,055 | 2017 | 253 | 8.3% | |
| Fort Saskatchewan | City | 26,328[19] | 24,149 | 2,179 | 9% | 4.4% | 25,533 | 2017 | 795 | 3.1% | |
| Grande Prairie | City | 69,088[20] | 63,166 | 5,922 | 9.4% | 4.6% | 68,556 | 2015 | 5,922 | 0.3% | |
| MD of Greenview No. 16 | Municipal district | 6,044[21] | 5,583 | 461 | 8.3% | 4.0% | 5,242 | 2013 | 802 | 2.9% | |
| Leduc | City | 32,448[22] | 29,993 | 2,455 | 8.2% | 4.0% | 31,130 | 2017 | 1,318 | 4.2% | |
| Lethbridge | City | 99,769[23] | 92,729 | 7,040 | 7.6% | 3.7% | 98,198 | 2017 | 1,571 | 1.6% | |
| Mackenzie County | Specialized municipality | 12,512[24] | 11,171 | 1,341 | 12% | 5.8% | 11,750 | 2015 | 762 | 2.1% | |
| Okotoks | Town | 29,002[25] | 28,881 | 121 | 0.4% | 0.2% | 28,016 | 2015 | 986 | 1.2% | |
| Raymond | Town | 3,708 | 4,037 | 2017 | |||||||
| Rocky View County | Municipal district | 39,407 | 38,055 | 2013 | |||||||
| Spruce Grove | City | April 4, 2018 | 35,766[26] | 34,066 | 1,700 | 5% | 2.5% | 34,881 | 2017 | 885 | 2.5% |
| St. Albert | City | 66,082[27] | 65,589 | 493 | 0.8% | 0.4% | 64,645 | 2016 | 1,437 | 1.1% | |
| Stirling | Village | 978 | 1,269 | 2017 | |||||||
| Strathcona County | Specialized municipality | 98,381[28] | 98,044 | 337 | 0.3% | 0.2% | 95,597 | 2015 | 2,784 | 1.0% | |
| Strathmore | Town | 13,528[29] | 13,756 | 13,327 | 2015 | ||||||
| RM of Wood Buffalo | Specialized municipality | 71,589 | 81,948 | 2015 | |||||||
Breakdowns
Urban and rural service areas
Strathcona County
| 2018 municipal census summary[30] | 2015 municipal census comparison[30] | |||
|---|---|---|---|---|
| Area | 2018 population |
Previous population |
Absolute growth |
Annual growth rate |
| Sherwood Park urban service area[lower-alpha 1] | 71,332 | 68,782 | 2,550 | 1.2% |
| Rural service area[lower-alpha 2] | 27,049 | 26,815 | 234 | 0.3% |
| Total Strathcona County | 98,381 | 95,597 | 2,784 | 1.0% |
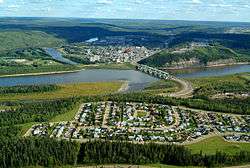
Wood Buffalo
| 2018 municipal census summary | 2015 municipal census comparison | |||
|---|---|---|---|---|
| Area | 2018 population |
Previous population |
Absolute growth |
Annual growth rate |
| Fort McMurray urban service area[lower-alpha 1] | 78,382 | |||
| Rural service area[lower-alpha 2] | 3,566 | |||
| Total RM of Wood Buffalo | 81,948 | |||
Hamlets
The following is a list of hamlet populations determined by the 2018 municipal censuses conducted by Rocky View County, Strathcona County and the Regional Municipality (RM) of Wood Buffalo excluding the urban service areas of Fort McMurray and Sherwood Park that are presented above.
Shadow population counts
Alberta Municipal Affairs defines shadow population as "temporary residents of a municipality who are employed by an industrial or commercial establishment in the municipality for a minimum of 30 days within a municipal census year."[3] The RM of Wood Buffalo conducted a shadow population count in 2018. The following presents the results of this count for comparison with its concurrent municipal census results.
| Municipality | Status | Municipal census population |
Shadow population |
Combined population |
|---|---|---|---|---|
| RM of Wood Buffalo | Specialized municipality | 111,999[35] | ||
See also
Notes
- 1 2 The Fort McMurray and Sherwood Park urban service areas are deemed equivalents of cities.[31][32]
- 1 2 Strathcona County's and the RM of Wood Buffalo's rural service areas are deemed equivalents of municipal districts.[31][32]
References
- ↑ "Municipal Government Act: Revised Statutes of Alberta 2000 Chapter M-26 (Office Consolidation)" (PDF). Alberta Queen's Printer. July 1, 2018. Retrieved July 28, 2018.
- ↑ "Municipal Government Act: Determination of Population Regulation, Alberta Regulation 63/2001 (Office Consolidation)" (PDF). Alberta Queen's Printer. 2017. p. 3. Retrieved July 28, 2018.
- 1 2 "Municipal Census Manual: Requirements and Guidelines for Conducting a Municipal Census" (PDF). Alberta Municipal Affairs. February 2018. p. 8. ISBN 978-1-4601-3770-3. Retrieved July 28, 2018.
- ↑ "2018 Municipal Codes" (PDF). Alberta Municipal Affairs. April 20, 2018. Retrieved July 27, 2018.
- ↑ "Population and dwelling counts, for Canada, provinces and territories, and census subdivisions (municipalities), 2016 and 2011 censuses – 100% data (Alberta)". Statistics Canada. February 8, 2018. Retrieved July 28, 2018.
- ↑ "2017 Municipal Affairs Population List" (PDF). Alberta Municipal Affairs. ISBN 978-1-4601-3652-2. Retrieved July 28, 2018.
- ↑ "2011 Municipal Affairs Population List" (PDF). Alberta Municipal Affairs. October 5, 2011. ISBN 978-0-7785-9738-4. Retrieved July 28, 2018.
- ↑ "2018 Official census results". City of Airdrie. July 4, 2018. Retrieved July 28, 2018.
- ↑ "Beaumont Census Highlights". Town of Beaumont. Retrieved July 28, 2018.
- ↑ "2018 Municipal Census – Draft Report". Town of Blackfalds. July 24, 2018. Retrieved July 28, 2018.
- ↑ https://m.facebook.com/boom941/posts/2459186630761980. Retrieved July 28, 2018. Missing or empty
|title=(help) - ↑ Lindsay Morey (August 23, 2018). "More calling Bruderheim home". Fort Saskatchewan Record. Postmedia Network Inc. Retrieved September 3, 2018.
- ↑ "Civic Census 2018". City of Calgary. July 27, 2018. Retrieved July 28, 2018.
- ↑ "Municipal Census Results". Town of Cardston. September 21, 2018. Retrieved September 21, 2018.
- ↑ "Thank you Chestermere for completing the 2018 census". City of Chestermere. July 17, 2018. Retrieved July 28, 2018.
- ↑ "2018 Municipal Census Count" (PDF). Town of Coalhurst. Retrieved July 28, 2018.
- ↑ "Cochrane's Population Nearing 28,000". Town of Cochrane. May 29, 2018. Retrieved July 28, 2018.
- ↑ Christina Waldner (July 24, 2018). "Crossfield's growth in upward trend". Rocky View Weekly. Great West Newspapers LP. Retrieved July 28, 2018.
- ↑ "Steady growth for Fort Saskatchewan: 2018 municipal census shows a positive sign of continued growth in the City". City of Fort Saskatchewan. June 6, 2018. Retrieved July 28, 2018.
- ↑ "2018 Municipal Census Indicates Growth Continues in Grande Prairie". City of Grande Prairie. August 28, 2018. Retrieved September 1, 2018.
- ↑ "Council Highlights July 23, 2018". Municipal District of Greenview No. 16. July 26, 2018. Retrieved July 28, 2018.
- ↑ "City of Leduc's population nearly doubles in size since 2006". City of Leduc. June 20, 2018. Retrieved July 28, 2018.
- ↑ "Census". City of Lethbridge. Retrieved July 28, 2018.
- ↑ "2018 Municipal census" (PDF). Mackenzie County. August 29, 2018. p. 87. Retrieved September 3, 2018.
- ↑ "Census results indicate stability in town's population". Town of Okotoks. June 26, 2018. Retrieved July 28, 2018.
- ↑ "Demographic Report 2018". City of Spruce Grove. July 2018. Retrieved August 10, 2018.
- ↑ "City releases census results: Initial results show population now 66,082". City of St. Albert. August 13, 2018. Retrieved August 13, 2018.
- 1 2 "Census 2018 Results Report" (PDF). Strathcona County. August 30, 2018. pp. 3&dash, 4. Retrieved September 4, 2018.
- ↑ Adelle Ellis (September 14, 2018). "Census results help determine town budgeting". Strathmore Times. Retrieved September 21, 2018.
- 1 2 "Census population results: Strathcona County historical population". Strathcona County. August 30, 2018. Retrieved September 3, 2018.
- 1 2 "Order in Council 817/94" (PDF). Province of Alberta. December 21, 1994. p. 2. Retrieved December 29, 2013.
- 1 2 "Order in Council 761/95" (PDF). Province of Alberta. December 6, 1995. pp. 2–3. Retrieved December 29, 2013.
- ↑ "Census 2015: Overall Results" (PDF). Strathcona County. p. 4. Retrieved June 1, 2016.
- ↑ "The Municipal Census 2015 Report" (PDF). Regional Municipality of Wood Buffalo. p. 50. Retrieved June 1, 2016.
- ↑ "Census 2018: The count so far ..." Regional Municipality of Alberta. Retrieved September 3, 2018.