Electricity sector in India
India is the world's third largest producer and third largest consumer of electricity.[6][7] The national electric grid in India has an installed capacity of 370.106 GW as of 31 March 2020.[3] Renewable power plants, which also include large hydroelectric plants, constitute 35.86% of India's total installed capacity. During the 2018-19 fiscal year, the gross electricity generated by utilities in India was 1,372 TWh and the total electricity generation (utilities and non utilities) in the country was 1,547 TWh.[5][8] The gross electricity consumption in 2018-19 was 1,181 kWh per capita.[5] In 2015-16, electric energy consumption in agriculture was recorded as being the highest (17.89%) worldwide.[5] The per capita electricity consumption is low compared to most other countries despite India having a low electricity tariff.[9]
| Data | |
|---|---|
| Electricity coverage | 99.7% (9 January 2019)[1][2] |
| Installed capacity | 370.11 GW[3] |
| Share of fossil energy | 79.8% |
| Share of renewable energy | 17.3% |
| GHG emissions from electricity generation (2017) | 2,194.74 MtCO2[4] |
| Average electricity use (2018-19) | 1,181 kWh per capita |
| Transmission & Distribution losses (2017-18) | 21.04%[5] |
| Residential consumption | 24.76% (2018-19[5]) |
| Industrial consumption (% of total, 2018-19) | 41.16%[5] (2018-19) |
| Agriculture consumption (% of total, 2018-19) | 17.69%[5] |
| Commercial consumption (% of total, 2018-19) | 8.24%[5] |
| Traction consumption (% of total, 2018-19) | 1.52%[5] |
| Services | |
| Share of private sector in generation | 46% (March 2019) |
| Institutions | |
| Responsibility for policy-setting | Ministry of Power |
| Responsibility for renewable energy | Ministry of New and Renewable Energy |
| Responsibility for the environment | Ministry of Environment, Forest and Climate Change |
| Electricity sector law | Electricity Act, 2003 |
India has a surplus power generation capacity but lacks adequate distribution infrastructure. To address this, the Government of India launched a program called "Power for All" in 2016.[10] The program was accomplished by December 2018 in providing the necessary infrastructure to ensure uninterrupted electricity supply to all households, industries, and commercial establishments.[11] Funding was made through a collaboration between the Government of India and its constituent states.[12][13]
India's electricity sector is dominated by fossil fuels, in particular coal, which during the 2018-19 fiscal year produced about three-quarters of the country's electricity. The government is making efforts to increase investment in renewable energy. The government's National Electricity Plan of 2018 states that the country does not need more non-renewable power plants in the utility sector until 2027, with the commissioning of 50,025 MW coal-based power plants under construction and addition of 275,000 MW total renewable power capacity after the retirement of nearly 48,000 MW old coal-fired plants.[14][15]
History

- Coal: 205,134.5 MW (55.4%)
- Large Hydro: 45,699.22 MW (12.3%)
- Small Hydro: 4,683.16 MW (1.3%)
- Wind Power: 37,693.75 MW (10.2%)
- Solar Power: 34,627.82 MW (9.4%)
- Biomass: 10,022.95 MW (2.7%)
- Nuclear: 6,780 MW (1.8%)
- Gas: 24,955.36 MW (6.7%)
- Diesel: 509.71 MW (0.1%)
The first demonstration of electric light in Calcutta (now Kolkata) was conducted on 24 July 1879 by P.W. Fleury & Co. On 7 January 1897, Kilburn & Co secured the Calcutta electric lighting license as agents of the Indian Electric Co, which was registered in London on 15 January 1897. A month later, the company was renamed the Calcutta Electric Supply Corporation. The control of the company was transferred from London to Calcutta only in 1970. The introduction of electricity in Calcutta was a success, and power was next introduced in Bombay (now Mumbai).[17] The first electric lighting demonstration in Mumbai was in 1882 at Crawford Market and the Bombay Electric Supply & Tramways Company (BEST) set up a generating station in 1905 to provide electricity for the tramway.[18]
The first hydroelectric installation in India was installed near a tea estate at Sidrapong for the Darjeeling Municipality in 1897.[19] The first electric street light in Asia was lit on 5 August 1905 in Bangalore.[20] The first electric train in the country ran on the Harbour Line between Bombay's Victoria Terminus and Kurla on 3 February 1925.[21] On 18 August 2015, Cochin International Airport became the world's first fully solar powered airport with the inauguration of a dedicated solar plant.[22][23]
India began using grid management on a regional basis in the 1960s. Individual State grids were interconnected to form 5 regional grids covering mainland India, the Northern, Eastern, Western, North Eastern and Southern Grids. These regional links were established to enable transmission of surplus electricity between states in each region. In the 1990s, the Indian government began planning for a national grid. Regional grids were initially interconnected by asynchronous high-voltage direct current (HVDC) back-to-back links facilitating the limited exchange of regulated power. The links were subsequently upgraded to high capacity synchronous links.[24]
The first interconnection of regional grids was established in October 1991 when the North Eastern and Eastern grids were interconnected. The Western Grid was interconnected with these grids in March 2003. The Northern grid was also interconnected in August 2006, forming a Central Grid that was synchronously connected and operating at one frequency.[24] The sole remaining regional grid, the Southern Grid, was synchronously interconnected to the Central Grid on 31 December 2013 with the commissioning of the 765 kV Raichur-Solapur transmission line, establishing the National Grid.[24][25]
By the end of the calendar year 2015, despite poor hydroelectricity generation, India had become a power surplus nation with huge power generation capacity idling for want of demand.[26][27][28] The calendar year 2016 started with steep falls in the international price of energy commodities such as coal, diesel oil, naphtha, bunker fuel, and liquefied natural gas (LNG), which are used in electricity generation in India.[29][30][31][32][33] As a result of the global glut in petroleum products, these fuels became cheap enough to compete with pit head coal-based power generators.[34] Coal prices have also fallen.[35] Low demand for coal has led to coal stocks building up at power stations as well as coal mines.[36] New installations of renewable energy in India surpassed installations of fossil fuel for the first time in 2016-17.[37]
On March 29, 2017, the Central Electricity Authority (CEA) stated that for the first time India has become a net exporter of electricity. India exported 5,798 GWh to neighbouring countries, against a total import of 5,585 GWh.
Installed capacity
The total installed power generation capacity is the sum of utility capacity, captive power capacity, and other non-utilities
Utility power
| Installed Capacity as on |
Thermal (MW) | Nuclear (MW) |
Renewable (MW) | Total (MW) | % Growth (on yearly basis) | |||||
|---|---|---|---|---|---|---|---|---|---|---|
| Coal | Gas | Diesel | Sub-Total Thermal |
Hydro | Other Renewable |
Sub-Total Renewable | ||||
| 31-Dec-1947 | 756 | - | 98 | 854 | - | 508 | - | 508 | 1,362 | - |
| 31-Dec-1950 | 1,004 | - | 149 | 1,153 | - | 560 | - | 560 | 1,713 | 8.59% |
| 31-Mar-1956 | 1,597 | - | 228 | 1,825 | - | 1,061 | - | 1,061 | 2,886 | 13.04% |
| 31-Mar-1961 | 2,436 | - | 300 | 2,736 | - | 1,917 | - | 1,917 | 4,653 | 12.25% |
| 31-Mar-1966 | 4,417 | 137 | 352 | 4,903 | - | 4,124 | - | 4,124 | 9,027 | 18.80% |
| 31-Mar-1974 | 8,652 | 165 | 241 | 9,058 | 640 | 6,966 | - | 6,966 | 16,664 | 10.58% |
| 31-Mar-1979 | 14,875 | 168 | 164 | 15,207 | 640 | 10,833 | - | 10,833 | 26,680 | 12.02% |
| 31-Mar-1985 | 26,311 | 542 | 177 | 27,030 | 1,095 | 14,460 | - | 14,460 | 42,585 | 9.94% |
| 31-Mar-1990 | 41,236 | 2,343 | 165 | 43,764 | 1,565 | 18,307 | - | 18,307 | 63,636 | 9.89% |
| 31-Mar-1997 | 54,154 | 6,562 | 294 | 61,010 | 2,225 | 21,658 | 902 | 22,560 | 85,795 | 4.94% |
| 31-Mar-2002 | 62,131 | 11,163 | 1,135 | 74,429 | 2,720 | 26,269 | 1,628 | 27,897 | 105,046 | 4.49% |
| 31-Mar-2007 | 71,121 | 13,692 | 1,202 | 86,015 | 3,900 | 34,654 | 7,760 | 42,414 | 132,329 | 5.19% |
| 31-Mar-2012 | 112,022 | 18,381 | 1,200 | 131,603 | 4,780 | 38,990 | 24,503 | 63,493 | 199,877 | 9.00% |
| 31-Mar-2017 | 192,163 | 25,329 | 838 | 218,330 | 6,780 | 44,478 | 57,260 | 101,138 | 326,841 | 10.31% |
| 31-Mar-2018 | 197,171 | 24,897 | 838 | 222,906 | 6,780 | 45,293 | 69,022 | 114,315 | 344,002 | 5.25% |
| 31-Mar-2019[3] | 200,704 | 24,937 | 637 | 226,279 | 6,780 | 45,399 | 77,641 | 123,040 | 356,100 | 3.52% |
The total installed capacity stated is after subtracting retired capacity (if any). Nearly 40,000 MW is in various stages of construction as on 31 March 2019.[38]
The total installed utility power generation capacity as on 31 July 2019 by sector and type is given below.[39]
| Sector | Thermal (MW) | Nuclear (MW) |
Renewable (MW) | Total (MW) | % | |||||
|---|---|---|---|---|---|---|---|---|---|---|
| Coal | Lignite | Gas | Diesel | Sub-Total Thermal |
Hydro | Other Renewable | ||||
| State | 64,736.50 | 1,290.00 | 7,118.71 | 363.93 | 73,509.13 | 0.00 | 26,958.50 | 2,349.98 | 102,817.61 | 29 |
| Central | 56,340.00 | 3,140.00 | 7,237.91 | 0.00 | 66,717.91 | 6,780.00 | 15,046.72 | 1,632.30 | 90,176.93 | 25 |
| Private | 74,733.00 | 1,830.00 | 10,580.60 | 273.70 | 87,417.30 | 0.00 | 3,394.00 | 76,650.52 | 167,461.82 | 46 |
| All India | 195,809.50 | 6,260.00 | 24,937.22 | 637.63 | 227,644.34 | 6,780.00 | 45,399.22 | 80,632.80 | 360,456.37 | 100 |
Captive power
The installed captive power generation capacity (above 1 MW capacity) associated with industry-owned plants is 58,000 MW as of 31 March 2019, In fiscal year 2018-19 175,000 GWh was generated.[5][40] Diesel power generation sets of 75,000 MW capacity (excluding sets of size above 1 MW and below 100 kVA) are also installed in the country.[41][42] In addition, there are a large number of diesel generators of capacity less than 100 kVA to cater to emergency power needs during power outages in all sectors.[43]
| Number | Source | Captive Power Capacity (MW) | Share | Electricity generated (GWh) | Share |
|---|---|---|---|---|---|
| 1 | Coal | 34,833 | 60.06% | 141,137 | 80.64% |
| 2 | Hydroelectricity | 48 | 0.08% | 97 | 0.09% |
| 3 | Renewable energy source | 1,881 | 3.24% | 2,258 | 1.28% |
| 4 | Natural Gas | 7,753 | 13.37% | 23,785 | 13.58% |
| 5 | Oil | 13,485 | 23.25% | 7,723 | 4.41% |
| Total | 58,000 | 100.00% | 175,000 | 100.00% |
Installed capacity by state or territory
The latest break up of state wise installed capacity is given in the table below.[44][45]
| State/Union Territory | Thermal (in MW) | Nuclear (in MW) |
Renewable (in MW) | Total (in MW) |
% of Total | |||||
|---|---|---|---|---|---|---|---|---|---|---|
| Coal | Gas | Diesel | Sub-Total Thermal |
Hydro | Other Renewable | Sub-Total Renewable | ||||
| Maharashtra | 24,669.27 | 3,475.93 | - | 28,145.20 | 690.14 | 3,331.84 | 6,205.65 | 9,537.4 | 38,372.83 | 13.91% |
| Gujarat | 16,010.27 | 6,806.09 | - | 22,816.36 | 559.32 | 772.00 | 4,802.40 | 5,574.4 | 28,950.08 | 10.49% |
| Madhya Pradesh | 11,126.39 | 257.18 | - | 11,383.57 | 273.24 | 3,223.66 | 1,670.34 | 4,894.00 | 16,550.81 | 6.00% |
| Chhattisgarh | 13,193.49 | - | - | 13,193.49 | 47.52 | 120.00 | 327.18 | 447.18 | 13,688.19 | 4.96% |
| Goa | 326.17 | 48.00 | - | 374.17 | 25.80 | - | 0.05 | 0.05 | 400.02 | 0.14% |
| Dadra & Nagar Haveli | 44.37 | 27.10 | - | 71.47 | 8.46 | - | - | - | 79.93 | 0.03% |
| Daman & Diu | 36.71 | 4.20 | - | 40.91 | 7.38 | - | - | - | 48.29 | 0.02% |
| Central - Unallocated | 1,622.35 | 196.91 | - | 1,819.26 | 228.14 | - | - | - | 2,047.40 | 0.74% |
| Western Region | 67,029.01 | 10,815.41 | - | 77,844.42 | 1,840.00 | 7,447.50 | 13,005.62 | 20,453.12 | 100,137.54 | 36.29% |
| Rajasthan | 9,400.72 | 825.03 | - | 10,225.75 | 573.00 | 1,719.30 | 4,710.50 | 6,429.8 | 17,228.55 | 6.24% |
| Uttar Pradesh | 11,677.95 | 549.97 | - | 12,227.92 | 335.72 | 2,168.30 | 989.86 | 3,158.16 | 15,721.80 | 5.70% |
| Punjab | 6,444.88 | 288.92 | - | 6,733.80 | 208.04 | 3,145.13 | 503.42 | 3,648.55 | 10,590.38 | 3.84% |
| Haryana | 6,527.53 | 560.29 | - | 7,087.82 | 109.16 | 1,456.83 | 138.60 | 1,595.43 | 8,792.41 | 3.19% |
| Delhi | 5,001.87 | 2,366.01 | - | 7,367.88 | 122.08 | 822.05 | 34.71 | 856.76 | 8,346.72 | 3.03% |
| Himachal Pradesh | 152.02 | 61.88 | - | 213.90 | 34.08 | 3,421.51 | 728.91 | 4,150.42 | 4,398.40 | 1.59% |
| Uttarakhand | 399.50 | 69.35 | - | 468.85 | 22.28 | 2,441.82 | 244.32 | 2,686.14 | 3,177.27 | 1.15% |
| Jammu & Kashmir | 329.32 | 304.14 | - | 633.46 | 77.00 | 1,805.21 | 156.53 | 1,961.74 | 2,672.20 | 0.97% |
| Chandigarh | 32.54 | 15.32 | - | 47.86 | 8.84 | 62.32 | 5.04 | 67.36 | 124.06 | 0.04% |
| Central - Unallocated | 977.19 | 290.35 | - | 1,267.54 | 129.80 | 754.30 | - | 754.30 | 2,151.64 | 0.78% |
| Northern Region | 40,943.50 | 5,331.26 | 12.99 | 46,274.76 | 1,620.00 | 17,796.77 | 7,511.89 | 25,308.66 | 73,203.42 | 26.53% |
| Tamil Nadu | 10,075.10 | 1026.30 | 411.66 | 11,513.06 | 986.50 | 2,182.20 | 8,423.15 | 10,605.35 | 23,104.91 | 8.37% |
| Karnataka | 6,408.46 | - | 234.42 | 6,642.88 | 475.86 | 3,599.80 | 4552.48 | 8,152.28 | 15,271.02 | 5.53% |
| Andhra Pradesh | 5,849.21 | 1,672.65 | 16.97 | 7,538.83 | 127.16 | 1,721.99 | 2,002.65 | 3,724.64 | 11,390.64 | 4.13% |
| Telangana | 5,598.47 | 1,697.75 | 19.83 | 7,316.05 | 148.62 | 2012.54 | 62.75 | 2,075.29 | 9,539.96 | 3.46% |
| Kerala | 1,038.69 | 533.58 | 234.60 | 1,806.87 | 228.60 | 1881.50 | 204.05 | 2,085.55 | 4,121.02 | 1.49% |
| Puducherry | 249.32 | 32.50 | - | 281.82 | 52.78 | - | 0.03 | 0.03 | 334.63 | 0.12% |
| Central - NLC | 100.17 | - | - | 100.17 | - | - | - | - | 100.17 | 0.04% |
| Central - Unallocated | 1,523.08 | - | - | 1,523.08 | 300.48 | - | - | - | 1,823.56 | 0.66% |
| Southern Region | 30,842.50 | 4,962.78 | 917.48 | 36,722.76 | 2,320.00 | 11,398.03 | 15,245.11 | 26,643.14 | 65,685.90 | 23.81% |
| West Bengal | 8,083.83 | 100.00 | - | 8,183.83 | - | 1,248.30 | 131.45 | 1,379.75 | 9,563.84 | 3.47% |
| Odisha | 6,753.04 | - | - | 6,753.04 | - | 2,166.93 | 116.55 | 2,283.48 | 9,036.52 | 3.28% |
| DVC | 7,160.66 | 90.00 | - | 7,250.66 | - | 193.26 | - | 193.26 | 7,443.92 | 2.70% |
| Bihar | 2,516.24 | - | - | 2,516.24 | - | 129.43 | 114.12 | 243.55 | 2,759.79 | 1.00% |
| Jharkhand | 2,404.93 | - | - | 2,404.93 | - | 200.93 | 20.05 | 220.98 | 2,625.91 | 0.95% |
| Sikkim | 92.10 | - | - | 92.10 | - | 174.27 | 52.11 | 226.38 | 318.48 | 0.12% |
| Central - Unallocated | 1,572.07 | - | - | 1,572.07 | - | - | - | - | 1,572.07 | 0.57% |
| Eastern Region | 28,582.87 | 190.00 | - | 28,772.87 | - | 4,113.12 | 434.54 | 4,547.66 | 33,320.53 | 12.08% |
| Assam | 187.00 | 718.62 | - | 905.62 | - | 429.72 | 34.11 | 463.83 | 1,369.45 | 0.50% |
| Tripura | 18.70 | 538.82 | - | 557.52 | - | 62.37 | 21.01 | 83.38 | 640.90 | 0.23% |
| Meghalaya | 17.70 | 105.14 | - | 122.84 | - | 356.58 | 31.03 | 387.61 | 510.45 | 0.19% |
| Arunachal Pradesh | 12.35 | 43.06 | - | 55.41 | - | 97.57 | 104.64 | 202.21 | 257.62 | 0.09% |
| Manipur | 15.70 | 67.98 | 36.00 | 119.68 | - | 80.98 | 5.45 | 86.43 | 206.11 | 0.07% |
| Nagaland | 10.70 | 46.35 | - | 57.05 | - | 53.32 | 29.67 | 82.99 | 140.04 | 0.05% |
| Mizoram | 10.35 | 38.29 | - | 48.64 | - | 34.31 | 36.47 | 70.78 | 119.42 | 0.04% |
| Central - Unallocated | 37.50 | 104.44 | - | 141.94 | - | 127.15 | - | 127.15 | 269.09 | 0.10% |
| North-Eastern Region | 310.00 | 1,662.70 | 36.00 | 2,008.70 | - | 1,242.00 | 262.38 | 1,504.38 | 3,513.08 | 1.27% |
| Andaman & Nicobar | - | - | 40.05 | 40.05 | - | - | 10.35 | 10.35 | 50.40 | 0.02% |
| Lakshadweep | - | - | - | - | - | - | 0.75 | 0.75 | 0.75 | 0.00% |
| Islands | - | - | 40.05 | 40.05 | - | - | 11.10 | 11.10 | 51.15 | 0.02% |
| Total | 167,707.88 | 22,962.15 | 993.53 | 191,663.56 | 5,780 | 41,997.42 | 36,470.64 | 78,468.06 | 275,911.62 | 100.00% |
Demand
- Demand trend
During the fiscal year 2018-19, the utility energy availability was 1,267.5 billion KWh, a short fall relative to requirements of 7.07 billion KWh (-0.6%). Peak load met was 175,528 MW, 1,494 MW (-0.8%) below requirements. In the 2019 Load Generation Balance report, India's Central Electricity Authority anticipated energy surplus and peak surplus to be 5.8% and 8.4%, respectively, for the 2019–20 fiscal year.[47] Power would be made available to few states expected to face shortages from states with a surplus, through regional transmission links.[48] From calendar year 2015 onwards, power generation in India has been less of a problem than power distribution.[49][27][28][50][51]
- Demand drivers
Nearly 0.28% of Indian households (0.6 million) have no access to electricity.[1] The International Energy Agency estimates India will add between 600 GW to 1,200 GW of additional new power generation capacity before 2050.[52] This added new capacity is similar in scale to the 740 GW total power generation capacity of the European Union (EU-27) in 2005. The technologies and fuel sources India adopts as it adds this electricity generation capacity may have a significant impact on global resource usage and environmental issues.[53] The demand for electricity for cooling (HVAC) is projected to grow rapidly.[54]
About 136 million Indians (11%) use traditional fuels – firewood, agricultural waste and dry animal dung fuel – for cooking and general heating needs.[55] These traditional fuels are burnt in cook stoves, sometimes known as chulah or chulha.[56] Traditional fuel is an inefficient source of energy, and its burning releases high levels of smoke, PM10 particulate matter, NOX, SOX, PAHs, polyaromatics, formaldehyde, carbon monoxide and other air pollutants, affecting outdoor air quality, haze and smog, chronic health problems, damage to forests, ecosystems and global climate.[57][58][59] The World Health Organization estimates that 300,000 to 400,000 people in India die of indoor air pollution and carbon monoxide poisoning every year because of biomass burning and use of chulahs.[60] Burning traditional fuel in conventional cook stoves is estimated to release 5–15x more pollutants than industrial combustion of coal, and is unlikely to be replaced until electricity or clean-burning fuel and combustion technologies become reliably available and widely adopted in rural and urban India. The growth of the electricity sector in India may help find a sustainable alternative to traditional fuel burning.
In addition to air pollution problems, a 2007 study finds that discharge of untreated sewage is the single most important cause for pollution of surface and groundwater in India. The majority of government-owned sewage treatment plants remain closed most of the time in part because of the lack of a reliable electricity supply to operate the plants. Uncollected waste accumulates in urban areas, causing unhygienic conditions, and release heavy metals and pollutants that leaches to surface and groundwater.[61][62] A reliable supply of electricity is required to address India's water pollution and associated environmental issues.
Other drivers for India's electricity sector are its rapidly growing economy, rising exports, improving infrastructure and increasing household incomes.
| Year* | Population (millions) |
Consumption (GWh) |
% of Total | Per-Capita Consumption (in kWh) | |||||
|---|---|---|---|---|---|---|---|---|---|
| Domestic | Commercial | Industrial | Traction | Agriculture | Misc | ||||
| 1947** | 330 | 4,182 | 10.11% | 4.26% | 70.78% | 6.62% | 2.99% | 5.24% | 16.3 |
| 1950** | 376 | 5,610 | 9.36% | 5.51% | 72.32% | 5.49% | 2.89% | 4.44% | 18.2 |
| 1956 | 417 | 10,150 | 9.20% | 5.38% | 74.03% | 3.99% | 3.11% | 4.29% | 30.9 |
| 1961 | 458 | 16,804 | 8.88% | 5.05% | 74.67% | 2.70% | 4.96% | 3.75% | 45.9 |
| 1966 | 508 | 30,455 | 7.73% | 5.42% | 74.19% | 3.47% | 6.21% | 2.97% | 73.9 |
| 1974 | 607 | 55,557 | 8.36% | 5.38% | 68.02% | 2.76% | 11.36% | 4.13% | 126.2 |
| 1979 | 681 | 84,005 | 9.02% | 5.15% | 64.81% | 2.60% | 14.32% | 4.10% | 171.6 |
| 1985 | 781 | 124,569 | 12.45% | 5.57% | 59.02% | 2.31% | 16.83% | 3.83% | 228.7 |
| 1990 | 870 | 195,098 | 15.16% | 4.89% | 51.45% | 2.09% | 22.58% | 3.83% | 329.2 |
| 1997 | 997 | 315,294 | 17.53% | 5.56% | 44.17% | 2.09% | 26.65% | 4.01% | 464.6 |
| 2002 | 1089 | 374,670 | 21.27% | 6.44% | 42.57% | 2.16% | 21.80% | 5.75% | 671.9 |
| 2007 | 1179 | 525,672 | 21.12% | 7.65% | 45.89% | 2.05% | 18.84% | 4.45% | 559.2 |
| 2012 | 1,220 | 785,194 | 22.00% | 8.00% | 45.00% | 2.00% | 18.00% | 5.00% | 883.6 |
| 2013 | 1,235 | 824,301 | 22.29% | 8.83% | 44.40% | 1.71% | 17.89% | 4.88% | 914.4 |
| 2014 | 1,251 | 881,562 | 22.95% | 8.80% | 43.17% | 1.75% | 18.19% | 5.14% | 957 |
| 2015 | 1,267 | 938,823 | 23.53% | 8.77% | 42.10% | 1.79% | 18.45% | 5.37% | 1010.0 |
| 2016 | 1,283 | 1,001,191 | 23.86% | 8.59% | 42.30% | 1.66% | 17.30% | 6.29% | 1075 |
| 2017 | 1,299 | 1,066,268 | 24.32% | 9.22% | 40.01% | 1.61% | 18.33% | 6.50% | 1122 |
| 2018 | 1,322 | 1,130,244 | 24.20% | 8.51% | 41.48% | 1.27% | 18.08% | 6.47% | 1149 |
| 2019 | 1,345 | 1,196,309 | 24.76% | 8.24% | 41.16% | 1.52% | 17.69% | 6.63% | 1181 |
* Data from fiscal year ending on 31 March of each year.
** Refers to fiscal year ending on 31 December.
Note: Per Capita Consumption=(gross electricity generation by all sources plus net import) / mid year population. 'Consumption' is 'gross electricity generation by all sources plus net import' after subtracting transmission loses and auxiliary consumption in electricity generation.
The per capita annual domestic electricity consumption in India during the year 2009 was 96 kWh in rural areas and 288 kWh in urban areas for those with access to electricity. Globally the per capita annual average is 2,600 kWh and in the European Union it is 6,200 kWh.[63]
Rural and Urban electrification
India's Ministry of Power launched Deen Dayal Upadhyaya Gram Jyoti Yojana (DDUGJY) as one of its flagship programmes in July 2015 with the objective of providing round the clock power to rural areas. The programme focused on reforms in the rural power sector by separating feeder lines for rural households from those for agricultural applications, and strengthening transmission and distribution infrastructure. A previous scheme for rural electrification, Rajiv Gandhi Grameen Vidyutikaran Yojana (RGGVY) was subsumed into the new scheme.[64] As of 28 April 2018, 12 days ahead of the target date, all Indian villages (a total of 597,464 census villages) were electrified.[65]
India has also achieved close to 100% electrification of all rural and urban households. As of 4 January 2019, 211.88 million rural households were provided with electricity, close to 100% of the 212.65 million total rural households.[1] As of 4 January 2019, 42.937 million urban households are provided with electricity, close to 100% of the 42.941 million total urban households.
Per-Capita consumption

- Coal: 1,021,997 GWh (74.5%)
- Large Hydro: 135,040 GWh (9.8%)
- Small Hydro: 8,703 GWh (0.6%)
- Wind Power: 62,036 GWh (4.5%)
- Solar Power: 39,268 GWh (2.9%)
- Biomass & other RE: 16,750 GWh (1.2%)
- Nuclear: 37,706 GWh (2.7%)
- Gas: 49,886 GWh (3.6%)
- Diesel: 129 GWh (0.0%)
| State/Union territory | Region | Per-Capita Consumption (kWh/year) |
|---|---|---|
| Dadra and Nagar Haveli | Western | 15,783 |
| Daman and Diu | Western | 7,965 |
| Goa | Western | 2,466 |
| Gujarat | Western | 2,279 |
| Chhattisgarh | Western | 2,016 |
| Maharashtra | Western | 1,307 |
| Madhya Pradesh | Western | 989 |
| Puducherry | Southern | 1,784 |
| Tamil Nadu | Southern | 1,847 |
| Andhra Pradesh[67] | Southern | 1,319 |
| Telangana | Southern | 1,551 |
| Karnataka | Southern | 1,367 |
| Kerala | Southern | 763 |
| Lakshadweep | Southern | 633 |
| Punjab | Northern | 2,028 |
| Haryana | Northern | 1,975 |
| Delhi | Northern | 1,574 |
| Himachal Pradesh | Northern | 1,340 |
| Uttarakhand | Northern | 1,454 |
| Chandigarh | Northern | 1,128 |
| Jammu and Kashmir | Northern | 1,282 |
| Rajasthan | Northern | 1,166 |
| Uttar Pradesh | Northern | 585 |
| Odisha | Eastern | 1,622 |
| Sikkim | Eastern | 806 |
| Jharkhand | Eastern | 915 |
| West Bengal | Eastern | 665 |
| Andaman and Nicobar Islands | Eastern | 370 |
| Bihar | Eastern | 272 |
| Arunachal Pradesh | North Eastern | 648 |
| Meghalaya | North Eastern | 832 |
| Mizoram | North Eastern | 523 |
| Nagaland | North Eastern | 345 |
| Tripura | North Eastern | 470 |
| Assam | North Eastern | 339 |
| Manipur | North Eastern | 326 |
| National | 1,122 |
Note: Per capita consumption = (gross electricity generation + net import) / mid year population.
Electricity generation
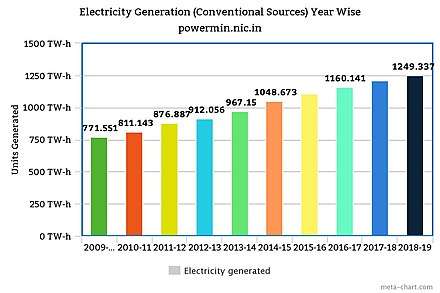
India has recorded rapid growth in electricity generation since 1985, increasing from 179 TW-hr in 1985 to 1,057 TW-hr in 2012.[6] The majority of the increase came from coal-fired plants and non-conventional renewable energy sources (RES), with the contribution from natural gas, oil, and hydro plants decreasing in 2012-2017. The gross utility electricity generation (excluding imports from Bhutan) was 1,384 billion kWh in 2019-20, representing 1.0 % annual growth compared to 2018-2019. The contribution from renewable energy sources was nearly 20% of the total. In the year 2019-20, all the incremental electricity generation is contributed by renewable energy sources as the power generation from fossil fuels decreased.[68]
| Year | Fossil Fuel | Nuclear | Hydro* | Sub total |
RES[69] | Utility and Captive Power | ||||||||||
|---|---|---|---|---|---|---|---|---|---|---|---|---|---|---|---|---|
| Coal | Oil | Gas | Mini hydro |
Solar | Wind | Bio mass |
Other | Sub total |
Utility | Captive (see Table above) |
Misc | Total | ||||
| 2011-12 | 612,497 | 2,649 | 93,281 | 32,286 | 130,511 | 871,224 | na | na | na | na | na | 51,226 | 922,451 | 134,387 | na | 1,056,838 |
| 2012-13 | 691,341 | 2,449 | 66,664 | 32,866 | 113,720 | 907,040 | na | na | na | na | na | 57,449 | 964,489 | 144,009 | na | 1,108,498 |
| 2013-14 | 746,087 | 1,868 | 44,522 | 34,228 | 134,847 | 961,552 | na | 3,350 | na | na | na | 59,615 | 1,021,167 | 156,643 | na | 1,177,810 |
| 2014-15 | 835,838 | 1,407 | 41,075 | 36,102 | 129,244 | 1,043,666 | 8,060 | 4,600 | 28,214 | 14,944 | 414 | 61,780 | 1,105,446 | 166,426 | na | 1,271,872 |
| 2015-16[70] | 896,260 | 406 | 47,122 | 37,413 | 121,377 | 1,102,578 | 8,355 | 7,450 | 28,604 | 16,681 | 269 | 65,781 | 1,168,359 | 183,611 | na | 1,351,970 |
| 2016-17[71] | 944,861 | 275 | 49,094 | 37,916 | 122,313 | 1,154,523 | 7,673 | 12,086 | 46,011 | 14,159 | 213 | 81,869 | 1,236,392 | 197,000 | na | 1,433,392 |
| 2017-18[72] | 986,591 | 386 | 50,208 | 38,346 | 126,123 | 1,201,653 | 5,056 | 25,871 | 52,666 | 15,252 | 358 | 101,839 | 1,303,493 | 183,000 | na | 1,486,493 |
| 2018-19[5] | 1,021,997 | 129 | 49,886 | 37,706 | 135,040 | 1,244,758 | 8,703 | 39,268 | 62,036 | 16,325 | 425 | 126,757 | 1,371,517 | 175,000 | na | 1,546,517 |
| 2019-20[73] | 995,840 | 108 | 48,497 | 46,381 | 155,970 | 1,246,796 | na | 49,452 | 64,485 | na | na | 137,856[74] | 1,384,652 | na | na | na |
Notes: Coal includes lignite; Misc: includes contributions from emergency diesel generator sets; *Hydro includes pumped storage generation; na = data not available.
Thermal power
Pollution from coal-based power plants
.png)
India's electricity sector consumes about 72% of the coal produced in the country. Coal consumption by utility power was 608 million tons in 2017-18.[75] A large part of the Indian coal reserve is similar to Gondwana coal: it is of low calorific value and high ash content, with poor fuel value. On average, Indian coal has a gross calorific value (GCV) of about 4500 Kcal/kg, whereas in Australia, for example, the GCV is about 6500 Kcal/kg .[76] The result is that Indian power plants using India's coal supply consume about 0.7 kg of coal per kWh of power generation, whereas in the United States thermal power plants consume about 0.45 kg of coal per kWh. In 2017, India imported nearly 130 Mtoe (nearly 200 million tons) of steam coal and coking coal, 29% of total consumption, to meet the demand in electricity, cement and steel production.[8][77]
The Centre for Science and Environment has assessed the Indian coal-based power sector as one of the most resource-wasteful and polluting sectors in the world, in part due to the high ash content in India's coal.[78] India's Ministry of Environment and Forests has therefore mandated the use of coals whose ash content has been reduced to 34% (or lower) in power plants in urban, ecologically sensitive and other critically polluted areas. The coal ash reduction industry has grown rapidly in India, with current capacity topping 90 megatonnes.
Before a thermal power plant is approved for construction and commissioning in India it must undergo an extensive review process that includes environmental impact assessment.[79] The Ministry of Environment and Forests has produced a technical guidance manual to help project proposers avoid environmental pollution from thermal power plants.[80] As of 2016, the existing coal-fired power stations in the utility and captive power sectors were estimated to require nearly 12.5 million INR per MW capacity to install pollution control equipment to comply with the latest emission norms set out by the Ministry of Environment and Forests.[81][82][83][84] In April 2020, CPCB declared that over 42,000 MW thermal power plants have outlived their lives.[85] India has also banned imports of pet coke for use as fuel.[86] As a signatory to the Paris Agreement, India is also reducing power generation from coal to control the emission of greenhouse gases.[87]
The state and central power generation companies are permitted by the Government of India to minimize the cost of coal transportation using flexible coal linkage swaps from inefficient plants to efficient plants, and from plants situated far from coal mines to plants close to the pit head, leading to a reduction in the cost of power.[88] Although coal imports for consumption in the utility sector are declining, the overall imports of steam coal are increasing as the local coal production is unable to meet the requirements of coal-fired captive power plants.[89][90]
Natural gas supply constraints
The installed capacity of natural gas-based power plants (including the plants ready to be commissioned with the commencement of natural gas supply) was nearly 26,765 MW at the end of the financial year 2014-15. These plants were operating at overall plant load factor (PLF) of 22% due to a severe shortage of natural gas in the country,[91] and the fact that imported liquid natural gas (LNG) was too expensive for power generation. Many power stations were shut down throughout the year for lack of natural gas supply. The natural gas shortage for power sector alone was nearly 100 million cubic metre per day at standard conditions.[92] The break-even price for switching from imported coal to LNG in electricity generation was estimated to be approximately US$6 per million British thermal units ($20/MWh) (themal energy).[93] The Indian government has taken steps to enhance power generation from gas-based power plants by waiving import duties and taxes.[94][95]
Gasification of coal or lignite or pet coke or biomass produces synthetic natural gas or syngas (also known as coal gas or wood gas) which is a mixture of hydrogen, carbon monoxide and carbon dioxide gases.[96] Coal gas can be converted into synthetic natural gas by using the Fischer–Tropsch process at low pressure and high temperature. Coal gas can also be produced by underground coal gasification if the coal deposits are located deep in the ground or it is uneconomical to mine the coal.[97] Synthetic natural gas production technologies promise to dramatically improve India's supply of natural gas.[98] The Dankuni coal complex produces syngas that is piped to industrial users in Calcutta.[99] Many coal-based fertiliser plants can also be economically retrofitted to produce synthetic natural gas. It is estimated that the production cost for syngas could be below US$6 per million British thermal units ($20/MWh).[100][101]
Retirement of old thermal power plants
India's coal-fired, oil-fired and natural gas-fired thermal power plants are inefficient and replacing them with cheaper renewable technologies offers significant potential for greenhouse gas (CO2) emission reduction. India's thermal power plants emit 50% to 120% more CO2 per kWh produced compared to average emissions from their European Union (EU-27) counterparts.[102] The central government plans to retire coal-based plants that are at least 25 years old and contributing excessive pollution, totalling 11,000 MW of capacity.[103] As of 2018 there is no similar retirement plan for the captive power sector.
Some diesel generator plants and gas turbine plants were also decommissioned in 2016.[104]
Renewable energy
India's renewable energy sector has been growing vigorously for the last decade.[106] As of 31 March 2018, India had grid-connected installed electricity generation capacity of about 69.02 GW from non-conventional renewable technologies[107] and conventional renewable power or major hydroelectric power capacity of 45.29 MW.[108]
| Type | Capacity (in MW) |
|---|---|
| Wind | 34,046.00 |
| Solar | 21,651.48 |
| Small Hydro Power Projects | 4,485.81 |
| Biomass Power & Gasification and Bagasse Cogeneration | 8,700.80 |
| Waste to Power | 138.30 |
| Total non-conventional renewable Power - Grid Connected | 69,022.39 |
Bids have been invited for installation of a further 115 GW, to achieve a total of 175 GW total installed capacity of non-conventional renewable power by 31 March 2022. The government has set up a fund of US$350 million to finance solar projects.[109]
Hydro power
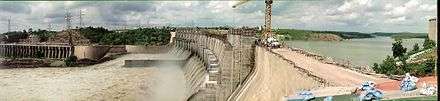
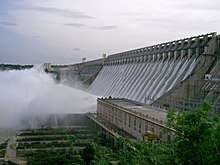
The hydro-electric power plants at Darjeeling and Shivanasamudram were among the first in Asia, and were established in 1898 and 1902 respectively.
India's potential for hydro power has been assessed to be about 125,570 MW at 60% load factor.[110] India is ranked fourth globally by underutilized hydro power potential. The estimated amount of viable hydro power varies with improved technology and the cost of electricity generation from other sources. In addition, there is an estimated 6,740 MW of potential for small, mini, and micro-hydro generators, and 56 sites for pumped storage schemes with an aggregate installed capacity of 94,000 MW have been identified.[111][112] In 2020, the power tariff from Solar PV clubbed with pumped storage hydro have fallen below the coal based power plant tariffs in offering base load and peak load power supply.[113]
The installed hydro power capacity as of 31 March 2018 was approximately 45,293 MW, 13.17% of total installed utility capacity at the time.[3] Small, mini, and micro-hydro generators add another 4,486 MW capacity.[3] The share of this sector operated by public companies is 97%.[114] Companies engaged in the development of hydroelectric power in India include the National Hydroelectric Power Corporation (NHPC), Northeast Electric Power Company (NEEPCO), Satluj Jal Vidyut Nigam (SJVNL), Tehri Hydro Development Corporation, and NTPC-Hydro.
Pumped storage schemes offer the potential for centralized peak power stations for load management in the electricity grid.[115][116] They also produce secondary /seasonal power at no additional cost when rivers are flooding with excess water. Storing electricity by alternative systems such as batteries, compressed air storage systems, etc. is more costly than electricity production by standby generator. India has already established nearly 4,785 MW pumped storage capacity as part of its installed hydro power plants.[117][118]
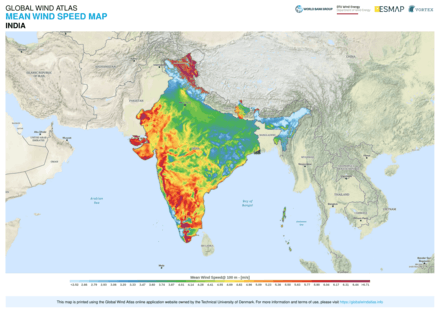
Solar power
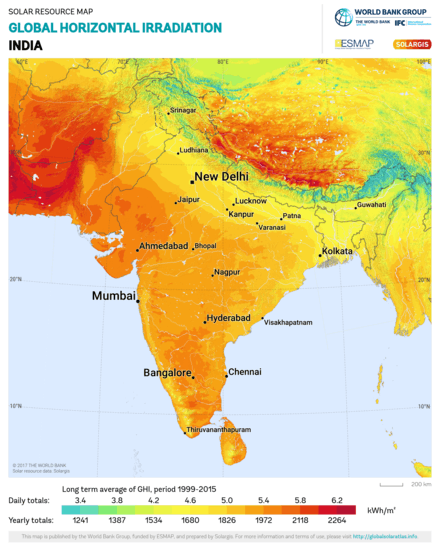
The solar energy sector in India offers potentially enormous capacity, though little of this potential has so far been exploited. Solar radiation of about 5,000 trillion kWh per year is incident over India's land mass, with average daily solar power potential of 0.25 kWh/m2 of used land area with available commercially proven technologies.[121] As of 31 December 2019, the installed capacity was 33.73 GW, or 2% of utility electricity generation.[69]
Solar power plants require nearly 2.4 hectares (0.024 km2) land per MW capacity, which is similar to coal-fired power plants when life cycle coal mining, consumptive water storage and ash disposal areas are taken into account, and hydropower plants when the submergence area of the water reservoir is included. Solar plants with 1.33 million MW capacity could be installed in India on 1% of its land (32,000 square km). Large tracts of land that is unproductive, barren and devoid of vegetation exist in all parts of India, exceeding 8% of its total area. These are potentially suitable for solar power.[122] It has been estimated that if 32,000 square km of these waste lands were used for solar power generation,2,000 billion kWh of electricity could be produced, twice the total power generated in the year 2013-14. At a price of 4 Rs/kWh, this would result in a land annual productivity/yield of ₹1.0 million (US$14,000) per acre, which compares favorably with many industrial areas and is many times more than the best productive irrigated agriculture lands.[123] Building solar power plants on marginally productive lands offers the potential for solar electricity to replace all of India's fossil fuel energy requirements (natural gas, coal, lignite, nuclear fuels, and crude oil),[124] and could offer per capita energy consumption at par with USA/Japan for the peak population expected during its demographic transition.[125]
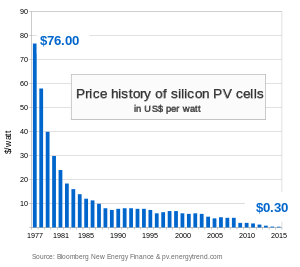
The cost of power generated by solar photovoltaics fell to ₹2.44 (3.4¢ US) per kWh in May 2017, lower than any other type of power generation in India.[126][127] In the same year, the levelised tariff in US$ for solar electricity fell to 1.79 cents/kWh, far below the fuel cost for coal-based power plants in India.[128] In 2020, the power tariff from Solar PV clubbed with pumped storage hydro or battery storage have fallen below the coal based power plant tariffs in offering base load and peak load power supply.[113]
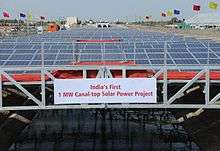
Land acquisition is a challenge for solar farm projects in India. Some state governments are exploring innovative ways to address land availability, for example, by deploying solar capacity above irrigation canals. This allows solar energy to be harvested while simultaneously reducing the loss of irrigation water by solar evaporation.[129] The state of Gujarat was first to implement the Canal Solar Power Project, using solar panels on a 19,000 km (12,000 mi) long network of Narmada canals across the state to generate electricity. It was the first such project in India.
Synergy with other types of power generation
A major disadvantage of solar power is that it produces electricity only in daylight, and not during night time or cloudy daytime. This disadvantage can be overcome by installing grid storage, such as pumped-storage hydroelectricity.[130] A proposed large-scale engineering project to interlink Indian rivers envisages coastal reservoirs for river waters that would double as pumped-storage hydroelectricity reservoirs.[131] Existing and future hydropower stations can also be expanded with additional pumped-storage hydroelectricity units to cater for night time electricity consumption. Most of the groundwater pumping power required can be met directly by solar power during the day time.[132]
Solar thermal power plants with thermal storage are also emerging as cheaper (US 5¢/kWh) and cleaner load following power plants than fossil fuel power plants. They can respond to demand round the clock, and work as base load power plants when there is excess solar energy. A mix of solar thermal and solar photovoltaic plants offers the potential to match load fluctuations without requiring costly battery storage.
Wind power
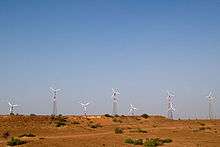
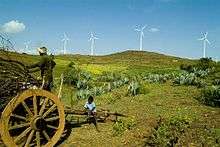

India has the fourth largest installed wind power capacity in the world. The development of wind power in India began in the 1990s in Tamil Nadu and significantly increased in the last decade. As of 31 March 2018, the installed capacity of wind power was 34.05 GW, spread across many states of India.[3][133] The largest wind power generating state is Tamil Nadu, accounting for nearly 23% of installed capacity, followed in decreasing order by Gujarat, Maharashtra, Rajasthan and Karnataka.[133][134]
In 2015-16, wind power accounted for 8.5% of India's total installed power capacity, and 2.5% of the country's power output. India aims to install a total 60 GW of wind power capacity by 2022.[135][136] The wind power tariff of around 2.5 INR/kWh is the cheapest of all power generation sources in India.[137]
Biomass power
Biomass is organic matter from living organisms. As a renewable energy source, biomass can either be used directly via combustion to produce heat, or indirectly after converting it to various forms of biofuel using a range of methods which are broadly classified into thermal, chemical, and biochemical methods. Biomass, bagasse, forestry, domestic organic wastes, industrial organic wastes, organic residue from biogas plants, and agricultural residue and waste can all be used as fuel to produce electricity.[138][139] Nearly 750 million tons of biomass that is not edible by cattle is available annually in India.[140][141]
The total use of biomass to produce heat in India was nearly 177 Mtoe in 2013.[142] 20% of households in India use biomass and charcoal for cooking purposes. This traditional use of biomass is being replaced by liquid petroleum gas in rural areas, resulting in increased burning of biomass in fields, This has become a major source of air pollution in nearby towns and cities.[143][140]
- Torrefied biomass
Large quantities of imported coal are being used in pulverised coal-fired power stations. Raw biomass cannot be used directly in the pulverised coal mills as it is difficult to grind into fine powder due to caking. However, torrefaction makes it possible for biomass to replace coal.[144] The hot flue gas of existing coal-fired power stations can be used as a heat source for torrefaction, so that biomass can be cofired with coal.[145][146] Surplus agriculture/crop residue biomass is beginning to be used for this purpose.[147][148] Instead of shutting down coal-fired power plants due to concerns over pollution, it has been argued that these units can be retrofitted economically to produce electricity from biomass.[149][150] Biomass power plants can also sell Renewable Energy Certificates, increasing their profitability.[151][152] Cofiring of biomass up to 10% with coal in existing pulverised coal-fired power stations is successfully implemented in India.[153][154]
- Biogas
In 2011, India started a new initiative to demonstrate the utility of medium-size mixed feed biogas-fertiliser pilot plants. The government approved 21 projects with an aggregate capacity of 37,016 cubic metres per day, of which 2 projects were successfully commissioned by December 2011.[155] India commissioned a further 158 projects under its Biogas-based Distributed/Grid Power Generation programme, with a total installed capacity of about 2 MW. In 2018, India has set a target of producing 15 million tons of biogas/bio-CNG by installing 5,000 large scale commercial type biogas plants which can produce daily 12.5 tons of bio-CNG by each plant.[156] Rejected organic solids from biogas plants can be used in coal plants after torrefaction.
Biogas is primarily methane, and can also be used to generate protein rich feed for cattle, poultry and fish by growing Methylococcus capsulatus, a bacterium that grows directly on methane. This can be done economically in villages with low requirements for land and water.[157][158][159] The carbon dioxide gas produced as a by-product from these units can be used in cheaper production of algae oil or spirulina from algae cultivation, which may eventually substitute for crude oil.[160][161] Using biogas for protein-rich feed production is also eligible for carbon credits as this sequesters carbon from the atmosphere.[162] There is significant potential to extract useful biomass from breweries, textile mills, fertiliser plants, the paper and pulp industry, solvent extraction units, rice mills, petrochemical plants and other industries.[163]
The government is exploring several ways to use agro waste or biomass in rural areas to improve the rural economy.[164][165] For example biomass gasifier technologies are being explored to produce power from surplus biomass resources such as rice husk, crop stalks, small wood chips and other agro-residues in rural areas. The largest biomass-based power plant in India at Sirohi, Rajasthan has a capacity of 20 MW. During 2011, India installed 25 rice husk based gasifier systems for distributed power generation in 70 remote villages of Bihar, including a total of 1.20 MW in Gujarat and 0.5 MW in Tamil Nadu. In addition, gasifier systems were installed at 60 rice mills in India.[155]
Geothermal energy
Geothermal energy is thermal energy generated and stored in the Earth. India's geothermal energy installed capacity is experimental, and commercial use is insignificant. According to some estimates, India has 10,600 MW of geothermal energy available.[166] The resource map for India has been grouped into six geothermal provinces:[167]
- Himalayan Province – Tertiary orogenic belt with tertiary magmatism
- Faulted blocks province – the Aravalli range, Naga-Lushi, the west coast regions, and the Narmada-Son lineament.
- Volcanic arc province – the Andaman and Nicobar arc.
- Deep sedimentary basins of Tertiary age such as the Cambay basin.
- Radioactive province – Surajkund, Hazaribagh and Jharkhand.
- Cratonic province – Peninsular India
India has about 340 hot springs spread over the country. Of these, 62 are distributed along the northwest Himalaya, in the states of Jammu and Kashmir, Himachal Pradesh and Uttarakhand. They are found concentrated in a 30-50-km wide thermal band mostly along the river valleys. The Naga-Lusai and West Coast Provinces also manifest a series of thermal springs. The Andaman and Nicobar arc is the only place in India where volcanic activity continues, potentially a good site for geothermal energy. The Cambay geothermal belt is 200 km long and 50 km wide, with Tertiary sediments. Thermal springs have been reported from the belt although they are not of very high temperature or flow levels. High subsurface temperature and thermal fluid have been reported in deep drill wells in depth ranges of 1.7 to 1.9 km during drilling in this area. Steam blowout has also been reported in drill holes in a depth range of 1.5 to 3.4 km. The thermal springs in India's peninsular region are more related to the faults, which allow water to circulate to considerable depths. The circulating water acquires heat from the normal thermal gradient in the area, and can emerge at a high temperature.[167]
In a December 2011 report, India identified six promising geothermal sites for the development of geothermal energy. In decreasing order of potential, these are:
- Tattapani (Chhattisgarh)
- Puga (Jammu & Kashmir)
- Cambay Graben (Gujarat)
- Manikaran (Himachal Pradesh)
- Surajkund (Haryana)
- Chhumathang (Jammu & Kashmir)
Puga was chosen for the first geothermal plant,[168] but as of December 2017 little progress had been made.[169]
Tidal power
Tidal power, also called tidal energy, is a form of hydropower that converts energy obtained from tides into useful forms of power, mainly electricity. Local effects such as shelving, funneling, reflection and resonance can increase the potential of tidal energy in certain regions.
India's potential to harness tidal energy is significant. Energy can be extracted from tides in several ways. In one method, a reservoir is created behind a barrier, or barrage, and tidal waters are allowed to pass through turbines in the barrier to generate electricity. This method requires mean tidal differences greater than 4 metres and favourable topographical conditions to keep installation costs low. The Gulf of Khambhat and the Gulf of Kutch on India's west coast, with maximum tidal ranges of 11 m and 8 m, respectively, and an average tidal range of 6.77 m and 5.23 m, are promising sites for this type of technology. The Ganges Delta in the Sundarbans, West Bengal is another possibility, although it offers significantly less recoverable energy; the maximum tidal range in Sunderbans is approximately 5 m with an average tidal range of 2.97 m. It is estimated that barrage technology could harvest about 8 GW from tidal energy in India, primarily in Gujarat. The barrage approach has several disadvantages, however, one being that a badly engineered barrage can have significant negative effects on migratory fishes, marine ecosystems and aquatic life. Integrated barrage technology plants can also be expensive to build. In December 2011, the Ministry of New & Renewable Energy, Government of India and the Renewable Energy Development Agency of West Bengal jointly approved and agreed to implement India's first 3.75 MW Durgaduani mini tidal power project.[168]
Another tidal wave technology harvests energy from surface waves or from pressure fluctuations below the sea surface. A report from the Ocean Engineering Centre, at the Indian Institute of Technology Madras estimated the annual wave energy potential along the Indian coast is 5 to 15 MW/metre, suggesting a theoretical maximum potential for electricity harvesting along India's 7500-kilometer coastline of about 40 GW.[170] However, the realistic economical potential is likely to be considerably less than this.[170] A significant barrier to surface energy harvesting is that its equipment may interfere with fishing and other sea-bound vessels, particularly in unsettled weather. India built its first surface energy harvesting technology demonstration plant in Vizhinjam, near Thiruvananthapuram.
The third approach to harvesting tidal energy is ocean thermal energy technology. This approach harvests the solar energy trapped in ocean waters. Oceans have a thermal gradient, the surface being much warmer than the deeper levels of the ocean. This thermal gradient may be harvested using the modified Rankine cycle. India's National Institute of Ocean Technology (NIOT) has attempted this approach without success. In 2003, NIOT attempted to build and deploy a 1 MW demonstration plant with Saga University of Japan,[171] but mechanical problems prevented success. After initial tests near Kerala, the unit was scheduled for redeployment and further development in the Lakshadweep Islands in 2005.
Nuclear power
As of 31 March 2019, India had 6.78 GW of installed nuclear power generation capacity or nearly 2% of total installed utility power generation capacity. Nuclear plants generated 37,812 million kWh at 63.67% PLF in 2018-19.[172]
India's nuclear power plant development began in 1964. India signed an agreement with General Electric (United States) for the construction and commissioning of two boiling water reactors at Tarapur. In 1967, this effort was placed under India's Department of Atomic Energy. In 1971, India set up its first pressurized heavy water reactors with Canadian collaboration in Rajasthan.
In 1987, India created the Nuclear Power Corporation of India Limited to commercialize nuclear power. The Nuclear Power Corporation of India is a public sector enterprise, wholly owned by the Government of India, under the administrative control of the Department of Atomic Energy. The state-owned company has ambitious plans to establish plants totalling 63 GW generation capacity by 2032.[173]
India's nuclear power generation effort is subject to many safeguards and oversights. Its environmental management system is ISO-14001 certified, and it undergoes peer review by the World Association of Nuclear Operators, including a pre-start-up peer review. The Nuclear Power Corporation of India Limited commented in its annual report for 2011 that its biggest challenge is to address public and policymaker perceptions about the safety of nuclear power, particularly after the Fukushima Daiichi nuclear disaster in Japan.[174]
In 2011, India had 18 pressurized heavy water reactors in operation, with another four projects launched totalling 2.8 GW capacity. India is in the process of launching its first prototype fast breeder reactor using plutonium-based fuel obtained by reprocessing the spent fuel of first-stage reactors. The prototype reactor is located in Tamil Nadu and has a capacity of 500MW.
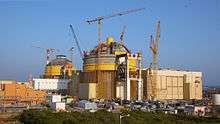
India has nuclear power plants operating in the following states: Maharashtra, Gujarat, Rajasthan, Uttar Pradesh, Tamil Nadu and Karnataka. These reactors have an installed electricity generation capacity of between 100 MW and 540 MW each. The Kudankulam nuclear power plant (KNPP) is the single largest nuclear power station in India. KNPP Unit 1 with a capacity of 1,000 MWe was commissioned in July 2013, while Unit 2, also with a capacity of 1,000 MWe, attained criticality in 2016. Two additional units are under construction.[175] The plant has suffered multiple shutdowns, leading to calls for an expert panel to investigate.[176]
In 2011, uranium was discovered in the Tummalapalle uranium mine, the country's largest uranium mine and possibly one of the world's largest. The reserves were estimated at 64,000 tonnes, and could be as large as 150,000 tonnes.[177] The mine began operation in 2012.[178]
India's share of nuclear power plant generation capacity is 1.2% of worldwide nuclear power production capacity, making it the 15th largest nuclear power producer. India aims to supply 9% of its electricity needs with nuclear power by 2032 and 25% by 2050.[174][179] Jaitapur Nuclear Power Project, India's largest nuclear power plant project, is planned to be implemented in partnership with Électricité de France under an agreement signed on 10 March 2018.[180]
India's government is developing up to 62 additional nuclear reactors, mostly using thorium fuel, which it expects to be operational by 2025. It is the "only country in the world with a detailed, funded, government-approved plan" to focus on thorium-based nuclear power.[179]
Electricity transmission and distribution
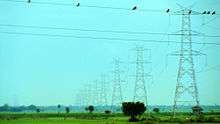
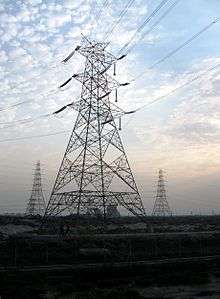
As of 2013, India has a single wide area synchronous grid that covers the entire country except distant islands.[181]
| Capacity | Substations (MVA) | Transmission lines (circuit km) | c.km / MVA ratio[183] |
|---|---|---|---|
| HVDC ± 220 kV & above | 22,500 | 15,556 | 0.691 |
| 765 kV | 197,500 | 36,673 | 0.185 |
| 400 kV | 292,292 | 173,172 | 0.707 |
| 220 kV | 335,696 | 170,748 | 0.592 |
| 220 kV & above | 847,988 | 396,149 | 0.467 |
The total length of high voltage direct current (HVDC) transmission lines (220kV and above) would be enough to form a square matrix of area 266 km2 (i.e. a square grid 16.3 km on a side, so that on average there is at least one high voltage line within a distance of 8.15 km) over the entire area of the country. This represents a total of almost 20% more high voltage transmission lines than that of the United States (322,000 km (200,000 mi) of 230 kV and above). However the Indian grid transmits far less electricity.[184] The installed length of transmission lines of 66 kV and above is 649,833 km (403,788 mi) (on average, there is at least one ≥66 kV transmission line within 4.95 km across the country).[5] The length of secondary transmission lines (400 V and above) is 10,381,226 km (6,450,595 mi) as of 31 March 2018.[5] The spread of total transmission lines (≥400 V) would be sufficient to form a square matrix of area 0.36 km2 (i.e. on average, at least one transmission line within 0.31 km distance) over the entire area of the country.
The all-time maximum peak load met was 182,610 MW on 30 May 2019.[185] The maximum achieved demand factor of substations is nearly 60% at the 220 kV level. However the operational performance of the system is not satisfactory in meeting peak electricity loads.[186][187] This has led to the initiation of detailed forensic engineering studies, with a plan to make capital investments in a smart grid that maximises the utility of the existing transmission infrastructure.[42]
The introduction of an availability based tariff (ABT) originally helped to stabilise the Indian transmission grids. However, as the grid transitions to power surplus the ABT has become less useful. The July 2012 blackout, affecting the north of the country, was the largest power grid failure in history as measured by the number of people affected.
India's aggregate transmission and commercial (ATC) losses were nearly 21.35% in 2017-18.[188][5][189] This compares unfavorably to the total ATC loss in the electricity sector of the United States, which was only 6.6% out of 4,404 billion kWh electricity supplied during the year 2018.[190] The Indian government set a target of reducing losses to 17.1% by 2017 and to 14.1% by 2022. A high proportion of non-technical losses are caused by illegal tapping of lines, faulty electric meters and fictitious power generation that underestimates actual consumption and also contributes to reduced payment collection. A case study in Kerala estimated that replacing faulty meters could reduce distribution losses from 34% to 29%.[52]
Regulation and administration
The Ministry of Power is India's top central government body regulating the electrical energy sector in India. The ministry was created on 2 July 1992. It is responsible for planning, policy formulation, processing of projects for investment decisions, monitoring project implementation, training and manpower development, and the administration and enactment of legislation in regard to power generation, transmission and distribution.[191] It is also responsible for the administration of India's Electricity Act (2003), the Energy Conservation Act (2001) and has the responsibility of undertaking amendments to these Acts when necessary to meet the Indian government's policy objectives.
Electricity is a concurrent list subject at Entry 38 in List III of the seventh Schedule of the Constitution of India. In India's federal governance structure, this means that both the central government and India's state governments are involved in establishing policy and laws for the electricity sector. This requires the central government and individual state governments to enter into memoranda of understanding to help expedite projects in the individual states.[192] To disseminate information to the public on power purchases by the distribution companies (discoms), the government of India recently started posting data on its website on a daily basis.[193]
Trading
Bulk power purchasers can buy electricity on a daily basis for short, medium and long term durations from a reverse e-auction facility.[194] The electricity prices transacted by the reverse e-auction facility are far less than the prices agreed under bilateral agreements.[195] The commodity derivative exchange Multi Commodity Exchange has sought permission to offer electricity future markets in India.[196] The Government of India is also planning reverse procurement process in which generators and discoms with surplus power can seek e-bids for power supply for up to a one-year period, to put an end to bilateral contracts and determine the market-based price for electricity.[197]
Government-owned power companies
India's Ministry of Power administers central government-owned companies involved in the generation of electricity in India. These include the National Thermal Power Corporation, the SJVN, the Damodar Valley Corporation, the National Hydroelectric Power Corporation and the Nuclear Power Corporation of India. The Power Grid Corporation of India is also administered by the Ministry; it is responsible for the inter-state transmission of electricity and the development of the national grid.
The Ministry works with state governments on matters related to state government-owned corporations in India's electricity sector. Examples of state corporations include the Telangana Power Generation Corporation, the Andhra Pradesh Power Generation Corporation Limited, the Assam Power Generation Corporation Limited, the Tamil Nadu Electricity Board, the Maharashtra State Electricity Board, the Kerala State Electricity Board, and Gujarat Urja Vikas Nigam Limited.
Funding of power infrastructure

India's Ministry of Power administers the Rural Electrification Corporation Limited and the Power Finance Corporation Limited. These central-government-owned public sector enterprises provide loans and guarantees for public and private electricity sector infrastructure projects in India. Excessive plant construction loans at 75% of overestimated costs on overrated plant capacities have led to stranded assets of US$40 to 60 billion.[198][199] The central and state-owned power generators escaped this crisis as they had entered PPAs with state-owned monopolistic discoms on a cost-plus basis at higher than prevailing market power tariffs, without undergoing competitive bidding process. Many direct and indirect subsidies are given to various sectors.[200]
Budgetary support
After the enactment of Electricity Act 2003 budgetary support to the power sector is negligible.[201] Many State Electricity Boards were separated into their component parts after the act came into force, creating separate entities for generating, transmitting and distributing power.[202]
Human resource development
The rapid growth of the electricity sector in India has generated high demand for trained personnel. India is making efforts to expand energy education and to enable existing educational institutions to introduce courses related to energy capacity addition, production, operations and maintenance. This initiative includes conventional and renewable energy.
The Ministry of New and Renewable Energy announced that State Renewable Energy Agencies are being supported to organise short-term training programmes for installation, operation and maintenance and repair of renewable energy systems in locations where intensive renewable energy programmes are being implemented. Renewable Energy Chairs have been established at the Indian Institute of Technology Roorkee and the Indian Institute of Technology Kharagpur.[155] The Central Training Institute Jabalpur is a training institute for power distribution engineering and management. The NTPC School of Business Noida has initiated an energy-centred two year post-graduate diploma in management program and a one year post-graduate diploma in management (executive) program, to cater to the growing need for management professionals in this area. Education and availability of skilled workers is expected to be a key challenge in India's effort to expand its electricity sector.
Problems with India's power sector
India's electricity sector faces many issues, including:
- Inadequate last mile connectivity. The country already has adequate generation and transmission capacity to meet the full consumer demand, both temporally and spatially.[5] However, due to the lack of last-mile link-up between all electricity consumers and a reliable power supply (to exceed 99%), many consumers depend on diesel generators.[42] Nearly 80 billion kWh of electricity is generated annually in India by diesel generator sets that consume nearly 15 million tons of diesel oil. Over 10 million households use battery storage UPS as back-ups in case of load shedding.[203] India imports nearly US$2 billion worth of battery storage UPS every year.[204] As overhead lines cause distribution problems during rain and wind storms, there is a plan to lay buried cables from low voltage substations to supply cheaper emergency power in cities and towns and thus reduce diesel oil consumption by diesel generator sets and the installation of UPS systems.
- Demand build up measures. Electricity-intensive industries consume the cheaper electricity (average price Rs 2.5 per kWhr) available from the grid instead of running their own coal/gas/oil fired captive power plants.[205][206] The captive power generation capacity by such plants is nearly 53,000 MW, and they are mainly established in steel, fertilizer, aluminium, cement, etc. industries.[207][5] These plants can draw cheaper electricity from the grid on short term open access (STOA) basis, avoiding their own higher cost of electricity generation and diverting power from other consumers.[208][209] Some of these idling captive power plants can be used for ancillary services or grid reserve service and earn extra revenue.[210][211]
- Unequal electricity distribution. Almost all households have access to electricity.[1] However, most households find the electricity supply intermittent and unreliable.[212] At the same time, many power stations are idling for lack of electricity demand and the idling generation capacity is sufficient to supply the needs of households lacking electricity three times over.
- Erratic power pricing. In general, industrial and commercial consumers subsidize domestic and agricultural consumers.[213][214] Government giveaways such as free electricity for farmers, created partly to curry political favor, have depleted the cash reserves of state-run electricity-distribution system and led to debts of ₹2.5 trillion (US$35 billion).[215] This has financially crippled the distribution network, and its ability to pay to purchase power in the absence of subsidies from state governments.[216] This situation has been worsened by state government departments that do not pay their electricity bills.
- Over-rated capacity. Many coal-fired plants are overrated above the actual maximum continuous rating (MCR) capacity.[217] to allow the plant cost to be inflated.[218] These plants operate 15 to 10% below their declared capacity on a daily basis and rarely operate at declared capacity, undermining grid stability.
- Lack of timely information on load and demand. Intraday graphs at 15-minute or more frequent intervals are required to understand the shortcomings of the power grid with respect to grid frequency, including comprehensive data collected from SCADA for all grid-connected generating stations (≥ 100 KW) and load data from all substations.[219]
- Lack of adequate coal supply: Despite abundant reserves of coal, power plants are frequently under-supplied. India's monopoly coal producer, state-controlled Coal India, is constrained by primitive mining techniques and is rife with theft and corruption. Poor coal transport infrastructure has worsened these problems. Most of India's coal lies under protected forests or designated tribal lands and efforts to mine additional deposits have been resisted.
- Poor gas pipeline connectivity and infrastructure. India has abundant coal bed methane and natural gas potential. However a giant new offshore natural gas field has delivered far less gas than claimed, causing a shortage of natural gas.
- Transmission, distribution and consumer-level losses. Losses exceed 30%, including the auxiliary power consumption of thermal power stations and fictitious electricity generation by wind generators, solar power plants & independent power producers (IPPs), etc.
- Resistance to energy efficiency in the residential building sector. Continuous urbanization and the growth of population result in increased power consumption in buildings. The belief still predominates among stakeholders that energy-efficient buildings are more expensive than conventional buildings, adversely affecting the "greening" of the building sector.[220]
- Resistance to hydroelectric power projects. Hydroelectric power projects in India's mountainous north and northeast regions have been slowed down by ecological, environmental and rehabilitation controversies, coupled with public interest litigation.
- Resistance to nuclear power generation. Political activism since the Fukushima disaster has reduced progress in this sector. The track record of executing nuclear power plants is also very poor in India.[221]
- Theft of power. The financial loss due to theft of electricity is estimated at around $16 billion yearly.
Key implementation challenges for India's electricity sector include efficient performance of new project management and execution, ensuring availability and appropriate quality of fuel, developing the large coal and natural gas resources available in India, land acquisition, obtaining environmental clearances at state and central government level, and training skilled manpower.[222]
Foreign electricity trade
India's National Grid is synchronously interconnected to Bhutan, and asynchronously linked with Bangladesh and Nepal.[223] An interconnection with Myanmar,[224] and an undersea interconnection to Sri Lanka (India–Sri Lanka HVDC Interconnection) have also been proposed.
India has been exporting electricity to Bangladesh and Nepal and importing excess electricity from Bhutan.[225][226] In 2015, Nepal imported 224.21 MW of electric power from India, and Bangladesh imported 500MW.[227][228] In 2018 Bangladesh proposed importing 10,000 MW power from India.[229]
Bangladesh, Myanmar and Pakistan produce substantial amounts of natural gas for electricity generation. Bangladesh, Myanmar and Pakistan produce 55 million cubic metres per day (mcmd), 9 mcmd and 118 mcmd respectively, out of which 20 mcmd, 1.4 mcmd and 34 mcmd are consumed for electricity generation.[230][231] Natural gas production in India is not even adequate to meet non-electricity requirements.[232] There is thus an opportunity for mutually beneficial trading in energy resources with these countries.[233] India could supply surplus electricity to Pakistan and Bangladesh in return for the natural gas imports by gas pipelines. Similarly, India can develop hydro power projects in Bhutan, Nepal and Myanmar on a build-operate-transfer basis. India might also be able to enter into long term power purchase agreements with China for developing the hydro power potential of the Yarlung Tsangpo Grand Canyon in the Brahmaputra River basin of Tibet. India could also supply its surplus electricity to Sri Lanka by undersea cable link.[234]
Electricity as substitute to imported LPG and kerosene
India's net import of liquefied petroleum gas (LPG) is 6.093 million tons and the domestic consumption is 13.568 million tons with Rs. 41,546 crores subsidy to domestic consumers in 2012-13.[235] The LPG import content is nearly 40% of total consumption in India.[236] The affordable electricity retail tariff (860 Kcal/Kwh at 90% heating efficiency) to replace LPG (net calorific value 11,000 Kcal/Kg at 75% heating efficiency) in domestic cooking is 6.47 Rs/Kwh, while the retail price of LPG cylinder is Rs 1000 (without subsidy) with 14.2 kg LPG content. Replacing LPG consumption with electricity would reduces imports substantially.
The domestic consumption of kerosene is 7.349 million tons with Rs. 30,151 crores subsidy to the domestic consumers in the year 2012-13. The subsidised retail price of kerosene is 13.69 Rs/litre whereas the export/import price is 48.00 Rs/litre. The affordable electricity retail tariff (860 Kcal/Kwh at 90% heating efficiency) to replace kerosene (net calorific value 8240 Kcal/litre at 75% heating efficiency) in domestic cooking is 6.00 Rs/kWh when the kerosene retail price is 48 Rs/litre (without subsidy).
In 2014-15, the plant load factor (PLF) of coal-fired thermal power stations was only 64.46%. These stations can run above 85% PLF if there is adequate electricity demand.[237] The additional electricity generation at 85% PLF is nearly 240 billion units, enough to replace all the LPG and kerosene consumption in domestic sector.[238] The incremental cost of generating additional electricity is only the coal fuel cost, less than 3 Rs/Kwh. Enhancing the PLF of coal-fired stations and encouraging domestic electricity consumers to substitute electricity in place of LPG and kerosene in household cooking would reduce government subsidies. It has been proposed that domestic consumers who are willing to surrender subsidized LPG/kerosene permits should be given a free electricity connection and a subsidized electricity tariff.[239]
Since 2017, IPPs have offered to sell solar and wind power below 3.00 Rs/Kwh to feed into the high voltage grid. After considering distribution costs and losses, solar power appears to be a viable economic option for replacing the LPG and kerosene used in the domestic sector.
Electric vehicles
The retail prices of petrol and diesel are high enough in India to make electricity driven vehicles relatively economical.[240] The retail price of diesel was 65.00 Rs/litre in 2017-18, and the retail price of petrol was 70.00 Rs/litre. The electricity retail price to replace diesel would be 12.21 Rs/Kwh (860 Kcal/Kwh at 75% input electricity to shaft power efficiency versus diesel's net calorific value of 8572 Kcal/litre at 40% fuel energy to crank shaft power efficiency), and the comparable number to replace petrol would be 17.79 Rs/Kwh (860 Kcal/Kwh at 75% input electricity to shaft power efficiency versus petrol's net calorific value at 7693 Kcal/litre at 33% fuel energy to crank shaft power efficiency). In 2012-13, India consumed 15.744 million tons of petrol and 69.179 million tons of diesel, both mainly produced from imported crude oil.[235]
Electricity driven vehicles are expected to become popular in India when energy storage/battery technology offers improved range and lower maintenance.[241][242] Vehicle to grid options are also attractive, potentially allowing electric vehicles to help to mitigate peak loads in the electricity grid. The potential for continuous charging of electric vehicles through wireless electricity transmission technology is being explored by Indian companies and others.[243][244][245]
Energy reserves
India has abundant potential solar wind, hydro and biomass power. In addition, as of January 2011 India had approximately 38 trillion cubic feet (Tcf) of proven natural gas reserves, the world's 26th largest reserve.[246] The United States Energy Information Administration estimates that India produced approximately 1.8 Tcf of natural gas in 2010 while consuming roughly 2.3 Tcf of natural gas. India already produces some coalbed methane and has major potential to expand this source of cleaner fuel. India is estimated to have between 600 and 2000 Tcf of shale gas resources (one of the world's largest reserves).[102][247]
See also
- Energy in India
- Energy policy of India
- Oil and gas industry in India
- East West Gas Pipeline (India)
- List of electricity organisations in India
- Central Electricity Authority (India)
- List of power stations in India
- Indian Rivers Inter-link
References
- "Households electrification in India". Retrieved 21 August 2018.
- "WEO - Energy access database". worldenergyoutlook.org. Retrieved 11 November 2016.
- "All India Installed Capacity of Utility Power Stations".
- "Scenarios/CO2 emissions/India". International Energy Agency. Retrieved 8 March 2019.
- "Growth of Electricity Sector in India from 1947-2019" (PDF). Central Electricity Authority. May 2018. Retrieved 28 August 2019.
- "BP Statistical Review of world energy, 2016" (PDF).
- Tripathi, Bhasker (26 March 2018). "Now, India is the third largest electricity producer ahead of Russia, Japan". Business Standard India. Retrieved 27 September 2019.
- "BP Statistical Review of World Energy June 2019" (PDF). Retrieved 5 August 2019.
- "Tariff & duty of electricity supply in India". report. CEA, Govt. of India. March 2014.
- "India can achieve 1,650 billion units of electricity next year, Piyush Goyal". Retrieved 9 July 2016.
- "Mapped: The 1.2 Billion People Without Access to Electricity". Retrieved 29 November 2019.
- "States resolve to provide 24x7 power to everyone by March 2019". Retrieved 18 June 2016.
- "Government decides to electrify 5.98 crore unelectrified households by December 2018". Retrieved 20 June 2016.
- "India tops list of scrapped coal projects in pipeline since 2010: Study". Retrieved 13 July 2018.
- "National Electricity Plan (Generation) 2018" (PDF). Retrieved 29 March 2018.
- "Location wise regional summary of all India installed capacity of utility power stations" (PDF).
- "Let there be light". The Telegraph. 26 April 2009.
- "Electricity arrives in Mumbai". Archived from the original on 2 February 2013. Retrieved 1 August 2012.
- "Archives Darjeeling Hydro Power System - IET history - The IET". Retrieved 29 July 2015.
- http://www.nyoooz.com/bangalore/118780/bengalurus-first-lamp-post-set-up-in-1905-stands-forgotten
- Daily News & Analysis (20 November 2011). "Relic of India's first electric railway to be dismantled". dna. Retrieved 29 July 2015.
- "Cochin International Airport set to become worlds's first fully solar powered major airport". LiveMint. Kochi, India. 18 August 2015.
- Menon, Supriya. "How is the world's first solar powered airport faring? - BBC News". Bbc.com. Retrieved 1 December 2016.
- "One Nation-One Grid". Power Grid Corporation of India. Retrieved 2 December 2016.
- "Indian power system becomes largest operating synchronous grid in the world". The Times of India. Retrieved 2 December 2016.
- "Draft National Electricity Plan, 2016, CEA" (PDF). Retrieved 11 December 2016.
- "Will try to keep power prices lower, says Piyush Goyal". Retrieved 13 January 2016.
- "Dark future ahead? 11,000 mw thermal power capacity lying idle, largest outage is in the north". Retrieved 13 January 2016.
- "International oil market watch".
- "Naphtha spot price".
- "Bunker fuel spot price".
- "Global LNG prices lose ground on weak demand". Retrieved 27 February 2016.
- "LNG looks poised to follow crude oil's plunge".
- "Peaking power generated from imported LNG at Rs 4.70 per unit". Retrieved 21 March 2016.
- "Global coal price on downslide, no cheer for Indian power producers". Retrieved 13 December 2015.
- Press Trust of India (28 January 2016). "Govt asks Coal India to liquidate pithead stock". Business Standard.
- Tim Buckley; Kashish Shah (21 November 2017). "India's Electricity Sector Transformation" (PDF). Institute for Energy Economics and Financial Analysis. p. 2. Retrieved 5 May 2018.
- "Broad status of thermal power projects" (PDF). Central Electricity Authority. April 2019. Retrieved 3 May 2019.
- "Executive summary of Power sector, July 2019" (PDF). Retrieved 25 August 2019.
- "List of major captive power plants". Retrieved 13 May 2018.
- "Gensets add up to under half of installed power capacity; August, 2014". Retrieved 13 May 2015.
- "Modification to existing transmission lines to double the capacity". Retrieved 9 June 2015.
- "The True Cost of Providing Energy to Telecom Towers in India" (PDF). Retrieved 29 August 2015.
- "Complete list of working utility power stations in India" (PDF). Retrieved 27 August 2018.
- "Power Allocation from Central Sector". Ministry of Power, Government of India. Retrieved 15 May 2018.
- "Executive summary of month of July 2015" (PDF). Central Electricity Authority, Ministry of Power, Government of India. July 2015. Retrieved 15 September 2015.
- "Load Generation Balance Report 2019-20" (PDF). Retrieved 9 December 2019.
- "India wont need extra power plants for next three years - Says government report". Retrieved 13 January 2016.
- "Average spot power price to be less than Rs 3.5 per unit in May". Retrieved 12 May 2019.
- "Is a distress sale on by private power producers?". Retrieved 21 July 2015.
- "Indian power plants find Rs1.2 trillion of capacity has no takers". Retrieved 29 June 2015.
- Uwe Remme; et al. (February 2011). "Technology development prospects for the Indian power sector" (PDF). International Energy Agency France; OECD.
- "Analysis of the energy trends in the European Union & Asia to 2030" (PDF). Centre for Energy-Environment Resources Development, Thailand. January 2009.
- "Making the world hotter: India's expected air-conditioning explosion". Retrieved 5 December 2018.
- "LPG cylinder now used by 89% households". Retrieved 5 December 2018.
- The Partnership for Clean Indoor Air – Sierra Club. Pciaonline.org. Retrieved on 13 January 2012.
- Ganguly; et al. (2001). "INDOOR AIR POLLUTION IN INDIA – A MAJOR ENVIRONMENTAL AND PUBLIC HEALTH CONCERN" (PDF). Indian Council of Medical Research, New Delhi.
- "The Asian Brown Cloud: Climate and Other Environmental Impacts" (PDF). United Nations Environmental Programme. 2002. Archived from the original (PDF) on 26 May 2012.
- "Indoor air pollution and household energy". WHO and UNEP. 2011.
- "Green stoves to replace chullahs". The Times of India. 3 December 2009.
- "Status of Sewage Treatment in India" (PDF). Central Pollution Control Board, Ministry of Environment & Forests, Govt of India. 2005.
- "Evaluation of Operation And Maintenance Of Sewage Treatment Plants in India-2007" (PDF). Central Pollution Control Board, Ministry of Environment & Forests. 2008.
- "World Energy Outlook 2011: Energy for All" (PDF). International Energy Agency. October 2011.
- http://pib.nic.in/newsite/PrintRelease.aspx?relid=123595
- "India says electrified all villages ahead of prime minister's deadline". Retrieved 29 April 2018.
- "Rajya Sabha - Starred Question No. 6375 (Annexure-II" (PDF). Ministry of Power, Govt. of India. Retrieved 2 February 2019.
- "Consumer wise real Time AP Power Supply Position". Archived from the original on 19 June 2016. Retrieved 4 July 2016.
- Refer Table below
- "Overview of renewable power generation, CEA" (PDF). Retrieved 3 August 2017.
- "Growth of Electricity Sector in India from 1947-2016" (PDF). CEA. Retrieved 17 February 2017.
- "Growth of Electricity Sector in India from 1947-2017" (PDF). CEA. Retrieved 17 February 2018.
- "Growth of Electricity Sector in India from 1947-2018" (PDF). CEA. Retrieved 20 August 2018.
- "Summary electricity generation report, March 2020" (PDF). CEA. Retrieved 15 April 2020.
- "Provisional Renewable energy generation report, March 2020" (PDF). CEA. Retrieved 15 April 2020.
- "Page 11, Executive Summary on Power Sector, October 2018" (PDF). Retrieved 18 November 2018.
- "Economics of Coal and Gas Based Energy". Third Wave Solutions. 2012.
- "India's coal import rises 12% to 79 million tonnes in April–July". Retrieved 3 September 2018.
- Bhati, Priyavrat (21 March 2016). "Thermal power". Down To Earth. Retrieved 13 March 2016.
- "India's energy transition: the cost of meeting air pollution standards in the coal-fired electricity sector". Retrieved 13 August 2019.
- "Technical EIA guidance manual for thermal power plants" (PDF). Ministry of Environment and Forests, Government of India. 2009. Archived from the original (PDF) on 25 November 2011. Retrieved 31 December 2011.
- "Emission norms: How money is the fuel thermal plants lack". Retrieved 26 March 2018.
- "power tariffs may rise 70 paise per unit as to comply with new set of pollution control norms". Retrieved 22 February 2016.
- "Revised standards for Coal-based Thermal Power Plants". Retrieved 22 February 2016.
- "India to set up FGD plants to cut down emissions from 12 gigawatt coal-fired power projects". Retrieved 26 May 2017.
- "Over 42,000 MW thermal power plants have outlived their lives". Retrieved 22 April 2020.
- "India bans petcoke import for use as fuel". Retrieved 17 August 2018.
- "Boom and Bust 2019: Tracking the Global Coal Plant Pipeline". Retrieved 30 March 2019.
- "Cabinet nod for flexible domestic coal use to cut costs". Retrieved 5 May 2016.
- "India's surging coal imports driven by captive power users". Retrieved 20 August 2018.
- "India boosts purchases of Indonesian coal as prices drop". Retrieved 6 September 2018.
- "SBI chairman says no future for gas-based power plants in the country". Retrieved 4 January 2019.
- "Growing India Becomes Major LNG Player". Retrieved 17 June 2015.
- "Page 71 of World LNG Report - 2015 Edition" (PDF). Retrieved 17 June 2015.
- "Stranded power units may get imported gas at subsidised rates". Retrieved 3 January 2019.
- "Imported LNG scheme ineffective for gas-based plants: India Ratings". Retrieved 17 June 2015.
- "Coal gas can help lower import bill by $10 billion in 5 years: Coal Secy". Retrieved 5 March 2017.
- "Chinese firm plans Thar coal mining in Pakistan". Retrieved 25 August 2014.
- "Reliance Jamnagar coal gasification project" (PDF). Retrieved 15 January 2017.
- "GAIL, Coal India in pact to expand Dankuni gas project". Retrieved 25 August 2014.
- "China's synthetic natural gas revolution" (PDF). Retrieved 5 March 2017.
- "Conversion of Coal to Substitute Natural Gas (SNG)" (PDF). Retrieved 6 August 2014.
- "CO2 EMISSIONS FROM FUEL COMBUSTION HIGHLIGHTS, 2011 Edition" (PDF). International Energy Agency, France. 2011.
- "Details of Retirement of more than 25 years old Coal based Thermal Power Plants (as on 31.03.2018)" (PDF). Retrieved 6 May 2016.
- "Retirement of Brahmapuram and Kozhikode diesel power plants" (PDF). The Economic Times. Archived from the original (PDF) on 10 June 2016. Retrieved 6 May 2016.
- "Global Wind Atlas". Retrieved 4 December 2018.
- Winds of change come to country plagued by power blackouts. Guardian. 31 December 2008. Retrieved on 13 January 2012.
- "Physical Progress (Achievements)". Ministry of New and Renewable Energy, Govt. of India. Retrieved 18 January 2018.
- Seetharaman, G. (27 January 2019). "Hydel power in India is growing at the slowest pace". The Economic Times. Retrieved 29 September 2019.
- Govt to set up $350 million funds to finance solar projects, Hindustan Times, 18 Jan 2018.
- "World Energy Resources Hydro Power, 2016" (PDF). World Energy Council. Retrieved 30 November 2017.
- "Interactive map showing the feasible locations of PSS projects in India". Retrieved 19 November 2019.
- "Prime Minister Modi stated that J&K state could alone provide power to the whole of India". Retrieved 22 June 2019.
- "Solar storage tariff spells trouble for coal". Retrieved 10 February 2020.
- Hydropower Development in India: A Sector Assessment
- "India's renewables revolution needs what other countries are fast adopting: water battery". Retrieved 11 October 2019.
- "DOE Global Energy Storage Database". Retrieved 23 May 2017.
- "Pump Storage Development in India, CEA". Retrieved 23 June 2017.
- "Pumped storage hydropower plant" (PDF). Archived from the original (PDF) on 7 July 2014. Retrieved 2014-08-27.
- "Global Solar Atlas". Retrieved 4 December 2018.
- "Price Quotes (see 'PV spot price')". Retrieved 23 November 2019.
- "Solar". Ministry of New and Renewable Energy, Govt. of India. Archived from the original on 25 February 2014. Retrieved 21 February 2014.
- "Wastelands Atlas of India, 2011". Retrieved 30 May 2014.
- "This Gujarat village is harvesting a sunny crop". Retrieved 3 August 2016.
- "How the world's largest solar park is shaping up in Karnataka". Retrieved 5 March 2017.
- "Population Pyramid of India". PopulationPyramid.net. Retrieved 29 July 2015.
- "How Low Did It Go: 5 Lowest Solar Tariffs Quoted in 2018". Retrieved 9 January 2018.
- "Solar power tariffs drops historic low at Rs2.44 per unit". Retrieved 21 May 2017.
- "The Birth of a New Era in Solar PV — Record Low Cost On Saudi Solar Project Bid". Retrieved 7 October 2017.
- "India's Building A Huge Floating Solar Farm - INDIAN POWER SECTOR". Retrieved 29 July 2015.
- "Central Water Commission". Retrieved 29 July 2015.
- National perspectives for water resources development (accessdate 13 July 2014)
- Brown, Lester R. (19 November 2013). "India's dangerous 'food bubble'". Los Angeles Times. Archived from the original on 4 December 2013. Retrieved 13 July 2014.
- "Installed capacity of wind power projects in India". Retrieved 7 April 2018.
- "State wise wind power installation". Wind Power India.
- "Government working to double generation target from solar parks". Economic Times. 18 July 2016. Retrieved 18 July 2016.
- "Cost of wind keeps dropping, and there's little coal, nuclear can do to stop it". Retrieved 8 November 2017.
- "Wind power tariff firms at Rs 2.5 per unit in SECI auction". Retrieved 6 April 2018.
- "NTPC's Dadri plant generates power from agricultural waste". Retrieved 20 January 2019.
- "Biomass for power generation and CHP" (PDF). International Energy Agency. 2007. Archived from the original (PDF) on 3 November 2011. Retrieved 1 January 2012.
- "Maharashtra, Punjab top producers of green energy from farm waste". Retrieved 31 August 2015.
- "Biomass potential in India". Retrieved 31 August 2018.
- "India was the third-largest energy consumer in 2013". Retrieved 29 July 2016.
- "Delhi's Air Quality Could Improve 90% If Stubble-Burn In Fields Is Stopped". Retrieved 20 October 2017.
- "Torrefied Biomass: Available, Efficient, CO2 Neutral and Economic – likely the best solid biomass on the market". Retrieved 6 April 2017.
- "Cofiring of biomass in coal-fired power plants – European experience". Archived from the original on 12 October 2016. Retrieved 18 September 2014.
- "CEA has written to all States to use 5-10% of biomass pellets with coal for power generation in thermal power plants". Retrieved 22 February 2018.
- "India, Sweden discuss tech solutions to reduce industrial emissions". Retrieved 3 December 2019.
- "NTPC invites bids for procurement of agro Residue for its Dadri power plant". Retrieved 8 February 2018.
- "CEA releases policy to promote power generation from paddy straw". Retrieved 25 November 2017.
- "Air Pollution: Delhi sees hope as NTPC steps in to buy crop residue from farmers". Retrieved 25 September 2017.
- "Domestic REC Market". Retrieved 6 April 2018.
- "Renewable purchase obligations enforcement is not our remit: Power regulator". Retrieved 6 April 2017.
- "NTPC adopts sustainable measures to curb pollution". Retrieved 6 January 2020.
- "Overview of Wood Pellet Co-firing" (PDF). Retrieved 26 February 2017.
- "Year End Review – 2011". Press Information Bureau, Government of India. December 2011.
- "Compressed biogas to beat petrol and diesel with 30% higher mileage". Retrieved 18 November 2018.
- "BioProtein Production" (PDF). Archived from the original (PDF) on 10 May 2017. Retrieved 31 January 2018.
- Le Page, Michael (10 November 2016). "Food made from natural gas will soon feed farm animals – and us". New Scientist. Retrieved 31 January 2018.
- "New venture selects Cargill's Tennessee site to produce Calysta FeedKind® Protein". Retrieved 31 January 2018.
- "Algenol and Reliance launch algae fuels demonstration project in India". Retrieved 29 May 2017.
- "ExxonMobil Announces Breakthrough In Renewable Energy". Retrieved 20 June 2017.
- "Assessment of environmental impact of FeedKind protein" (PDF). Retrieved 20 June 2017.
- "India, Biofuels Annual 2011" (PDF). United States Department of Agriculture: Global Agricultural Information Network. July 2011.
- "Indrapratha Gas, Mahindra & Mahindra join hands to stop stubble burning". Retrieved 20 February 2018.
- "Modi govt plans Gobar-Dhan scheme to convert cattle dung into energy". Retrieved 22 February 2018.
- Geothermal Energy and it's Potential in India | For the Changing Planet. Greencleanguide.com (20 July 2013). Retrieved on 6 December 2013.
- "Geothermal fields of India". Geological Survey of India. 2001.
- "Development of 3.75 MW Durgaduani Mini Tidal Power Project, Sunderbans, West Bengal". NHPC Limited – A Government of India Enterprise. December 2011. Archived from the original on 7 April 2012. Retrieved 2 January 2012.
- Richter, Alexander (4 December 2017). "Potential geothermal development in Puga Valley/ Kashmir – a never ending story". Geothermal Energy News. Retrieved 29 September 2019.
- "Tidal Energy in India". Energy Alternatives India. 2008.
- "Survey of Energy Resources" (PDF). World Energy Council. 2007. pp. 575–576. Archived from the original (PDF) on 25 November 2011. Retrieved 2 January 2012.
- "Overview of power generation, March 2019, CEA". Retrieved 14 May 2019.
- "NPCIL Annual Report, 2009–2010". Nuclear Power Corporation of India Limited. 2010.
- "NPCIL Annual Report, 2010–2011" (PDF). Nuclear Power Corporation of India Limited. 2011.
- "Kudankulam units 3, 4 cost more than doubles over liability issues". The Hindu. PTI. 3 December 2014. ISSN 0971-751X. Retrieved 29 September 2019.CS1 maint: others (link)
- "Panel sought to look into snags at Kudankulam plant". The Hindu. Special Correspondent. 25 April 2019. ISSN 0971-751X. Retrieved 29 September 2019.CS1 maint: others (link)
- "India Steps Up Uranium Exploration After Record Discovery". The Wall Street Journal. 21 July 2011.
- "Which state is the largest producer of uranium in India?". Answers. 20 August 2018. Retrieved 29 September 2019.
- "Nuclear Power in India". Retrieved 29 July 2015.
- "Way forward agreed for Jaitapur reactors". World Nuclear News. 12 March 2018. Retrieved 6 February 2019.
- "National Electricity Plan - Transmission (page 239)" (PDF). Central Electricity Authority. Retrieved 3 March 2019.
- "Growth of Transmission Sector (page 30)" (PDF). Central Electricity Authority.
- the ratio to be multiplied with transmission line capacity (MVA) to give average installed length of transmission line per one MVA of installed substation capacity at each voltage level.
- "Electricity Transmission, USA". Institute for Energy Research. 2 September 2014. Retrieved 31 May 2015.
- "May 2019 Monthly report (page 17), National load dispatch centre, Ministry of Power, Government of India". Retrieved 8 July 2019.
- "Enough transmission capacity till 2022, CEA". Retrieved 3 January 2017.
- "Power Transmission Maps of India, CEA, Government of India,". Retrieved 7 October 2015.
- "Financial indicators, UDAY dash board". Retrieved 25 April 2018.
- "AT& C Losses in Power Distribution" (PDF). Archived from the original (PDF) on 28 May 2015. Retrieved 9 June 2015.
- "U.S. electricity flow, 2018" (PDF). Retrieved 25 April 2019.
- "India loses $86 billion annually to power sector distortions: World Bank". Retrieved 17 December 2018.
- "Indian coal-based power plants fifth most profitable globally". Retrieved 30 November 2018.
- "Merit Order Despatch of Electricity". Retrieved 17 July 2017.
- "Government asks states to purchase short term power through reverse e-auction". Retrieved 5 April 2016.
- "Reverse e-auction lowering power prices. Ind-Ra". Retrieved 26 May 2016.
- "MCX move to launch electricity future faces legal hurdle". Financial Express. The Financial Express. 24 December 2008.
- "Generating companies may get to invite bids from discoms to sell power". Retrieved 23 March 2019.
- "Seriously Stressed and Stranded" (PDF). Retrieved 23 December 2019.
- "Financial distress in India's thermal power sector from $40-60 bn stranded assets". Retrieved 18 August 2018.
- "Subsidies for Fossil Fuels and Renewable Energy, 2018 Update" (PDF). Retrieved 7 January 2019.
- Ignatius Pereira. "'No proposal to bring down power price'". The Hindu. Retrieved 29 July 2015.
- MEHTA, PRADEEP S. "Achilles heel of the power sector". @businessline. Retrieved 30 September 2019.
- "Global Solar Storage Market: A Review Of 2015". 6 April 2016.
- "Analysis of Imports of battery". Retrieved 14 April 2016.
- "Day ahead market (DAM) area prices". Retrieved 14 August 2016.
- "Monthly report on Short-term Transactions of Electricity in India, May 2015 (Refer Table-5)" (PDF). Retrieved 14 August 2015.
- "India's steel industry, like America's, is dominated by electric-based processes". Retrieved 4 January 2018.
- "IEX, Landed Cost Calculator in open access". Retrieved 15 July 2016.
- "Open Access in Indian power sector" (PDF). Retrieved 15 May 2013.
- "Report on Indian electricity grid management requirements". Retrieved 17 December 2017.
- "Draft CERC (Ancillary Services Operations) Regulations, 2015" (PDF). Central Electricity Regulatory Commission, Govt. of India. 2015. Retrieved 15 May 2015.
- "Access to Clean Cooking Energy and Electricity - Survey of States" (PDF). Council on Energy, Environment and Water report. 2015. Retrieved 15 December 2015.
- Samir K Srivastava, Consumers need quality power, The Economic Times, 10 May 2007, pp. 12 (Available at: http://m.economictimes.com/PDAET/articleshow/msid-2024426,curpg-1.cms).
- "Progress report of Pumpset Energisation as on 30-09-2015" (PDF). Retrieved 14 October 2015.
- Anindya Upadhyay; Debjit Chakraborty (22 July 2016). "Top fossil fuel players back PM Narendra Modi's goal to shore up India's clean energy sector". news. Economic Times. Retrieved 22 July 2016.
- "Outstanding dues of power utilities to CPSUs up to July 2014" (PDF). Central Electricity Authority, Govt. of India. 2014. Archived from the original (PDF) on 18 July 2014. Retrieved 23 August 2014.
- "The power paradox". 6 May 2016.
- "Power Tariff Scam Gets Bigger at Rs. 50,000 Crore as Allegations of Equipment Over-Invoicing Emerge". Archived from the original on 19 May 2016. Retrieved 20 May 2016.
- "U.K. National Grid Status". Retrieved 14 October 2015.
- "Energy-efficient buildings – a business case for India? An analysis of incremental costs for four building projects of the Energy-Efficient Homes Programme".
- "Cheaper renewable energy outpaces nuclear power". Retrieved 21 March 2016.
- "Power Sector in India: White paper on Implementation Challenges and Opportunities" (PDF). KPMG. January 2010.
- "Grid Security – Need For Tightening of Frequency Band & Other Measures" (PDF). Central Electricity Regulatory Commission. Retrieved 2 December 2016.
- Bhaskar, Utpal (1 January 2014). "India is now one nation, one grid". Livemint. Retrieved 2 December 2016.
- "India To Export Another 500 MW Power To Bangladesh In Next 12 Months: NLDC". Retrieved 15 July 2015.
- "Table 13, Monthly operation report, March 2015" (PDF). POSOCO, Govt. of India. March 2015. Archived from the original (PDF) on 24 May 2015. Retrieved 24 April 2015.
- https://brage.bibsys.no/xmlui/bitstream/id/419902/14083_FULLTEXT.pdf
- http://southasiajournal.net/prospect-of-a-saarc-power-grid/
- "Bangladesh looks to increase power import from India". Retrieved 17 August 2018.
- "Select 'Energy' sections of Pakistan, Burma, Bangladesh, Nepal, Bhutan & Sri Lanka. The world Fact book". Retrieved 17 February 2013.
- "LNG: The whole truth in Pakistan". Retrieved 3 May 2015.
- "How Much Do Power Sector Distortions Cost South Asia?" (PDF). World Bank Group. Retrieved 27 December 2018.
- "Saarc Chamber Pushes for Seamless Regional Energy Trade". Retrieved 31 July 2015.
- "Turning India's power surplus into a boon". Retrieved 26 October 2016.
- "Indian Petroleum & Natural Gas statistics". Retrieved 25 April 2017.
- "India challenges China as world's biggest LPG importer". Retrieved 27 December 2017.
- "All India coal-fired stations performance (2014-15)". Retrieved 27 May 2014.
- "Niti Aayog pitches for electricity as clean cooking option to LPG". Retrieved 13 April 2016.
- "How rural India can be made to switch to eco-friendly electric stoves". Retrieved 22 May 2019.
- "WELLS, WIRES AND WHEELS…". BNP PARIBAS ASSET MANAGEMENT. August 2019. Retrieved 5 August 2019.
- "Plans afoot to make India 100% e-vehicle nation by 2030. Piyush Goyal". Retrieved 26 March 2016.
- "Explaining the Surging Demand for Lithium-Ion Batteries". Retrieved 5 May 2016.
- "Sweden is building an electric road that will charge car as you drive". Retrieved 12 May 2019.
- "Made in India - Aglaya to Release Wireless Electricity Transmission for Defence and Intelligence Deployment at the Indian DefExpo 2016". Retrieved 5 March 2016.
- "Review of Recent Advances in Dynamic and Omnidirectional Wireless Power Transfer" (PDF). Retrieved 7 July 2016.
- "CIA - The World Factbook". 9 March 2013. Archived from the original on 9 March 2013. Retrieved 30 September 2019.
- "India starts testing shale-gas plays". Oil and Gas Journal. 5 December 2011.
External links
- National electricity Plan - 2012, CEA, Government of India
- Electricity grid maps of the southern region
- India's Energy Policy and Electricity Production
Electricity sector in Asia | |
|---|---|
| Sovereign states |
|
| States with limited recognition |
|
| Dependencies and other territories |
|
| |
| Companies |
|
|---|---|
| Governance |
|
| Currency |
|
| Financial services |
|
| History |
|
| People |
|
| States |
|
| Sectors |
|
| |