Energy policy of India
The energy policy of India is largely defined by the country's expanding energy deficit and increased focus on developing alternative sources of energy,[1] particularly nuclear, solar and wind energy. India ranks 81 position in overall energy self-sufficiency at 66% in 2014.[2][3]
The primary energy consumption in India grew by 7.9% in 2018 and is the third biggest after China and USA with 5.8% global share.[4][5] The total primary energy consumption from coal (452.2 Mtoe; 55.88%), crude oil (239.1 Mtoe; 29.55%), natural gas (49.9 Mtoe; 6.17%), nuclear energy (8.8 Mtoe; 1.09%), hydro electricity (31.6 Mtoe; 3.91%) and renewable power (27.5 Mtoe; 3.40%) is 809.2 Mtoe (excluding traditional biomass use) in the calendar year 2018.[4] In 2018, India's net imports are nearly 205.3 million tons of crude oil and its products, 26.3 Mtoe of LNG and 141.7 Mtoe coal totaling to 373.3 Mtoe of primary energy which is equal to 46.13% of total primary energy consumption. India is largely dependent on fossil fuel imports to meet its energy demands – by 2030, India's dependence on energy imports is expected to exceed 53% of the country's total energy consumption.[1] About 80% of India's electricity generation is from fossil fuels. India is surplus in electricity generation and also marginal exporter of electricity in 2017.[6] Since the end of calendar year 2015, huge power generation capacity has been idling for want of electricity demand.[7] India ranks second after China in renewables production with 208.7 Mtoe in 2016.[2]
In 2017-18, the per-capita energy consumption is 23.355 Giga Joules (0.558 Mtoe) excluding traditional biomass use and the energy intensity of the Indian economy is 0.2332 Mega Joules per INR (56 kcal/INR).[8][9] Due to rapid economic expansion, India has one of the world's fastest growing energy markets and is expected to be the second-largest contributor to the increase in global energy demand by 2035, accounting for 18% of the rise in global energy consumption.[10] Given India's growing energy demands and limited domestic oil and gas reserves, the country has ambitious plans to expand its renewable and most worked out nuclear power programme.[11] India has the world's fourth largest wind power market and also plans to add about 100,000 MW of solar power capacity by 2020.[12][13] India also envisages to increase the contribution of nuclear power to overall electricity generation capacity from 4.2% to 9% within 25 years.[14] The country has five nuclear reactors under construction (third highest in the world) and plans to construct 18 additional nuclear reactors (second highest in the world) by 2025.[15] During the year 2018, the total investment in energy sector by India was 4.1% (US$ 75 billion) of US$ 1.85 trillion global investment.[16]
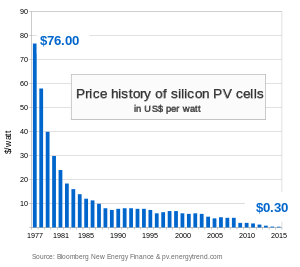
Indian solar power PV tariff has fallen to ₹2.44 (3.4¢ US) per kWh in May 2017 which is lower than any other type of power generation in India.[17] In the year 2019, the levelized tariff in US dollars for solar PV electricity has fallen below 2.00 cents/kWh.[18] Also the international tariff of solar thermal storage power plants has fallen to US$0.063/kWh, which is cheaper than fossil fuel plants.[19][20][21] The cheaper hybrid solar power (mix of solar PV and solar thermal storage power) need not depend on costly and polluting coal/gas fired power generation for ensuring stable grid operation.[22] Solar electricity price is going to become the benchmark price for deciding the other fuel prices (petroleum products, natural gas/biogas/LNG, CNG, LPG, coal, lignite, biomass, etc.) based on their ultimate use and advantages.[23][24]
India: Total primary energy use of 882 Mtoe in 2017[25]
Oil and gas
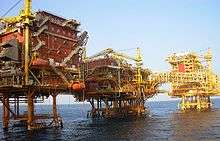
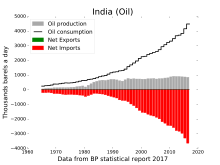
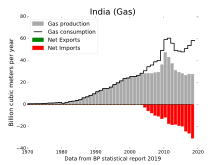
India ranks third in oil consumption with 212.7 million tons in 2016 after USA and China.[26] During the calendar year 2015, India imported 195.1 million tons crude oil and 23.3 million tons refined petroleum products and exported 55 million tons refined petroleum products. India has built surplus world class refining capacity using imported crude oil for exporting refined petroleum products. The net imports of crude oil is lesser by one fourth after accounting exports and imports of refined petroleum products.[27] Natural gas production was 29.2 billion cubic meters and consumption 50.6 billion cubic meters during the calendar year 2015.
During the financial year 2012–13, the production of crude oil was 37.86 million tons and 40,679 million standard cubic meters (nearly 26.85 million tons) natural gas. The net import of crude oil & petroleum products is 146.70 million tons worth of Rs 5611.40 billions. This includes 9.534 million tons of LNG imports worth of Rs. 282.15 billions.[28] Internationally, LNG price (One million Btu of LNG = 0.1724 barrels of crude oil (boe) = 24.36 cubic meters of natural gas = 29.2 litres diesel = 21.3 kg LPG) is fixed below crude oil price in terms of heating value.[29][30] LNG is slowly gaining its role as direct use fuel in road and marine transport without regasification.[31][32][33] By the end of June 2016, LNG price has fallen by nearly 50% below its oil parity price making it more economical fuel than diesel/gas oil in transport sector.[34][35] In 2012-13, India consumed 15.744 million tons petrol and 69.179 million tons diesel which are mainly produced from imported crude oil at huge foreign exchange out go. Use of natural gas for heating, cooking and electricity generation is not economical as more and more locally produced natural gas will be converted into LNG for use in transport sector to reduce crude oil imports.[36][37] In addition to the conventional natural gas production, coal gasification, coal bed methane, coal mine methane and Biogas digesters / Renewable natural gas will also become source of LNG forming decentralised base for production of LNG to cater to the widely distributed demand.[38][39][40] There is possibility to convert most of the heavy duty vehicles (including diesel driven rail engines) into LNG fuelled vehicles to reduce diesel consumption drastically with operational cost and least pollution benefits.[41][42][43] Also, the break even price at user end for switching from imported coal to LNG in electricity generation is estimated near US$6 per million British thermal units ($20/MWh).[44] The advent of cheaper marine CNG transport will restrict LNG use in high end transport sector to replace costly liquid fuels leaving imported CNG use for other needs.[45][46][47] As the marine CNG transport is economical for medium distance transport and has fast unloading flexibility at many ports without costly unloading facilities, they have become alternate solution to submarine gas pipelines.[48][49] Natural gas/methane can also be converted cheaply in to hydrogen gas and carbon black without emitting any green house gas for use in transport sector with fuel cell vehicle technology.[50]
The state-owned Oil and Natural Gas Corporation (ONGC) acquired shares in oil fields in countries like Sudan, Syria, Iran, and Nigeria – investments that have led to diplomatic tensions with the United States.[51] Because of political instability in the Middle East and increasing domestic demand for energy, India is keen on decreasing its dependency on OPEC to meet its oil demand, and increasing its energy security. Several Indian oil companies, primarily led by ONGC and Reliance Industries, have started a massive hunt for oil in several regions in India, including Rajasthan, Krishna Godavari Basin and north-eastern Himalayas.[52]
India has nearly 63 tcf technically recoverable resources of shale gas which can meet all its needs for twenty years if exploited.[53][54][55] India is developing an offshore gas field in Mozambique.[56] The proposed Iran-Pakistan-India pipeline is a part of India's plan to meet its increasing energy demand.
Coal
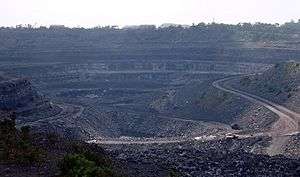
India has the world's 5th largest proven coal reserves. In India, coal is the bulk primary energy contributor with 56.90% share equivalent to 452.2 Mtoe in 2018.[4] India’s coal production has only fallen once in the last 30 years when the figure fell from 319 mt in 1997 to 316 mt in 1998.
India is also the second-largest importer of coal 141.7 Mtoe in 2018 and the second-largest consumer of coal with 452.2 Mtoe in 2018.[4] India is also home to the world’s largest coal company, Coal India Ltd, which controls 85% of the country’s coal production.[57] with 7.8% production share of coal (including lignite) in the world. Top five hard and brown coal producing countries in 2013 (2012) are (million tons): China 3,680 (3,645), United States 893 (922), India 605 (607), Australia 478 (453) and Indonesia 421 (386). However, India ranks fifth in global coal production at 228 mtoe (5.9%) in 2013 when its inferior quality coal tonnage is converted into tons of oil equivalent.[29] Coal-fired power plants account for 59% of India's installed electricity capacity.[58][59] After electricity production, coal is also used for cement production in substantial quantity.[60] In 2013, India imported nearly 95 Mtoe of steam coal and coking coal which is 29% of total consumption to meet the demand in electricity, cement and steel production.[29] Pet coke availability, at cheaper price to local coal, is replacing coal in cement plants.[61]
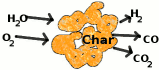
Gasification of coal or lignite or pet coke produces syngas or coal gas or coke oven gas which is a mixture of hydrogen, carbon monoxide and carbon dioxide gases.[62] Coal gas can be converted into synthetic natural gas (SNG) by using Fischer–Tropsch process at low pressure and high temperature.[63] Coal gas can also be produced by underground coal gasification where the coal deposits are located deep in the ground or uneconomical to mine the coal.[64] CNG and LNG are emerging as economical alternatives to diesel oil with the escalation in international crude oil prices.[65] Synthetic natural gas production technologies have tremendous scope to meet the transport sector requirements fully using the locally available coal in India.[39][66] Dankuni coal complex is producing syngas which is piped to the industrial users in Calcutta.[67][68] Many coal based fertiliser plants which are shut down can also be retrofitted economically to produce SNG as LNG and CNG fetch good price by substituting imports.[69] Recently, Indian government fixed the natural gas price at producer end as US$5.61 per million British thermal units ($19.1/MWh) on net calorific value (NCV) basis, which is at par with the estimated SNG price from coal.[70][71]
Bio-fuels
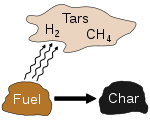
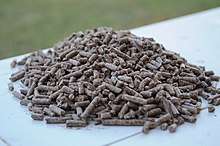
Gasification of bio mass yields wood gas or syngas which can be converted into substitute natural gas by Methanation. Nearly 750 million tons of non edible (by cattle) biomass is available annually in India which can be put to higher value addition use and substitute imported crude oil, coal, LNG, urea fertiliser, nuclear fuels, etc. It is estimated that renewable and carbon neutral biomass resources of India can replace present consumption of all fossil fuels when used productively.
Huge quantity of imported coal is being used in pulverised coal-fired power stations. Raw biomass can not be used in the pulverised coal mills as they are difficult to grind into fine powder due to caking property of raw biomass. However biomass can be used after Torrefaction in the pulverised coal mills for replacing imported coal.[72] North west and southern regions can replace imported coal use with torrefied biomass where surplus agriculture/crop residual biomass is available.[73][74] Biomass power plants can also get extra income by selling the Renewable Purchase Certificates (RPC).[75]
In cement production, carbon neutral biomass is being used to replace coal for reducing carbon foot print drastically.[76][77]
Biogas or natural gas or methane produced from farm/agro/crop/domestic waste can also be used for producing protein rich feed for cattle/fish/poultry/pet animals economically by cultivating Methylococcus capsulatus bacteria culture in a decentralised manner near to the rural / consumption areas with tiny land and water foot print.[78][79][80][24][81] With the availability of CO2 gas as by product from these units, cheaper production cost of algae oil from algae or spirulina particularly in tropical countries like India would displace the prime position of crude oil in near future.[82][83]
India's three Oil Marketing Companies (OMCs) are currently setting up 12 second-generation ethanol plants across the country which will collect agriculture waste from farmers and convert it into bio-ethanol.[84][85] In 2018, India has set target to produce 15 million tons of biogas/bio-CNG by installing 5,000 large scale commercial type biogas plants which can produce daily 12.5 tons of bio-CNG by each plant.[86]
The former President of India, Dr. A. P. J. Abdul Kalam, was a strong advocate of Jatropha cultivation for production of bio-diesel.[87] He said that out of the 6,00,000 km2 of waste land that is available in India over 3,00,000 km2 is suitable for Jatropha cultivation. Once the plant is grown, it has a useful lifespan of several decades. A plan for supplying incentives to encourage the use of Jatropha has been coloured with green stripes. Biopropane is also produced from non-edible vegetable oils, used cooking oil, waste animal fats, etc.[88][89]
Nuclear power
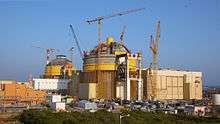
India boasts a quickly advancing and active nuclear power programme. It is expected to have 20 GW of nuclear capacity by 2020, though it currently stands as 9th in the world in terms of nuclear capacity.
An Achilles' heel of the Indian nuclear power programme, however, is the fact that India is not a signatory of the Nuclear Non-Proliferation Treaty. This has many times in its history prevented it from obtaining nuclear technology vital to expanding its nuclear industry. Another consequence of this is that much of its programme has been domestically developed much like its nuclear weapons programme. The United States-India Peaceful Atomic Energy Cooperation Act seems to be a way to get access to advanced nuclear technologies for India.
India has been using imported enriched uranium and is under International Atomic Energy Agency (IAEA) safeguards, but it has developed various aspects of the nuclear fuel cycle to support its reactors. Development of select technologies has been strongly affected by limited imports. Use of heavy-water reactors has been particularly attractive for the nation because it allows uranium to be burnt with little to no enrichment. India has also done a great amount of work in the development of a thorium-centred fuel cycle. While uranium deposits in the nation are extremely limited, there are much greater reserves of thorium, and it could provide hundreds of times the energy with the same mass of fuel. The fact that thorium can theoretically be utilised in heavy water reactors has tied the development of the two. A prototype reactor that would burn uranium-plutonium fuel while irradiating a thorium blanket is under construction at the Madras/Kalpakkam Atomic Power Station.
Uranium used for the weapons programme has been separate from the power programme using uranium from scant indigenous reserves.
Hydro electricity
India is endowed with economically exploitable and viable hydro potential assessed to be about 125,570 MW at 60% capacity factor.[90] India ranked fourth globally by underutilized hydro power potential. In addition, 6,780 MW in terms of installed capacity from Small, Mini, and Micro Hydel schemes have been assessed. Also, 56 sites for pumped storage schemes (PSS) with an aggregate installed capacity of 94,000 MW have been identified for catering to peak electricity demand and water pumping for irrigation needs.[91] It is the most widely used form of renewable energy but the economically exploitable hydro power potential keeps on varying due to technological developments and the comparable cost of electricity generation from other sources. The hydro-electric potential of India ranks 5th in terms of exploitable hydro-potential on global scenario.
The installed capacity of hydro power is 45,315 MW as of 31 May 2018.[92] India ranks sixth in hydro electricity generation globally after China, Canada, Brazil, USA and Russia. During the year 2017-18, the total hydro electricity generation in India is 126.123 billion kWh which works out to 24,000 MW at 60% capacity factor. Till now, hydroelectricity sector is dominated by the state and central government owned companies but this sector is going to grow faster with the participation of private sector for developing the hydro potential located in the Himalaya mountain ranges including north east of India.[93] However the hydro power potential in central India forming part of Godavari, Mahanadi and Narmada river basins has not yet been developed on major scale due to potential opposition from the tribal population.
Pumped storage schemes are perfect centralized peaking power stations for the load management in the electricity grid. PSS would be in high demand for meeting peak load demand and storing the surplus electricity as India graduates from electricity deficit to electricity surplus. They also produce secondary /seasonal power at no additional cost when rivers are flooding with excess water. Storing electricity by other alternative systems such as batteries, compressed air storage systems, etc is more costlier than electricity production by standby generator.[94] India has already established nearly 4785 MW pumped storage capacity which is part of its installed hydro power plants.[95]
Wind power
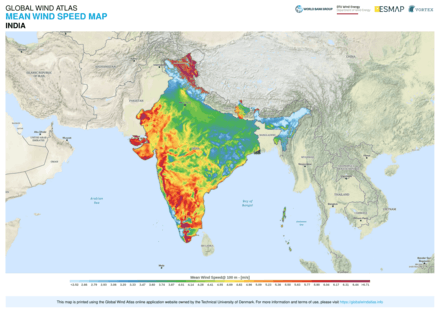
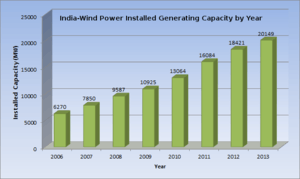
India has the fourth largest installed wind power capacity in the world.[12][97] As of 31 December 2017, the installed capacity of wind power was 32,848 MW an increase of 4148 MW over the previous year[98][99] Wind power accounts nearly 10% of India's total installed power generation capacity and generated 52.666 billion kWh in the fiscal year 2017-18 which is nearly 3% of total electricity generation.[100] The capacity utilisation factor is nearly 16% in the fiscal year 2017-18. The Ministry of New and Renewable Energy (MNRE) of India has announced a revised estimation of the potential wind power resource (excluding offshore wind power potential) from 49,130 MW assessed at 50m Hub heights to 102,788 MW assessed at 80m Hub height at 15% capacity factor.
Solar energy
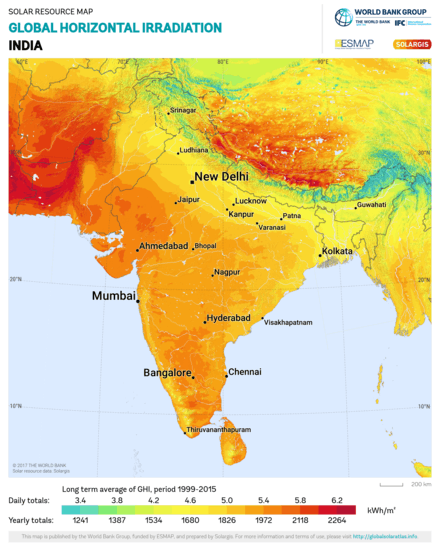
India's solar energy insolation is about 5,000 T kWh per year (i.e. ~ 600 TW), far more than its current total primary energy consumption.[102][103] India's long-term solar potential could be unparalleled in the world because it has the ideal combination of both high solar insolation and a big potential consumer base density.[104][105] Also a major factor influencing a region's energy intensity is the cost of energy consumed for temperature control. Since cooling load requirements are roughly in phase with the sun's intensity, cooling from intense solar radiation could make perfect energy-economic sense in the subcontinent located mostly in the tropics.
Installation of solar power PV plants require nearly 2.0 hectares (5 acres) land per MW capacity which is similar to coal-fired power plants when life cycle coal mining, consumptive water storage & ash disposal areas are also accounted and hydro power plants when submergence area of water reservoir is also accounted. 1.6 million MW capacity solar plants can be installed in India on its 1% land (32,000 square km). There are vast tracts of land suitable for solar power in all parts of India exceeding 8% of its total area which are unproductive barren and devoid of vegetation.[106] Part of waste lands (32,000 square km) when installed with solar power plants can produce 2400 billion kWh of electricity (two times the total generation in 2013-14) with land productivity/yield of 0.9 million Rs per acre (3 Rs/kWh price) which is at par with many industrial areas and many times more than the best productive irrigated agriculture lands.[107] Moreover, these solar power units are not dependent on supply of any raw material and are self productive. There is unlimited scope for solar electricity to replace all fossil fuel energy requirements (natural gas, coal, lignite and crude oil) if all the marginally productive lands are occupied by solar power plants in future. The solar power potential of India can meet perennially to cater per capita energy consumption at par with USA/Japan for the peak population in its demographic transition.[108]
Solar thermal power
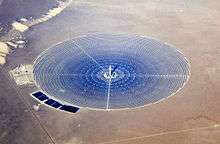
The installed capacity of commercial solar thermal power plants in India is 227.5 MW with 50 MW in Andhra Pradesh and 177.5 MW in Rajasthan.[109] Solar thermal plants are emerging as cheaper (6 Euro ¢/kWh) and clean load following power plants compared to fossil fuel power plants.[110] They can cater the load/ demand perfectly and work as base load power plants when the extracted solar energy is found excess in a day.[111][112] Proper mix of solar thermal and solar PV can fully match the load fluctuations without the need of costly battery storage.[113][19]
Synergy with irrigation water pumping and hydro power stations
The major disadvantage of solar power (PV type only) is that it can not produce electricity during the night time and cloudy day time also. In India, this disadvantage can be overcome by installing pumped-storage hydroelectricity stations. Ultimate electricity requirement for river water pumping (excluding ground water pumping) is 570 billion kWh to pump one cubic meter of water for each square meter area by 125 m height on average for irrigating 140 million hectares of net sown area (42% of total land) for three crops in a year.[114] This is achieved by utilising all the usable river waters by interlinking Indian rivers by envisaging coastal reservoirs. These river water pumping stations would also be envisaged with pumped-storage hydroelectricity features to generate electricity when necessary to stabilise the grid. Also, all existing and future hydro power stations can be expanded with additional pumped-storage hydroelectricity units to cater night time electricity consumption. Most of the ground water pumping power can be met directly by solar power during daytime. To achieve food security, India needs to achieve water security which is possible only by energy security for harnessing its water resources.[115]
Electric vehicles
The retail prices of petrol and diesel are high in India to make electricity driven vehicles more economical as more and more electricity is generated from solar energy in near future without appreciable environmental effects. During the year 2018, many IPPs offered to sell solar power below 3.00 Rs/kWh to feed into the high voltage grid.[116] This price is far below the affordable retail electricity tariff for the solar power to replace petrol and diesel use in transport sector.[117]
The retail price of diesel is 53.00 Rs/litre in 2012-13. The affordable electricity retail price (860 kcal/kWh at 75% input electricity to shaft power efficiency) to replace diesel (lower heating value 8572 kcal/litre at 40% fuel energy to crank shaft efficiency) is 9.97 Rs/kWh. The retail price of petrol is 75.00 Rs/litre in 2012-13. The affordable electricity retail price (860 kcal/kWh at 75% input electricity to shaft power efficiency) to replace petrol (lower heating value 7693 kcal/litre at 33% fuel energy to crank shaft efficiency) is 19.06 Rs/kWh. In 2012-13, India consumed 15.744 million tons petrol and 69.179 million tons diesel which are mainly produced from imported crude oil at huge foreign exchange out go.[117][28]
V2G is also feasible with electricity driven vehicles to contribute for catering to the peak load in the electricity grid. The electricity driven vehicles would become popular in future when its energy storage / battery technology becomes more compact, lesser density, longer lasting and maintenance free.[118][119]
Hydrogen energy
Hydrogen Energy programme started in India after joining the IPHE (International Partnership for Hydrogen Economy) in the year 2003. There are nineteen other countries including Australia, United States, UK, Japan, etc.[120] This global partnership helps India to set up commercial use of Hydrogen gas as an energy source. Ministry of New and Renewable Energy (MNRE) is the focal government agency associated with hydrogen energy development in India.[121]
Hydrogen is a carbon neutral fuel.[122][123] Solar electricity prices in India have already fallen below the affordable price (≈ INR 5.00 per Kwh to generate 0.041 lb/Kwh hydrogen which is equivalent to 0.071 litres of petrol in terms of lower heating value) to make hydrogen economical fuel by sourcing from electrolysis of water to replace petrol/gasoline as transport fuel.[124][125][120] Vehicles with fuel cell technology based on hydrogen gas are nearly twice more efficient compared to diesel/petrol fueled engines.[120][126][127] Hydrogen can also be generated cheaply by splitting methane using electricity without emitting any green house gas.[50] A luxury FCEV car generates one litre of bottled quality drinking water for every 10 km ride which is a significant by product.[128] Also FCEV does not emit any particulate matter but removes particulate matter up to PM2.5 from the ambient air.[129] Any medium or heavy duty vehicle can be retrofitted in to fuel cell vehicle as its system power density (watts/litre) and system specific power (watts/kg) are comparable with that of internal combustion engine.[130][131] The cost and durability of fuel cell engines with economies of scale production line are comparable with the petrol/diesel engines.[132][133]
The excess power generation capacity available in India is nearly 500 billion units/year presently and another 75,000 MW conventional power generating capacity is in pipeline excluding the targeted 175,000 MW renewable power by 2022.[134][135][7] The hydrogen fuel generated by 500 billion units of electricity can replace all diesel and petrol consumed by heavy and medium duty vehicles in India completely obviating the need of crude oil imports for internal consumption.[136] Converting petrol/diesel driven road vehicles in to fuel cell electric vehicles on priority would save the huge import cost of crude oil and transform the stranded electricity infrastructure in to productive assets with major boost to the overall economic growth.
Electricity as substitute to imported LPG and kerosene
The net import of LPG is 6.093 million tons and the domestic consumption is 13.568 million tons with Rs. 41,546 crores subsidy to the domestic consumers in 2012-13.[137][28] The LPG import content is nearly 40% of total consumption in India. The affordable electricity retail price (860 kcal/kWh at 90% heating efficiency) to replace LPG (lower heating value 11,000 kcal/kg at 75% heating efficiency) in domestic cooking is 6.47 Rs/kWh when the retail price of LPG cylinder is Rs 1000 (without subsidy) with 14.2 kg LPG content. Replacing LPG consumption with electricity reduces its imports substantially.
The domestic consumption of Kerosene is 7.349 million tons with Rs. 30,151 crores subsidy to the domestic consumers in 2012-13. The subsidised retail price of Kerosene is 13.69 Rs/litre whereas the export/import price is 48.00 Rs/litre. The affordable electricity retail price (860 kcal/kWh at 90% heating efficiency) to replace Kerosene (lower heating value 8240 kcal/litre at 75% heating efficiency) in domestic cooking is 6.00 Rs/kWh when Kerosene retail price is 48 Rs/litre (without subsidy).
During the year 2013-14, The plant load factor (PLF) of coal-fired thermal power stations is only 65.43% whereas these stations can run above 85% PLF comfortably provided there is adequate electricity demand in the country.[138] The additional electricity generation at 85% PLF is nearly 240 billion units which is adequate to replace all the LPG and Kerosene consumption in domestic sector.[139] The incremental cost of generating additional electricity is only their coal fuel cost which is less than 3 Rs/kWh. Enhancing the PLF of coal-fired stations and encouraging domestic electricity consumers to substitute electricity in place of LPG and Kerosene in household cooking, would reduce the government subsidies and idle capacity of thermal power stations can be put to use economically. The domestic consumers who are willing to surrender the subsidised LPG / Kerosene permits or eligible for subsidized LPG / Kerosene permits, may be given free electricity connection and subsidized electricity tariff.[140]
In December 2018, IPPs are offering to sell solar power below 2.90 Rs/kWh to feed into the high voltage grid.[141] This price is below the affordable electricity tariff for the solar power to replace LPG and Kerosene use at subsidized price of LPG or Kerosene in domestic sector.[142] Two wheelers and three wheelers consume 62% and 6% of petrol respectively in India. The saved LPG/Autogas replaced by electricity in domestic sector can be used by two and three wheelers with operational cost and least pollution benefits.[41][143] LPG is also used in heavy duty vehicles / boats / trains / off road construction or mining or farming or other equipment to replace diesel or petrol with economy and environmental advantages.[144] It is also possible to convert the existing heavy duty diesel engines to dual fuel with LPG for reducing the PM10 particulate emissions.[144] Existing petrol engines can be converted at low cost in to 100% LPG or dual fuel with LPG for achieving enhanced fuel efficiency and economy with drastically reduced emissions.[145][144] Non-subsidy LPG prices are below the diesel or petrol prices in India in terms of heat content (heat content wise one kg of LPG is equal to 1.85 liters of LPG or 1.37 liters of diesel oil or 1.48 liters of petrol).[146] Cheaper butane, a constituent of LPG (propane and butane mixture), can be directly mixed with petrol/gasoline for better use in vehicles.[147] Instead of using LPG as heating fuel in domestic sector, for higher end usage, propane can also be converted into alkylate which is a premium gasoline blending stock because it has exceptional antiknock properties and gives clean burning.[148]
Power to food
The Methane / natural gas generated from water with electricity, can be utilized to produce protein rich feed for fish/poultry/cattle which is known as power to food.[149][80][24]
Energy trading with neighbouring countries
The per capita electricity consumption is low compared to many countries despite cheaper electricity tariff in India.[150] Despite low electricity per capita consumption in India, the country is going to achieve surplus electricity generation during the 12th plan (2012 to 2017) period provided its coal production and transport infrastructure is developed adequately.[151][152][153] India has been exporting electricity to Bangladesh and Nepal and importing excess electricity in Bhutan.[154][155] Surplus electricity can be exported to the neighbouring countries in return for natural gas supplies from Pakistan, Bangladesh and Myanmar.[156]
Bangladesh, Myanmar and Pakistan are producing substantial natural gas and using for electricity generation purpose.[157] Bangladesh, Myanmar and Pakistan produce 55 million cubic metres per day (mcmd), 9 mcmd and 118 mcmd out of which 20 mcmd, 1.4 mcmd and 34 mcmd are consumed for electricity generation respectively.[158][159] Whereas the natural gas production in India is not even adequate to meet its non-electricity requirements.[160]
Bangladesh, Myanmar and Pakistan have proven reserves of 200 billion cubic metres (bcm), 1200 bcm and 500 bcm respectively.[4] There is ample opportunity for mutually beneficial trading in energy resources with these countries.[161] India can supply its surplus electricity to Pakistan and Bangladesh in return for the natural gas imports by gas pipe lines.[162] Similarly India can develop on BOOT basis hydro power projects in Bhutan, Nepal and Myanmar. India can also enter into long term power purchase agreements with China for developing the hydro power potential in Brahmaputra river basin of Tibet region. India can also supply its surplus electricity to Sri Lanka by undersea cable link. There is ample trading synergy for India with its neighbouring countries in securing its energy requirements.[163]
Policy framework
In general, India's strategy is the encouragement of the development of renewable sources of energy by the use of incentives by the federal and state governments.[164] Other examples of encouragement by incentive include the use of nuclear energy (India Nuclear Cooperation Promotion Act), promoting windfarms and solar energy.
A long-term energy policy perspective is provided by the Integrated Energy Policy Report 2006 which provides policy guidance on energy-sector growth.[165] Increasing energy consumption associated primarily with activities in transport, mining, and manufacturing in India needs rethinking on India's energy production.[166]
Recent steep fall in international oil prices due to shale oil production boom, would tilt the energy policy in favour of crude oil / natural gas.[167][168][169][170]
The following trends are manifested in the energy policy to achieve self sufficiency, least pollution and long term sustainability.[171][117]
| Purpose | Preferred fuel | Next preferred fuel | Least preferred fuel |
|---|---|---|---|
| Mobile military hardware | Indigenous diesel, Indigenous petrol | Ethanol, Biodiesel | Nil |
| Air transport | LNG | Biodiesel, Bioethanol[172] | ATF, HSK |
| Marine transport | LNG, FCEV, CNG | Pyrolysis oil, Nuclear fuel, Biodiesel, Bioethanol | LDO, HFO, Bunker fuel, Diesel[173] |
| Heavy duty road vehicles | LNG, FCEV, CNG, LPG | Biodiesel | Diesel, Animal draught power |
| Passenger four wheel vehicles | LPG, LNG, Battery power, FCEV | Biodiesel | Diesel, Petrol |
| Passenger two/three wheel vehicles | LPG, CNG, Battery power | Biodiesel | Petrol, Animal draught power |
| Railways | Electricity, LNG, LPG, FCEV | Biodiesel | Diesel |
| Illumination/ lighting | Electricity | CNG, LPG | Kerosene |
| Cooking | Electricity | CNG, Biochar | Kerosene, LPG, Fire wood |
| Space & water heating | Electricity, Pyrolysis oil, Biochar, Solar energy | CNG | Kerosene, LPG, Fire wood |
| Commercial / Domestic - appliances | Electricity | Battery power | Diesel, Petrol, LPG, CNG |
| Industrial- motive power | Electricity | Bio diesel, Pyrolysis oil | CNG, LPG, Diesel, Petrol |
| Industrial- heating | Biomass, Pyrolysis oil, Biochar, Solar thermal energy, Electricity | Biogas, PNG | Kerosene, LPG, Fire wood |
| Urea fertilizer | Biogas / synthetic gas, Biochar, | Natural gas, Electricity, Indigenous petcock | Naphtha, Coal |
| Water pumping | Electricity | LPG | Kerosene, Diesel, Petrol |
| Agriculture- heating & drying | Biomass, Pyrolysis oil, Solar energy | LPG, Electricity | Diesel, Petrol |
| Agriculture- appliances | Electricity, LPG | Bio diesel, Pyrolysis oil | CNG, Diesel, Petrol |
| Electricity Generation | Solar Power, Wind, Hydro power, biomass, Torrifacted biomass, Biochar, Biogas plant residue | CNG, Animal draught power (peaking power only), pumped-storage hydroelectricity (peaking power only) | Petrol, Diesel, NGL, LPG, LDO, HFO, Naptha, Nuclear, Coal, Petcoke |
| Steel production | Renewable electricity, Charcoal, Biochar | Renewable hydrogen, LPG, CNG[174] | Coke, Coal |
| Cement production | Indigenous petcock, Biomass,[175] Waste organic matter,[176] Renewable electricity | LPG, CNG | Coal |
| Protein rich cattle/fish feed | CNG, PNG, Biogas, LNG | SNG from coal, Coalbed methane, Coal mine methane, SNG from renewable electricity, SNG from indigenous petcock | Nil |
| Industrial- raw materials | As economically required | Nil | Nil |
Electricity generation
The installed capacity of utility power plants is 314.64 GW as on 31 January 2017 and the gross electricity generated by utilities during the year 2015-16 is 1168.359 billion kWh which includes auxiliary power consumption of power generating stations. The installed capacity of captive power plants in industries (1 MW and above) is 50,289 MW as on 31 March 2017 and generated 197 billion kWh in the financial year 2016-17.[177] In addition, there are nearly 75,000 MW aggregate capacity diesel generator sets with units sizes between 100 KVA and 1000 KVA.[178] All India per capita consumption of Electricity is nearly 1,122 kWh during the financial year 2016-17.[177]
Total installed Power generation Capacity (end of April 2017)[179]
| Source | Utilities Capacity (MW) | % | Captive Power Capacity (MW) | % |
|---|---|---|---|---|
| Coal | 194,402.88 | 59.9 | 29,888.00 | 59.43 |
| Hydroelectricity | 44,594.42 | 14.0 | 64.00 | 0.11 |
| Renewable energy source | 50,018.00 | 15.9 | Included in Oil | - |
| Natural Gas | 25,329.38 | 8.1 | 6,061.00 | 12.05 |
| Nuclear | 6,780.00 | 1.8 | - | - |
| Oil | 837.63 | 0.3 | 14,285.00 | 28.41 |
| Total | 329,204.53 | 50,289.00 | 100 |
The total installed utility power generation capacity as on 30 April 2017 with sector wise & type wise break up is as given below.[179]
| Sector | Thermal (MW) | Nuclear (MW) |
Renewable (MW) | Total (MW) | % | ||||
|---|---|---|---|---|---|---|---|---|---|
| Coal | Gas | Diesel | Sub-Total Thermal |
Hydro | Other Renewable | ||||
| Central | 55,245.00 | 7,490.83 | 0.00 | 62,735.83 | 6,780.00 | 11,651.42 | 0.00 | 81,167.25 | 25 |
| State | 65,145.50 | 7,257.95 | 363.93 | 72,767.38 | 0.00 | 29,703.00 | 1,963.80 | 104,447.28 | 32 |
| Private | 74,012.38 | 10,580.60 | 473.70 | 85,066.68 | 0.00 | 3,240.00 | 55,283.33 | 143,590.01 | 43 |
| All India | 194,402.88 | 25,329.38 | 837.63 | 220,569.88 | 6,780.00 | 44,594.42 | 57,260.23 | 329,204.53 | 100 |
| Year | Fossil Fuel | Nuclear | Hydro | Sub total |
RES[181] | Utility and Captive Power | ||||||||||
|---|---|---|---|---|---|---|---|---|---|---|---|---|---|---|---|---|
| Coal | Oil | Gas | Mini hydro |
Solar | Wind | Bio mass |
Other | Sub total |
Utility | Captive | Misc | Total | ||||
| 2018-19[182] | 1,021,997 | 129 | 49,886 | 37,706 | 135,040 | 1,244,758 | 8,703 | 39,268 | 62,036 | 16,325 | 425 | 126,757 | 1,371,517 | 175,000 | na | 1,546,517 |
| 2017-18 | 986,591 | 386 | 50,208 | 38,346 | 126,123 | 1,201,653 | 5,056 | 25,871 | 52,666 | 15,252 | 358 | 101,839 | 1,303,493 | 183,000 | na | 1,486,493 |
| 2016-17 | 944,850 | 262 | 49,100 | 37,663 | 122,313 | 1,154,188 | 7,673 | 12,086 | 46,011 | 14,159 | 213 | 81,949 | 1,236,137 | 197,000 | na | 1,433,392 |
| 2015-16 | 896,260 | 406 | 47,122 | 37,413 | 121,377 | 1,102,578 | 8,355 | 7,450 | 28,604 | 16,681 | 269 | 65,781 | 1,168,359 | 183,611 | na | 1,351,970 |
| 2014-15 | 835,838 | 1,407 | 41,075 | 36,102 | 129,244 | 1,043,666 | 8,060 | 4,600 | 28,214 | 14,944 | 414 | 61,780 | 1,105,446 | 166,426 | na | 1,271,872 |
| 2013-14 | 746,087 | 1,868 | 44,522 | 34,228 | 134,847 | 961,552 | na | 3,350 | na | na | na | 59,615 | 1,021,167 | 156,643 | na | 1,177,810 |
| 2012-13 | 691,341 | 2,449 | 66,664 | 32,866 | 113,720 | 907,040 | na | na | na | na | na | 57,449 | 964,489 | 144,009 | na | 1,108,498 |
| 2011-12 | 612,497 | 2,649 | 93,281 | 32,286 | 130,511 | 871,224 | na | na | na | na | na | 51,226 | 922,451 | 134,387 | na | 1,056,838 |
Notes: Coal includes lignite also; na → data not available;
The total generation from all renewable energy sources is nearly 15% of the total electricity generation (utility and captive) in India.
Energy conservation
Energy conservation has emerged as a major policy objective, and the Energy Conservation Act 2001, was passed by the Indian Parliament in September 2001, 35.5% of the population still live without access to electricity. This Act requires large energy consumers to adhere to energy consumption norms; new buildings to follow the Energy Conservation Building Code; and appliances to meet energy performance standards and to display energy consumption labels. The Act also created the Bureau of Energy Efficiency to implement the provisions of the Act. In 2015, Prime Minister Mr. Modi launched a scheme called Prakash Path urging people to use LED lamps in place of other lamps to drastically cut down lighting power requirement. Energy efficient fans at subsidised price are offered to the electricity consumers by the electricity distribution companies (DisComs) to decrease peak electricity load.[183]
Rural electrification
As on 28 April 2018, all Indian villages were electrified.[184] India has achieved 100% electrification of all rural and urban households. As of 4 January 2019, 211.88 million rural households are provided with electricity, which is nearly 100% of the 212.65 million total rural households.[185] Up to 4 January 2019, 42.937 million urban households are provided with electricity, which is almost 100% of the 42.941 million total urban households. 89% of house holds in the country use LPG drastically reducing the use of traditional fuels – fuelwood, agricultural waste and biomass cakes – for cooking and general heating needs.[186]
See also
|
|
|
|
References
- India's Widening Energy Deficit
- "India – country energy profile, IEA". Retrieved 13 January 2017.
- "India- Energy balance, IEA". Retrieved 6 April 2017.
- "BP Statistical Review 2019" (PDF). Retrieved 15 June 2019.
- "World energy consumption clock". US debt clock org. Retrieved 6 August 2014.
- "India becomes Net Exporter of Electricity for the first Time". Retrieved 15 June 2018.
- "India wont need extra power plants for next three years – Says government report". Retrieved 13 January 2016.
- "Energy statistics, 2019 of India (Table 6.3)" (PDF). CSO, GoI. Retrieved 27 August 2019.
- "India Economic Indicators". Retrieved 10 March 2018.
- "::Welcome to INDIAN RENEWABLE ENERGY AND".
- "India energy security scenarios up to 2047 (IESS 2047)". NITI Aayog, GoI. Archived from the original on 11 September 2015. Retrieved 29 August 2014.
- "Global Wind Statistics 2017" (PDF). Retrieved 25 July 2018.
- "Will try to achieve pledged renewable energy targets in less than four and half years: Piyush Goyal". Retrieved 9 November 2015.
- "Slowdown not to affect India's nuclear plans". Business-standard.com. 21 January 2009. Retrieved 22 August 2010.
- Going nuclear, The Economist
- "World Energy Investment 2019" (PDF). IEA. Retrieved 15 May 2019.
- "Solar power tariffs drops historic low at Rs 2.44 per unit". Retrieved 21 May 2017.
- "Los Angeles seeks record sub-two cent solar power price". Retrieved 29 June 2019.
- "SolarReserve Bids 24-Hour Solar At 6.3 Cents In Chile". Retrieved 29 August 2017.
- "Solar Reserve awarded AU$78/MWh Concentrated Solar Power contract". Retrieved 23 August 2017.
- "UAE's push on concentrated solar power should open eyes across world". Retrieved 26 September 2017.
- "Dispatchable Concentrated Solar Power Broke Price Records in 2017". Retrieved 22 September 2017.
- "Storing The Sun's Energy Just Got A Whole Lot Cheaper". Retrieved 23 May 2016.
- "Food made from natural gas will soon feed farm animals – and us". Retrieved 31 January 2018.
- "Energy Policy Review India 2020". Retrieved 9 January 2020.
- "Oil consumption grows fastest in India". Retrieved 20 June 2017.
- "BP Statistical Review of world energy 2016 (page 19)" (PDF). Retrieved 21 April 2016.
- "Indian PNG statistics" (PDF). Archived from the original (PDF) on 5 December 2014. Retrieved 25 April 2014.
- "Statistical Review of world energy 2016" (PDF). Retrieved 17 February 2017.
- "World Estimated LNG Landed Prices" (PDF). Retrieved 31 October 2019.
- "LNG-buses to debut in Kerala, import capacity to be doubled: Dharmendra Pradhan". Retrieved 13 October 2016.
- Petronet pitches for LNG as auto fuel
- "Assessment of the fuel cycle impact of liquefied natural gas as used in international shipping" (PDF). Retrieved 6 June 2014.
- "The US Drives Forward To Become A Player On The World LNG Market". Retrieved 1 July 2016.
- "Bunker fuel spot price". Retrieved 6 June 2016.
- "The On-Road LNG Transportation Market in the US" (PDF). Archived from the original (PDF) on 29 April 2014. Retrieved 6 June 2014.
- "Gas at the gates of oil's transport fuel citadel". Retrieved 6 June 2014.
- "India trucking into gas age as govt clears norms for LNG stations". Retrieved 27 August 2017.
- "Techno-economic and environmental analysis of coal-based synthetic natural gas process in China". Missing or empty
|url=(help) - "Chapter 7 of World LNG Report – 2014 Edition" (PDF). Retrieved 17 April 2015.
- "Sections 10.1.3 to 10.2.8, Auto Fuel Vision and policy, 2025, GoI" (PDF). Retrieved 16 June 2014.
- "LNG vehicles". Retrieved 25 June 2014.
- "Why LNG for heavy vehicles?". Retrieved 25 June 2014.
- "Page 71 of World LNG Report – 2015 Edition" (PDF). Retrieved 17 June 2015.
- "Launch of Jayanti Baruna: World's First CNG Carrier". Archived from the original on 10 September 2017. Retrieved 17 August 2017.
- "Marine CNG Transportation" (PDF). Retrieved 17 March 2017.
- "Compressed Natural Gas (CNG) Shipping in Indonesia" (PDF). Retrieved 17 March 2017.
- "GEV secures site for CNG export terminal at port of Chabahar, Iran for gas supply to India". Retrieved 27 April 2018.
- "Gas carriers they have come a long way". Retrieved 17 August 2017.
- "The Future of Hydrogen (page 41)" (PDF). Retrieved 28 May 2019.
- "Energy Security India, Allianz Knowledge". 27 May 2008. Retrieved 3 July 2008.
- "BP India says India can produce 10-15 tcf of gas by 2022". Retrieved 17 August 2016.
- "GEECL plans to exploit shale worth $2.78 billion at its Raniganj (South) block". Retrieved 15 November 2018.
- "Private Entities To Explore Shale Oil And Gas In India". Retrieved 17 July 2018.
- "Essar Oil & Gas to spend $ 1 bn in Raniganj for shale gas". Retrieved 13 July 2018.
- "Indian State Owned Energy Firms Plan $6 bn Investment in Mozambique Gas Field". 27 May 2008. Retrieved 3 May 2015.
- "Who are the top five coal producing countries in the world?". Power Technology | Energy News and Market Analysis. 19 August 2019. Retrieved 16 January 2020.
- "Power sector at a glance: All India data". Ministry of Power, Government of India. September 2013.
- "The coal resource, a comprehensive overview of coal". World Coal Institute. March 2009.
- "Coalnomics" (PDF). September 2014.
- "Why imported pet coke dampened Coal India's cement linkage auction". Retrieved 9 April 2017.
- "Coal gas can help lower import bill by $10 billion in 5 years: Coal Secy". Retrieved 5 March 2017.
- "Test Year for Chinese Coal-Based SNG" (PDF). Retrieved 25 August 2014.
- "Chinese firm plans Thar coal mining in Pakistan". Retrieved 25 August 2014.
- "LNG use in High horse power off road vehicles". Retrieved 25 August 2014.
- "Next energy revolution will be on roads and railroads". Retrieved 25 August 2014.
- "GAIL, Coal India in pact to expand Dankuni gas project". Retrieved 25 August 2014.
- "Reliance Jamnagar coal gasification project" (PDF). Retrieved 15 January 2017.
- "Coal India, Gail to invest 9000 crores in Talcher Plant". Retrieved 25 December 2014.
- "Govt raises natural gas price to $5.61 per unit". Retrieved 25 October 2014.
- "Conversion of Coal to Substitute Natural Gas (SNG)" (PDF). Retrieved 6 August 2014.
- "Torrefied Biomass: Available, Efficient, CO2 Neutral and Economic – likely the best solid biomass on the market". Retrieved 6 April 2017.
- "CEA has written to all States to use 5-10% of biomass pellets with coal for power generation in thermal power plants". Retrieved 22 February 2018.
- "NTPC invites bids for procurement of agro Residue for its Dadri power plant". Retrieved 8 February 2018.
- "Renewable purchase obligations enforcement is not our remit: Power regulator". Retrieved 6 April 2017.
- "Lafargeholcim - Geocycle secures biomass needs from local farmers in India". Retrieved 21 June 2018.
- "New IEA Report: Renewable Energy for Industry". Retrieved 21 June 2018.
- "Indrapratha Gas, Mahindra & Mahindra join hands to stop stubble burning". Retrieved 20 February 2018.
- "360-degree plan to convert cattle dung into energy". Retrieved 22 February 2018.
- "BioProtein Production" (PDF). Archived from the original (PDF) on 10 May 2017. Retrieved 31 January 2018.
- "New venture selects Cargill's Tennessee site to produce Calysta FeedKind® Protein". Retrieved 31 January 2018.
- "Algenol and Reliance launch algae fuels demonstration project in India". Retrieved 29 May 2015.
- "ExxonMobil Announces Breakthrough In Renewable Energy". Retrieved 20 June 2017.
- "India can replace Rs 1 lakh crore worth of hydrocarbon imports by bio-fuels: Pradhan". Retrieved 8 July 2017.
- "Bio-fuel business to pick up in India: Atul Mulay, Praj Industries". Retrieved 30 March 2018.
- "Compressed biogas to beat petrol and diesel with 30% higher mileage". Retrieved 18 November 2018.
- "Kalam to attend Jatropha planters' convention". India eNews Pvt. Ltd. Retrieved 8 July 2006.
- "47 lakh kg used cooking oil collected since Aug; 70% converted into bio-diesel". Retrieved 29 December 2019.
- "Neste delivers first batch of 100% renewable propane to European market". Retrieved 3 December 2018.
- "World Energy Resources Hydro Power, 2016" (PDF). World Energy Council. Retrieved 30 November 2017.
- "Interactive map showing the feasible locations of PSS projects in India". Retrieved 19 November 2019.
- "List of Hydro Electric Stations in the Country". Central Electricity Authority, GoI. Retrieved 30 August 2018.
- "List of Hydro projects under execution" (PDF). Central Electricity Authority, Ministry of Power, Government of India. April 2014. Archived from the original (PDF) on 18 July 2014. Retrieved 21 August 2014.
- "India's renewables revolution needs what other countries are fast adopting: water battery". Retrieved 11 October 2019.
- "Pump Storage Development in India, CEA". Retrieved 23 June 2017.
- "Global Wind Atlas". Retrieved 4 December 2018.
- "Wind atlas of India". Retrieved 28 August 2014.
- "Indian Wind Energy and Economy". Indianwindpower.com. Archived from the original on 17 August 2013. Retrieved 6 August 2013.
- Ministry of New and Renewable Energy – Achievements Archived 1 March 2012 at the Wayback Machine. Mnre.gov.in (31 October 2013). Retrieved on 6 December 2013.
- "Monthly Renewable Energy Generation Reports, CEA" (PDF). Retrieved 6 May 2018.
- "Global Solar Atlas". Retrieved 4 December 2018.
- Muneer, Tariq; Asif, Muhammad; Munawwar, Saima (2005). "Sustainable production of solar electricity] with particular reference to the Indian economy". Renewable and Sustainable Energy Reviews. 9 (5): 444–473. doi:10.1016/j.rser.2004.03.004.
- "Renewing India – Under Heading:Solar Photovoltaics". Archived from the original on 11 September 2007. Retrieved 5 September 2007.
- Solar LEDs Brighten Rural India's Future
- Solar plan for Indian computers
- "Waste lands atlas of India, 2011". Retrieved 30 May 2014.
- "This Gujarat village is harvesting a sunny crop". Retrieved 30 July 2016.
- Population pyramids of India from 1950 to 2100
- "DOE Energy storage database". Retrieved 21 August 2017.
- "Controllable solar power – competitively priced for the first time in North Africa". Retrieved 7 June 2019.
- "Aurora: What you should know about Port Augusta's solar power-tower". Retrieved 22 August 2017.
- "Concentrated Solar Power Dropped 50% in Six Months". Retrieved 30 October 2017.
- "SolarReserve receives environmental approval 390 MW solar thermal facility storage in Chile". Archived from the original on 29 August 2017. Retrieved 29 August 2017.
- India – Land and Water Resources at a glance, CWC (accessdate 12 June 2014)
- Brown, Lester R. (29 November 2013). "India's dangerous 'food bubble'". Los Angeles Times. Archived from the original on 4 December 2013. Retrieved 10 December 2013.
- "Solar Tariffs in India Remain Steady at ₹2.44/kWh in SECI's 3 GW Auction". 13 July 2018. Retrieved 14 July 2018.
- "WELLS, WIRES AND WHEELS…". BNP PARIBAS ASSET MANAGEMENT. August 2019. Retrieved 5 August 2019.
- "Plans afoot to make India 100% e-vehicle nation by 2030. Piyush Goyal". Retrieved 26 March 2016.
- "Explaining the Surging Demand for Lithium-Ion Batteries". Retrieved 5 May 2016.
- "Hydrogen Fuel Cell Engines and Related Technologies" (PDF). NASA Sti/Recon Technical Report N. 03: 01951. 2001. Bibcode:2001STIN...0301951. Retrieved 28 August 2014.
- "Hydrogen Energy and Fuel Cells in India" (PDF). 2016. Retrieved 28 August 2016.
- "Hydrogen Council". Retrieved 22 October 2019.
- "Race Heats Up For Title Of Cheapest Solar Energy In The World". Retrieved 28 October 2019.
- "Hydrogen continues to be a fuel of the future". Retrieved 28 August 2016.
- "8 Things You Need To Know About Hydrogen Fuel-Cell Cars". Retrieved 28 August 2016.
- "Fuel Cell and Battery Electric Vehicles Compared" (PDF). Retrieved 28 May 2018.
- "Hydrogen fuel reaches lift-off". Retrieved 28 June 2017.
- "2016 Toyota Mirai Fuel-Cell Sedan". Retrieved 28 August 2016.
- "Doosan Corporation to supply 50MW hydrogen fuel cell power plant". Retrieved 28 August 2018.
- "automotive fuel cell metrics" (PDF). Retrieved 28 August 2016.
- "Mahindra electric car specifications". Retrieved 28 August 2016.
- "The breakdown: hydrogen on the horizon". Retrieved 28 May 2017.
- "One Fuel Cell Bus in the U.S. Has Exceeded the DOE/DOT Target of 25,000 Hours and More Are Getting Close". Retrieved 28 March 2019.
- "India can achieve 1,650 billion units of electricity next year, Piyush Goyal". Retrieved 9 July 2016.
- "Review of progress of thermal power projects under execution. October 2016 (see page 27)" (PDF). Retrieved 23 November 2016.
- "Tata Motors reveals India's first hydrogen fuel cell bus". Retrieved 25 January 2017.
- "India challenges China as world's biggest LPG importer". Retrieved 27 December 2017.
- "All India coal fired stations performance (2013-14)" (PDF). Archived from the original (PDF) on 28 May 2014. Retrieved 27 May 2014.
- "Niti Aayog pitches for electricity as clean cooking option to LPG". Retrieved 13 April 2016.
- India, Press Trust of (21 May 2019). "How rural India can be made to switch to eco-friendly electric stoves". Business Standard India. Retrieved 22 May 2019.
- "Foreign players sweep Gujarat solar auction". Retrieved 22 December 2018.
- "Petroleum Prices and Under-Recoveries" (PDF). Retrieved 17 March 2019.
- "Auto LPG prices in India". Retrieved 20 March 2019.
- "LPG for Heavy Duty Engines" (PDF). The World LPG Association. Retrieved 2 February 2019.
- "Auto LPG body says govt missing out on low-hanging fruits amid EV-push". Retrieved 23 March 2019.
- "Saudi Aramco LPG Prices". Retrieved 31 August 2017.
- "A Primer on Gasoline Blending". 30 June 2009. Retrieved 10 April 2019.
- "BPN Butane – Propane news". Retrieved 10 April 2017.
- "Assessment of environmental impact of FeedKind protein" (PDF). Retrieved 20 June 2017.
- "Tariff & duty of electricity supply in India" (PDF). CEA, Govt. of India. March 2014. Archived from the original (PDF) on 13 August 2014. Retrieved 12 August 2014.
- "Power Minister Piyush Goyal says power available for free". Retrieved 1 May 2015.
- "Daily report of power situation, Ministry of Power, GoI". Archived from the original on 24 June 2013. Retrieved 17 February 2013.
- "See Reports section, National load dispatch centre, Ministry of Power, GoI". Retrieved 17 February 2013.
- Market, Capital (14 July 2015). "India To Export Another 500 MW Power To Bangladesh In Next 12 Months: NLDC". Business Standard India. Retrieved 15 July 2015.
- "Table 13, Monthly operation report, March 2015" (PDF). POSOCO, Govt. of India. March 2015. Archived from the original (PDF) on 24 May 2015. Retrieved 24 April 2015.
- "India discussing natural gas swap with Russia, involving China". 8 December 2016. Retrieved 15 March 2017.
- "IEA Statistics Interactive Search". Retrieved 29 March 2017.
- "Select 'Energy' sections of Pakistan, Burma, Bangladesh, Nepal, Bhutan & Sri Lanka. The world Fact book". Retrieved 17 February 2013.
- "LNG: The whole truth in Pakistan". May 2015. Retrieved 3 May 2015.
- "How Much Do Power Sector Distortions Cost South Asia?" (PDF). World Bank Group. Retrieved 27 December 2018.
- "Saarc Chamber Pushes for Seamless Regional Energy Trade". Retrieved 31 July 2015.
- "On PM Modi's visit, Myanmar to receive first lot of diesel from India". Retrieved 2 September 2017.
- "Turning India's power surplus into a boon". Retrieved 26 October 2016.
- "Why We Should Worry About Low Oil Prices". Retrieved 5 December 2018.
- "Integrated Energy Policy Report 2006" (PDF). Retrieved 31 January 2015.
- "Continuously Rising Energy Costs Will Cripple The Economy". Retrieved 13 September 2018.
- "A Market Collapse Is On The Horizon". Retrieved 9 February 2016.
- "Oil's Heading For $40, For Shale Oil Is A Free Market And Opec's A Cartel". Retrieved 9 January 2015.
- "Everything Has Changed: Oil And The End Of OPEC". Retrieved 31 January 2015.
- "Why The Permian Doesn't Keep OPEC Awake At Night". Retrieved 21 April 2017.
- "An entirely renewable energy future is possible". Retrieved 13 September 2017.
- "China 2050: A Fully Developed Rich Zero-Carbon Economy" (PDF). Retrieved 6 January 2020.
- "IMO 2020: The Big Shipping Shake-Up". Retrieved 30 June 2019.
- "Steel making today and tomorrow". Retrieved 30 June 2019.
- "Lafargeholcim - Geocycle secures biomass needs from local farmers in India". Retrieved 21 June 2018.
- "Co-processing waste in cement plants" (PDF). Retrieved 21 June 2019.
- "Growth of Electricity Sector in India from 1947-2017" (PDF). CEA. Retrieved 17 February 2017.
- "Gensets add up to under half of installed power capacity; August, 2014". Retrieved 13 May 2015.
- "Executive summary of Power sector, April 2017" (PDF). Retrieved 25 May 2017.
- "Growth of Electricity Sector in India from 1947-2018" (PDF). CEA. Retrieved 20 August 2018.
- "Overview of renewable power generation, CEA" (PDF). Retrieved 3 August 2017.
- "Growth of Electricity Sector in India from 1947-2019" (PDF). Central Electricity Authority. May 2018. Retrieved 28 August 2019.
- "Andhra Pradesh to replace 1 Lakh ceiling fans with energy-efficient ones". Retrieved 10 March 2016.
- "India says electrified all villages ahead of prime minister's deadline". Retrieved 29 April 2018.
- "Households electrification in India". Retrieved 21 August 2018.
- "LPG cylinder now used by 89% households". Retrieved 5 December 2018.
External links
- Ready Reference Policy Handbook about India at one place
- Latest news about Indian Power Sector at one place
- Highlights of Rajasthan Solar Policy 2011
- Solar to light up Rural India
- Map of oil and gas infrastructure (incomplete)
- India's River-Linking Scheme: A case of troubled waters
| |||||||||||||||||||||
| |||||||||||||||||||||
| |||||||||||||||||||||
| |||||||||||||||||||||
| |||||||||||||||||||||
Energy policy of Asia | |
|---|---|
| Sovereign states |
|
| States with limited recognition |
|
| Dependencies and other territories |
|
| |