Demographic transition
In demography, demographic transition is a phenomenon and theory which refers to the historical shift from high birth rates and high infant death rates in societies with minimal technology, education (especially of women) and economic development, to low birth rates and low death rates in societies with advanced technology, education and economic development, as well as the stages between these two scenarios. Although this shift has occurred in many industrialized countries, the theory and model are frequently imprecise when applied to individual countries due to specific social, political and economic factors affecting particular populations.
However, the existence of some kind of demographic transition is widely accepted in the social sciences because of the well-established historical correlation linking dropping fertility to social and economic development.[1] Scholars debate whether industrialization and higher incomes lead to lower population, or whether lower populations lead to industrialization and higher incomes. Scholars also debate to what extent various proposed and sometimes inter-related factors such as higher per capita income, lower mortality, old-age security, and rise of demand for human capital are involved.[2]
History of the theory
The theory is based on an interpretation of demographic history developed in 1929 by the American demographer Warren Thompson (1887–1973).[3] Adolphe Landry of France made similar observations on demographic patterns and population growth potential around 1934.[4] In the 1940s and 1950s Frank W. Notestein developed a more formal theory of demographic transition.[5] By 2009, the existence of a negative correlation between fertility and industrial development had become one of the most widely accepted findings in social science.[1]
Summary of the theory
The transition involves four stages, or possibly five.
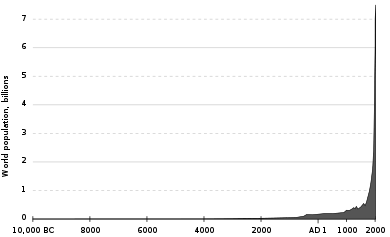
- In stage one, pre-industrial society, death rates and birth rates are high and roughly in balance. All human populations are believed to have had this balance until the late 18th century, when this balance ended in Western Europe.[6] In fact, growth rates were less than 0.05% at least since the Agricultural Revolution over 10,000 years ago.[6] Population growth is typically very slow in this stage, because the society is constrained by the available food supply; therefore, unless the society develops new technologies to increase food production (e.g. discovers new sources of food or achieves higher crop yields), any fluctuations in birth rates are soon matched by death rates.[6]
- In stage two, that of a developing country, the death rates drop quickly due to improvements in food supply and sanitation, which increase life expectancies and reduce disease. The improvements specific to food supply typically include selective breeding and crop rotation and farming techniques.[6] Other improvements generally include baking and access to ovens. For example, numerous improvements in public health reduce mortality, especially childhood mortality.[6] Prior to the mid-20th century, these improvements in public health were primarily in the areas of food handling, water supply, sewage, and personal hygiene.[6] One of the variables often cited is the increase in female literacy combined with public health education programs which emerged in the late 19th and early 20th centuries.[6] In Europe, the death rate decline started in the late 18th century in northwestern Europe and spread to the south and east over approximately the next 100 years.[6] Without a corresponding fall in birth rates this produces an imbalance, and the countries in this stage experience a large increase in population.
- In stage three, birth rates fall due to various fertility factors such as access to contraception, increases in wages, urbanization, a reduction in subsistence agriculture, an increase in the status and education of women, a reduction in the value of children's work, an increase in parental investment in the education of children and other social changes. Population growth begins to level off. The birth rate decline in developed countries started in the late 19th century in northern Europe.[6] While improvements in contraception do play a role in birth rate decline, contraceptives were not generally available nor widely used in the 19th century and as a result likely did not play a significant role in the decline then.[6] It is important to note that birth rate decline is caused also by a transition in values; not just because of the availability of contraceptives.[6]
- During stage four there are both low birth rates and low death rates. Birth rates may drop to well below replacement level as has happened in countries like Germany, Italy, and Japan, leading to a shrinking population, a threat to many industries that rely on population growth. As the large group born during stage two ages, it creates an economic burden on the shrinking working population. Death rates may remain consistently low or increase slightly due to increases in lifestyle diseases due to low exercise levels and high obesity and an aging population in developed countries. By the late 20th century, birth rates and death rates in developed countries leveled off at lower rates.[7]
- Some scholars break out, from stage four, a "stage five" of below-replacement fertility levels. Others hypothesize a different "stage five" involving an increase in fertility.[8]
As with all models, this is an idealized picture of population change in these countries. The model is a generalization that applies to these countries as a group and may not accurately describe all individual cases. The extent to which it applies to less-developed societies today remains to be seen. Many countries such as China, Brazil and Thailand have passed through the Demographic Transition Model (DTM) very quickly due to fast social and economic change. Some countries, particularly African countries, appear to be stalled in the second stage due to stagnant development and the effects of under-invested and under-researched tropical diseases such as malaria and AIDS to a limited extent.
Stage one
In pre-industrial society, death rates and birth rates were both high, and fluctuated rapidly according to natural events, such as drought and disease, to produce a relatively constant and young population. Family planning and contraception were virtually nonexistent; therefore, birth rates were essentially only limited by the ability of women to bear children. Emigration depressed death rates in some special cases (for example, Europe and particularly the Eastern United States during the 19th century), but, overall, death rates tended to match birth rates, often exceeding 40 per 1000 per year. Children contributed to the economy of the household from an early age by carrying water, firewood, and messages, caring for younger siblings, sweeping, washing dishes, preparing food, and working in the fields.[9] Raising a child cost little more than feeding him or her; there were no education or entertainment expenses. Thus, the total cost of raising children barely exceeded their contribution to the household. In addition, as they became adults they become a major input to the family business, mainly farming, and were the primary form of insurance for adults in old age. In India, an adult son was all that prevented a widow from falling into destitution. While death rates remained high there was no question as to the need for children, even if the means to prevent them had existed.[10]
During this stage, the society evolves in accordance with Malthusian paradigm, with population essentially determined by the food supply. Any fluctuations in food supply (either positive, for example, due to technology improvements, or negative, due to droughts and pest invasions) tend to translate directly into population fluctuations. Famines resulting in significant mortality are frequent. Overall, population dynamics during stage one are comparable to those of animals living in the wild. According to Edward, Revocatus. (2016) This is the earlier stage of demographic transition in the world and also characterized by primary activities such as small fishing activities, farming practices, pastoralism and petty businesses.
Stage two
This stage leads to a fall in death rates and an increase in population.[11] The changes leading to this stage in Europe were initiated in the Agricultural Revolution of the eighteenth century and were initially quite slow. In the twentieth century, the falls in death rates in developing countries tended to be substantially faster. Countries in this stage include Yemen, Afghanistan, the Palestinian territories and Iraq and much of Sub-Saharan Africa (but do not include South Africa, Zimbabwe, Botswana, Swaziland, Lesotho, Namibia, Kenya, Gabon and Ghana, which have begun to move into stage 3).[12]
The decline in the death rate is due initially to two factors:
- First, improvements in the food supply brought about by higher yields in agricultural practices and better transportation reduce death due to starvation and lack of water. Agricultural improvements included crop rotation, selective breeding, and seed drill technology.
- Second, significant improvements in public health reduce mortality, particularly in childhood. These are not so many medical breakthroughs (Europe passed through stage two before the advances of the mid-twentieth century, although there was significant medical progress in the nineteenth century, such as the development of vaccination) as they are improvements in water supply, sewerage, food handling, and general personal hygiene following from growing scientific knowledge of the causes of disease and the improved education and social status of mothers.
A consequence of the decline in mortality in Stage Two is an increasingly rapid growth in population growth (a.k.a. "population explosion") as the gap between deaths and births grows wider and wider. Note that this growth is not due to an increase in fertility (or birth rates) but to a decline in deaths. This change in population occurred in north-western Europe during the nineteenth century due to the Industrial Revolution. During the second half of the twentieth century less-developed countries entered Stage Two, creating the worldwide rapid growth of number of living people that has demographers concerned today. In this stage of DT, countries are vulnerable to become failed states in the absence of progressive governments.
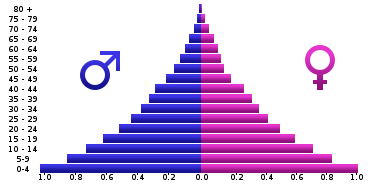
Another characteristic of Stage Two of the demographic transition is a change in the age structure of the population. In Stage One, the majority of deaths are concentrated in the first 5–10 years of life. Therefore, more than anything else, the decline in death rates in Stage Two entails the increasing survival of children and a growing population. Hence, the age structure of the population becomes increasingly youthful and start to have big families and more of these children enter the reproductive cycle of their lives while maintaining the high fertility rates of their parents. The bottom of the "age pyramid" widens first where children, teenagers and infants are here, accelerating population growth rate. The age structure of such a population is illustrated by using an example from the Third World today.
Stage three
In Stage 3 of the Demographic Transition Model (DTM), death rates are low and birth rates diminish, as a rule accordingly of enhanced economic conditions, an expansion in women's status and education, and access to contraception. The decrease in birth rate fluctuates from nation to nation, as does the time span in which it is experienced.[13] Stage Three moves the population towards stability through a decline in the birth rate.[14] Several fertility factors contribute to this eventual decline, and are generally similar to those associated with sub-replacement fertility, although some are speculative:
- In rural areas continued decline in childhood death means that at some point parents realize they need not require so many children to be born to ensure a comfortable old age. As childhood death continues to fall and incomes increase parents can become increasingly confident that fewer children will suffice to help in family business and care for them in old age.
- Increasing urbanization changes the traditional values placed upon fertility and the value of children in rural society. Urban living also raises the cost of dependent children to a family. A recent theory suggests that urbanization also contributes to reducing the birth rate because it disrupts optimal mating patterns. A 2008 study in Iceland found that the most fecund marriages are between distant cousins. Genetic incompatibilities inherent in more distant outbreeding makes reproduction harder.[15]
- In both rural and urban areas, the cost of children to parents is exacerbated by the introduction of compulsory education acts and the increased need to educate children so they can take up a respected position in society. Children are increasingly prohibited under law from working outside the household and make an increasingly limited contribution to the household, as school children are increasingly exempted from the expectation of making a significant contribution to domestic work. Even in equatorial Africa, children (age under 5) now required to have clothes and shoes, and may even require school uniforms. Parents begin to consider it a duty to buy children(s) books and toys, partly due to education and access to family planning, people begin to reassess their need for children and their ability to grow them.[10]

- Increasing literacy and employment lowers the uncritical acceptance of childbearing and motherhood as measures of the status of women. Working women have less time to raise children; this is particularly an issue where fathers traditionally make little or no contribution to child-raising, such as southern Europe or Japan. Valuation of women beyond childbearing and motherhood becomes important.
- Improvements in contraceptive technology are now a major factor. Fertility decline is caused as much by changes in values about children and gender as by the availability of contraceptives and knowledge of how to use them.
The resulting changes in the age structure of the population include a decline in the youth dependency ratio and eventually population aging. The population structure becomes less triangular and more like an elongated balloon. During the period between the decline in youth dependency and rise in old age dependency there is a demographic window of opportunity that can potentially produce economic growth through an increase in the ratio of working age to dependent population; the demographic dividend.
However, unless factors such as those listed above are allowed to work, a society's birth rates may not drop to a low level in due time, which means that the society cannot proceed to stage Three and is locked in what is called a demographic trap.
Countries that have witnessed a fertility decline of over 50% from their pre-transition levels include: Costa Rica, El Salvador, Panama, Jamaica, Mexico, Colombia, Ecuador, Guyana, Philippines, Indonesia, Malaysia, Sri Lanka, Turkey, Azerbaijan, Turkmenistan, Uzbekistan, Tunisia, Algeria, Morocco, Lebanon, South Africa, India, Saudi Arabia, and many Pacific islands.
Countries that have experienced a fertility decline of 25–50% include: Guatemala, Tajikistan, Egypt and Zimbabwe.
Countries that have experienced a fertility decline of less than 25% include: Sudan, Niger, Afghanistan.
Stage four
This occurs where birth and death rates are both low, leading to a total population stability. Death rates are low for a number of reasons, primarily lower rates of diseases and higher production of food. The birth rate is low because people have more opportunities to choose if they want children; this is made possible by improvements in contraception or women gaining more independence and work opportunities.[16] The DTM is only a suggestion about the future population levels of a country, not a prediction.
Countries that are at this stage (2 < Total Fertility Rate < 2.5 in 2015) include: Antigua and Barbuda, Argentina, Bahrain, Bangladesh, Bhutan, Cabo Verde, El Salvador, Faroe Islands, Grenada, Guam, India, Indonesia, Kosovo, Libya, Malaysia, Maldives, Mexico, Myanmar, Nepal, New Caledonia, Nicaragua, Palau, Peru, Seychelles, Sri Lanka, Suriname, Tunisia, Turkey and Venezuela.[17]
Stage five
.svg.png)
Note the vertical axis is logarithmic and represents millions of people.
The original Demographic Transition model has just four stages, but additional stages have been proposed. Both more-fertile and less-fertile futures have been claimed as a Stage Five.
Some countries have sub-replacement fertility (that is, below 2.1–2.2 children per woman). Replacement fertility is generally slightly higher than 2 (the level which replaces the two parents) both because boys are born more often than girls (about 1.05–1.1 to 1) and to compensate for deaths prior to full reproduction. Many European and East Asian countries now have higher death rates than birth rates. Population aging and population decline may eventually occur, assuming that the fertility rate does not change and sustained mass immigration does not occur.
In an article in the August 2009 issue of Nature, Myrskylä, Kohler and Francesco Billari argue that the previously negative relationship between "development", as measured by the Human Development Index (HDI), and birth rates has become J-shaped. The HDI is a composite of life expectancy, income, and level of education. Development promotes fertility decline at HDI levels below 0.9 but further advances in HDI cause a small rebound in birth rate.[18] In many countries with very high levels of development, fertility rates are now approaching two children per woman — although there are exceptions, notably Germany, Italy and Japan.[19]
From the point of view of evolutionary biology, wealthier people having fewer children is unexpected, as natural selection would be expected to favor individuals who are willing and able to convert plentiful resources into plentiful fertile descendants. This may be the result of a departure from the environment of evolutionary adaptedness.[8][20][21]
Most models posit that the birth rate will stabilize at a low level indefinitely. Some dissenting scholars note that the modern environment is exerting evolutionary pressure for higher fertility, and that eventually due to individual natural selection or due to cultural selection, birthrates may rise again. Part of the "cultural selection" hypothesis is that the variance in birthrate between cultures is significant; for example, some religious cultures have a higher birthrate that isn't accounted for by differences in income.[22][23][24]
Jane Falkingham of Southampton University has noted that "We've actually got population projections wrong consistently over the last 50 years... we've underestimated the improvements in mortality... but also we've not been very good at spotting the trends in fertility."[8] In 2004 a United Nations office published its guesses for global population in the year 2300; estimates ranged from a "low estimate" of 2.3 billion (tending to −0.32% per year) to a "high estimate" of 36.4 billion (tending to +0.54% per year), which were contrasted with a deliberately "unrealistic" illustrative "constant fertility" scenario of 134 trillion (obtained if 1995–2000 fertility rates stay constant into the far future).[8][25]
Effects on age structure

The decline in death rate and birth rate that occurs during the demographic transition may transform the age structure. When the death rate declines during the second stage of the transition, the result is primarily an increase in the child population. The reason being that when the death rate is high (stage one), the infant mortality rate is very high, often above 200 deaths per 1000 children born. When the death rate falls or improves, this may include lower infant mortality rate and increased child survival. Over time, as individuals with increased survival rates age, there may also be an increase in the number of older children, teenagers, and young adults. This implies that there is an increase in the fertile population proportion which, with constant fertility rates, may lead to an increase in the number of children born. This will further increase the growth of the child population. The second stage of the demographic transition, therefore, implies a rise in child dependency and creates a youth bulge in the population structure.[26] As a population continues to move through the demographic transition into the third stage, fertility declines and the youth bulge prior to the decline ages out of child dependency into the working ages. This stage of the transition is often referred to as the golden age, and is typically when populations see the greatest advancements in living standards and economic development.[26] However, further declines in both mortality and fertility will eventually result in an aging population, and a rise in the aged dependency ratio. An increase of the aged dependency ratio often indicates that a population has reached below replacement levels of fertility, and as result does not have enough people in the working ages to support the economy, and the growing dependent population.[26]
Historical studies
Pink line: crude death rate (CDR), green line: (crude) birth rate (CBR), yellow line: population.

Britain
Between 1750 and 1975 England experienced the transition from high levels of both mortality and fertility, to low levels. A major factor was the sharp decline in the death rate due to infectious diseases, which has fallen from about 11 per 1,000 to less than 1 per 1,000. By contrast, the death rate from other causes was 12 per 1,000 in 1850 and has not declined markedly. The agricultural revolution and the development of transport, initiated by the construction of canals, led to greater availability of food and coal, and enabled the Industrial Revolution to improve the standard of living. Scientific discoveries and medical breakthroughs did not, in general, contribute importantly to the early major decline in infectious disease mortality.
Ireland
In the 1980s and early 1990s, the Irish demographic status converged to the European norm. Mortality rose above the European Community average, and in 1991 Irish fertility fell to replacement level. The peculiarities of Ireland's past demography and its recent rapid changes challenge established theory. The recent changes have mirrored inward changes in Irish society, with respect to family planning, women in the work force, the sharply declining power of the Catholic Church, and the emigration factor.[27]
France
France displays real divergences from the standard model of Western demographic evolution. The uniqueness of the French case arises from its specific demographic history, its historic cultural values, and its internal regional dynamics. France's demographic transition was unusual in that the mortality and the natality decreased at the same time, thus there was no demographic boom in the 19th century.[28]
France's demographic profile is similar to its European neighbors and to developed countries in general, yet it seems to be staving off the population decline of Western countries. With 62.9 million inhabitants in 2006, it was the second most populous country in the European Union, and it displayed a certain demographic dynamism, with a growth rate of 2.4% between 2000 and 2005, above the European average. More than two-thirds of that growth can be ascribed to a natural increase resulting from high fertility and birthrates. In contrast, France is one of the developed nations whose migratory balance is rather weak, which is an original feature at the European level. Several interrelated reasons account for such singularities, in particular the impact of pro-family policies accompanied by greater unmarried households and out-of-wedlock births. These general demographic trends parallel equally important changes in regional demographics. Since 1982 the same significant tendencies have occurred throughout mainland France: demographic stagnation in the least-populated rural regions and industrial regions in the northeast, with strong growth in the southwest and along the Atlantic coast, plus dynamism in metropolitan areas. Shifts in population between regions account for most of the differences in growth. The varying demographic evolution regions can be analyzed though the filter of several parameters, including residential facilities, economic growth, and urban dynamism, which yield several distinct regional profiles. The distribution of the French population therefore seems increasingly defined not only by interregional mobility but also by the residential preferences of individual households. These challenges, linked to configurations of population and the dynamics of distribution, inevitably raise the issue of town and country planning. The most recent census figures show that an outpouring of the urban population means that fewer rural areas are continuing to register a negative migratory flow – two-thirds of rural communities have shown some since 2000. The spatial demographic expansion of large cities amplifies the process of peri-urbanization yet is also accompanied by movement of selective residential flow, social selection, and sociospatial segregation based on income.[29]
Asia
McNicoll (2006) examines the common features behind the striking changes in health and fertility in East and Southeast Asia in the 1960s–1990s, focusing on seven countries: Taiwan and South Korea ("tiger" economies), Thailand, Malaysia, and Indonesia ("second wave" countries), and China and Vietnam ("market-Leninist" economies). Demographic change can be seen as a byproduct of social and economic development together with, in some cases, strong governmental pressures. The transition sequence entailed the establishment of an effective, typically authoritarian, system of local administration, providing a framework for promotion and service delivery in health, education, and family planning. Subsequent economic liberalization offered new opportunities for upward mobility — and risks of backsliding —, accompanied by the erosion of social capital and the breakdown or privatization of service programs.
India
As of 2013, India is in the later half of the third stage of the demographic transition, with a population of 1.23 billion.[30] It is nearly 40 years behind in the demographic transition process compared to EU countries, Japan, etc. The present demographic transition stage of India along with its higher population base will yield a rich demographic dividend in future decades.[31]
Korea
Cha (2007) analyzes a panel data set to explore how industrial revolution, demographic transition, and human capital accumulation interacted in Korea from 1916–38. Income growth and public investment in health caused mortality to fall, which suppressed fertility and promoted education. Industrialization, skill premium, and closing gender wage gap further induced parents to opt for child quality. Expanding demand for education was accommodated by an active public school building program. The interwar agricultural depression aggravated traditional income inequality, raising fertility and impeding the spread of mass schooling. Landlordism collapsed in the wake of de-colonization, and the consequent reduction in inequality accelerated human and physical capital accumulation, hence leading to growth in South Korea.[32]
Madagascar
Campbell has studied the demography of 19th-century Madagascar in the light of demographic transition theory. Both supporters and critics of the theory hold to an intrinsic opposition between human and "natural" factors, such as climate, famine, and disease, influencing demography. They also suppose a sharp chronological divide between the precolonial and colonial eras, arguing that whereas "natural" demographic influences were of greater importance in the former period, human factors predominated thereafter. Campbell argues that in 19th-century Madagascar the human factor, in the form of the Merina state, was the predominant demographic influence. However, the impact of the state was felt through natural forces, and it varied over time. In the late 18th and early 19th centuries Merina state policies stimulated agricultural production, which helped to create a larger and healthier population and laid the foundation for Merina military and economic expansion within Madagascar. From 1820, the cost of such expansionism led the state to increase its exploitation of forced labor at the expense of agricultural production and thus transformed it into a negative demographic force. Infertility and infant mortality, which were probably more significant influences on overall population levels than the adult mortality rate, increased from 1820 due to disease, malnutrition, and stress, all of which stemmed from state forced labor policies. Available estimates indicate little if any population growth for Madagascar between 1820 and 1895. The demographic "crisis" in Africa, ascribed by critics of the demographic transition theory to the colonial era, stemmed in Madagascar from the policies of the imperial Merina regime, which in this sense formed a link to the French regime of the colonial era. Campbell thus questions the underlying assumptions governing the debate about historical demography in Africa and suggests that the demographic impact of political forces be reevaluated in terms of their changing interaction with "natural" demographic influences.[33]
Russia
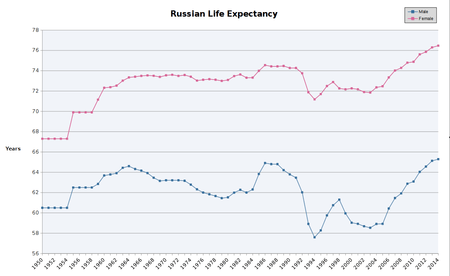
Russia entered stage two of the transition in the 18th century, simultaneously with the rest of Europe, though the effect of transition remained limited to a modest decline in death rates and steady population growth. The population of Russia nearly quadrupled during the 19th century, from 30 million to 133 million, and continued to grow until the First World War and the turmoil that followed.[36] Russia then quickly transitioned through stage three. Though fertility rates rebounded initially and almost reached 7 children/woman in the mid-1920s, they were depressed by the 1931–33 famine, crashed due to the Second World War in 1941, and only rebounded to a sustained level of 3 children/woman after the war. By 1970 Russia was firmly in stage four, with crude birth rates and crude death rates on the order of 15/1000 and 9/1000 respectively. Bizarrely however, the birth rate entered a state of constant flux, repeatedly surpassing the 20/1000 as well as falling below 12/1000.
In the 1980s and 1990s, Russia underwent a unique demographic transition; observers call it a "demographic catastrophe": the number of deaths exceeded the number of births, life expectancy fell sharply (especially for males) and the number of suicides increased.[37] From 1992 through 2011, the number of deaths exceeded the number of births; from 2011 onwards, the opposite has been the case.
United States
Greenwood and Seshadri (2002) show that from 1800 to 1940 there was a demographic shift from a mostly rural US population with high fertility, with an average of seven children born per white woman, to a minority (43%) rural population with low fertility, with an average of two births per white woman. This shift resulted from technological progress. A sixfold increase in real wages made children more expensive in terms of forgone opportunities to work and increases in agricultural productivity reduced rural demand for labor, a substantial portion of which traditionally had been performed by children in farm families.[38]
A simplification of the DTM theory proposes an initial decline in mortality followed by a later drop in fertility. The changing demographics of the U.S. in the last two centuries did not parallel this model. Beginning around 1800, there was a sharp fertility decline; at this time, an average woman usually produced seven births per lifetime, but by 1900 this number had dropped to nearly four. A mortality decline was not observed in the U.S. until almost 1900—a hundred years following the drop in fertility.
However, this late decline occurred from a very low initial level. During the 17th and 18th centuries, crude death rates in much of colonial North America ranged from 15 to 25 deaths per 1000 residents per year[39][40] (levels of up to 40 per 1000 being typical during stages one and two). Life expectancy at birth was on the order of 40 and, in some places, reached 50, and a resident of 18th century Philadelphia who reached age 20 could have expected, on average, additional 40 years of life.
This phenomenon is explained by the pattern of colonization of the United States. Sparsely populated interior of the country allowed ample room to accommodate all the "excess" people, counteracting mechanisms (spread of communicable diseases due to overcrowding, low real wages and insufficient calories per capita due to the limited amount of available agricultural land) which led to high mortality in the Old World. With low mortality but stage 1 birth rates, the United States necessarily experienced exponential population growth (from less than 4 million people in 1790, to 23 million in 1850, to 76 million in 1900.)
The only area where this pattern did not hold was the American South. High prevalence of deadly endemic diseases such as malaria kept mortality as high as 45–50 per 1000 residents per year in 18th century North Carolina. In New Orleans, mortality remained so high (mainly due to yellow fever) that the city was characterized as the "death capital of the United States" – at the level of 50 per 1000 population or higher – well into the second half of the 19th century.[41]
Today, the U.S. is recognized as having both low fertility and mortality rates. Specifically, birth rates stand at 14 per 1000 per year and death rates at 8 per 1000 per year.[42]
Critical evaluation
It must be remembered that the DTM is only a model and cannot necessarily predict the future. It does however give an indication of what the future birth and death rates may be for an underdeveloped country, together with the total population size. Most particularly, of course, the DTM makes no comment on change in population due to migration. It is not applicable for high levels of development, as it has been shown that after a HDI of 0.9 the fertility increases again.[1]
DTM does not account for recent phenomena such as AIDS; in these areas HIV has become the leading source of mortality. Some trends in waterborne bacterial infant mortality are also disturbing in countries like Malawi, Sudan and Nigeria; for example, progress in the DTM clearly arrested and reversed between 1975 and 2005.[43]
DTM assumes that population changes are induced by industrial changes and increased wealth, without taking into account the role of social change in determining birth rates, e.g., the education of women. In recent decades more work has been done on developing the social mechanisms behind it.[44]
DTM assumes that the birth rate is independent of the death rate. Nevertheless, demographers maintain that there is no historical evidence for society-wide fertility rates rising significantly after high mortality events. Notably, some historic populations have taken many years to replace lives after events such as the Black Death.
Some have claimed that DTM does not explain the early fertility declines in much of Asia in the second half of the 20th century or the delays in fertility decline in parts of the Middle East. Nevertheless, the demographer John C Caldwell has suggested that the reason for the rapid decline in fertility in some developing countries compared to Western Europe, the United States, Canada, Australia and New Zealand is mainly due to government programs and a massive investment in education both by governments and parents.[12]
Second demographic transition
The Second Demographic Transition (SDT) is a conceptual framework first formulated in 1986 by Ron Lesthaeghe and Dirk van de Kaa in a short article that was published in the Dutch sociology journal Mens en Maatschappij.[45]:181[45][46][47] SDT addressed the changes in the patterns of sexual and reproductive behavior which occurred in North America and Western Europe in the period from about 1963, when the birth control pill and other cheap effective contraceptive methods such as the IUD were adopted by the general population, to the present. Combined with the sexual revolution and the increased role of women in society and the workforce the resulting changes have profoundly affected the demographics of industrialized countries resulting in a sub-replacement fertility level.[48]
The changes, increased numbers of women choosing to not marry or have children, increased cohabitation outside marriage, increased childbearing by single mothers, increased participation by women in higher education and professional careers, and other changes are associated with increased individualism and autonomy, particularly of women. Motivations have changed from traditional and economic ones to those of self-realization.[49]
In 2015, Nicholas Eberstadt, political economist at the American Enterprise Institute in Washington, described the Second Demographic Transition as one in which "long, stable marriages are out, and divorce or separation are in, along with serial cohabitation and increasingly contingent liaisons."[50]
See also
- Birth dearth
- Demographic dividend
- Demographic economics
- Demographic trap
- Demographic window
- Epidemiological transition
- Human overpopulation
- Malthusian catastrophe
- Mathematical model of self-limiting growth
- Migration transition model
- Population pyramid
- Rate of natural increase
- Self-limiting growth in biological population at carrying capacity
- Waithood
- World population milestones
- r/K life history theory
Footnotes
- Myrskylä, Mikko; Kohler, Hans-Peter; Billari, Francesco C. (2009). "Advances in development reverse fertility declines". Nature. 460 (7256): 741–3. Bibcode:2009Natur.460..741M. doi:10.1038/nature08230. PMID 19661915.
- Galor, Oded (17 February 2011). "The demographic transition: causes and consequences". Cliometrica. 6 (1): 1–28. doi:10.1007/s11698-011-0062-7. PMC 4116081. PMID 25089157.
- "Warren Thompson". Encyclopedia of Population. 2. Macmillan Reference. 2003. pp. 939–40. ISBN 978-0-02-865677-9.
- Landry, Adolphe (December 1987). "Adolphe Landry on the Demographic transition Revolution". Population and Development Review. 13 (4): 731–740. doi:10.2307/1973031. JSTOR 1973031.
- Woods, Robert (2000-10-05). The Demography of Victorian England and Wales. Cambridge University Press. p. 18. ISBN 978-0-521-78254-8.
- "Demographic transition", Geography, UWC.
- "Demographic transition", Geography, About.
- Can we be sure the world's population will stop rising?, BBC News, 13 October 2012
- "Demographic Transition Model". geographyfieldwork.com.
- Caldwell (2006), Chapter 5
- BBC bitesize Archived October 23, 2007, at the Wayback Machine
- Caldwell (2006), Chapter 10
- "Stage 3 of the Demographic Transition Model - Population Education". 16 October 2014.
- "Demographic transition", Geography, Marathon, UWC.
- "Kissing cousins, missing children", The Economist, 7 February 2008.
- "Demographic", Main vision.
- "Fertility rate, total (births per woman) - Data". data.worldbank.org.
- Myrskyla, M; Kohler, H-P; Billari, F (6 August 2009), "Advances in development reverse fertility declines", Nature, 460 (7256): 741–43, Bibcode:2009Natur.460..741M, doi:10.1038/nature08230, PMID 19661915.
- "The best of all possible worlds?", The Economist, 6 August 2009.
- Clarke, Alice L.; Low, Bobbi S. (2001). "Testing evolutionary hypotheses with demographic data" (PDF). Population and Development Review. 27 (4): 633–660. doi:10.1111/j.1728-4457.2001.00633.x. hdl:2027.42/74296.
- Daly, Martin; Wilson, Margo I (26 June 1998). "Human evolutionary psychology and animal behaviour" (PDF). Department of Psychology, McMaster University. Retrieved 14 November 2018.
- Kolk, M.; Cownden, D.; Enquist, M. (29 January 2014). "Correlations in fertility across generations: can low fertility persist?". Proceedings of the Royal Society B: Biological Sciences. 281 (1779): 20132561. doi:10.1098/rspb.2013.2561. PMC 3924067. PMID 24478294.
- Burger, Oskar; DeLong, John P. (28 March 2016). "What if fertility decline is not permanent? The need for an evolutionarily informed approach to understanding low fertility". Philosophical Transactions of the Royal Society B: Biological Sciences. 371 (1692): 20150157. doi:10.1098/rstb.2015.0157. PMC 4822437. PMID 27022084.
- "Population paradox: Europe's time bomb". The Independent. 9 August 2008. Retrieved 31 March 2019.
- "World Population to 2300" (PDF). United Nations Department of Economic and Social Affairs. 2004. Retrieved 24 May 2016.
- Weeks, John R. (2014). Population: An Introduction to Concepts and Issues. Cengage Learning. pp. 94–97. ISBN 978-1-305-09450-5.
- Coleman, DA (1992), "The Demographic Transition in Ireland in International Context", Proceedings of the British Academy (79): 53–77.
- Vallin, Jacques; Caselli, Graziella (May 1999). "Quand l'Angleterre rattrapait la France". Population & Societes (in French) (346).
- Baudelle, Guy; Olivier, David (2006), "Changement Global, Mondialisation et Modèle De Transition Démographique: réflexion sur une exception française parmi les pays développés", Historiens et Géographes (in French), 98 (395): 177–204, ISSN 0046-757X
- "The arithmetic's of Indian population". Retrieved 13 September 2013.
- "India vs China vs USA vs World". Retrieved 13 September 2013.
- Myung, Soo Cha (July 2007), Industrial Revolution, Demographic Transition, and Human Capital Accumulation in Korea, 1916–38 (PDF) (working Paper), KR: Naksungdae Institute of Economic Research.
- Campbell, Gwyn (1991), "State and Pre-colonial Demographic History: the Case of Nineteenth-century Madagascar", Journal of African History, 32 (3): 415–45, doi:10.1017/s0021853700031534, ISSN 0021-8537.
- "Life expectancy of the Russian Federation since 1950". Demoscope.ru. 26 April 2011. Archived from the original on 14 May 2011. Retrieved 14 May 2011.
- Life Expectancy of the Russian Federation since 1992 Retrieved on 29 May 2008
- "Population of Eastern Europe". tacitus.nu.
- Demko, George J, ed. (1999), Population under Duress: The Geodemography of Post-Soviet Russia, et al, Questia
- Greenwood, Jeremy; Seshadri, Ananth (January 2002). "The U.S. Demographic Transition". SSRN 297952. Cite journal requires
|journal=(help) - Herbert S. Klein. A Population History of the United States. p. 39.
- Michael R. Haines; Richard H. Steckel. A Population History of North America. pp. 163–164.
- Haines, Michael R. (July 2001). "The Urban Mortality Transition in the United States, 1800–1940". NBER Historical Working Paper No. 134. doi:10.3386/h0134.
- "US", World factbook, USA: CIA.
- "Nigeria: Reversal of Demographic Transition", Population action, November 2006, archived from the original on 2007-04-11, retrieved 2007-02-09.
- Caldwell, John C.; Bruce K Caldwell; Pat Caldwell; Peter F McDonald; Thomas Schindlmayr (2006). Demographic Transition Theory. Dordrecht, The Netherlands: Springer. p. 239. ISBN 978-1-4020-4373-4.
- Ron J. Lesthaeghe (2011), "The "second demographic transition": a conceptual map for the understanding of late modern demographic developments in fertility and family formation", Historical Social Research, 36 (2): 179–218
- Ron Lesthaeghe; Dirk van de Kaa (1986). "Twee demografische transities? [Second Demographic Transition]". Bevolking: groei en krimp [Population: growth and shrinkage]. Deventer : Van Loghum Slaterus. pp. 9–24. ISBN 9789036800181.(in Dutch with summaries in English)
- Ron J. Lesthaeghe (1991), The Second Demographic Transition in Western countries: An interpretation (PDF), IPD Working Paper, Interuniversity Programme in Demography, retrieved February 26, 2017
- Dirk J. van de Kaa (29 January 2002). "The Idea of a Second Demographic Transition in Industrialized Countries" (PDF). Retrieved May 6, 2016. Cite journal requires
|journal=(help) - Ron Lesthaeghe (December 23, 2014). "The second demographic transition: A concise overview of its development". Proceedings of the National Academy of Sciences of the United States of America. 111 (51): 18112–18115. Bibcode:2014PNAS..11118112L. doi:10.1073/pnas.1420441111. PMC 4280616. PMID 25453112.
- Nicholas Eberstadt (February 21, 2015), The Global Flight From the Family: It's not only in the West or prosperous nations—the decline in marriage and drop in birth rates is rampant, with potentially dire fallout, Wall Street Journal, retrieved February 26, 2017,
‘They’re getting divorced, and they’ll do anything NOT to get custody of the kids.” So reads the promotional poster, in French, for a new movie, “Papa ou Maman"
References
- Carrying capacity
- Caldwell, John C. (1976). "Toward a restatement of demographic transition theory". Population and Development Review. 2 (3/4): 321–66. doi:10.2307/1971615. JSTOR 1971615.
- ————————; Bruce K Caldwell; Pat Caldwell; Peter F McDonald; Thomas Schindlmayr (2006). Demographic Transition Theory. Dordrecht, the Netherlands: Springer. p. 418. ISBN 978-1-4020-4373-4.
- Chesnais, Jean-Claude. The Demographic Transition: Stages, Patterns, and Economic Implications: A Longitudinal Study of Sixty-Seven Countries Covering the Period 1720–1984. Oxford U. Press, 1993. 633 pp.
- Coale, Ansley J. 1973. "The demographic transition," IUSSP Liege International Population Conference. Liege: IUSSP. Volume 1: 53–72.
- ————————; Anderson, Barbara A; Härm, Erna (1979). Human Fertility in Russia since the Nineteenth Century. Princeton, NJ: Princeton University Press..
- Coale, Ansley J; Watkins, Susan C, eds. (1987). The Decline of Fertility in Europe. Princeton, NJ: Princeton University Press..
- Davis, Kingsley (1945). "The World Demographic Transition". Annals of the American Academy of Political and Social Science. 237 (237): 1–11. doi:10.1177/000271624523700102. JSTOR 1025490.. Classic article that introduced concept of transition.
- Davis, Kingsley. 1963. "The theory of change and response in modern demographic history." Population Index 29(October): 345–66.
- Kunisch, Sven; Boehm, Stephan A.; Boppel, Michael (eds): From Grey to Silver: Managing the Demographic Change Successfully, Springer-Verlag, Berlin Heidelberg 2011, ISBN 978-3-642-15593-2
- Friedlander, Dov; S Okun, Barbara; Segal, Sharon (1999). "The Demographic Transition Then and Now: Processes, Perspectives, and Analyses". Journal of Family History. 24 (4): 493–533. doi:10.1177/036319909902400406. ISSN 0363-1990. PMID 11623954., full text in Ebsco.
- Galor, Oded (2005). "The Demographic Transition and the Emergence of Sustained Economic Growth" (PDF). Journal of the European Economic Association. 3 (2–3): 494–504. doi:10.1162/jeea.2005.3.2-3.494. hdl:10419/80187.
- ———————— (2008). "The Demographic Transition". New Palgrave Dictionary of Economics (2nd ed.). Macmillan..
- Gillis, John R., Louise A. Tilly, and David Levine, eds. The European Experience of Declining Fertility, 1850–1970: The Quiet Revolution. 1992.
- Greenwood, Jeremy; Seshadri, Ananth (2002). "The US Demographic Transition". American Economic Review. 92 (2): 153–59. CiteSeerX 10.1.1.13.6505. doi:10.1257/000282802320189168. JSTOR 3083393.
- Harbison, Sarah F.; Robinson, Warren C. (2002). "Policy Implications of the Next World Demographic Transition". Studies in Family Planning. 33 (1): 37–48. doi:10.1111/j.1728-4465.2002.00037.x. JSTOR 2696331. PMID 11974418.
- Hirschman, Charles (1994). "Why fertility changes". Annual Review of Sociology. 20: 203–233. doi:10.1146/annurev.so.20.080194.001223. PMID 12318868.
- Jones, GW, ed. (1997). The Continuing Demographic Transition. et al. Questia..
- Korotayev, Andrey; Malkov, Artemy; Khaltourina, Daria (2006). Introduction to Social Macrodynamics: Compact Macromodels of the World System Growth. Moscow, Russia: URSS. p. 128. ISBN 978-5-484-00414-0.
- Kirk, Dudley (1996). "The Demographic Transition". Population Studies. 50 (3): 361–87. doi:10.1080/0032472031000149536. JSTOR 2174639. PMID 11618374.
- Borgerhoff, Luttbeg B; Borgerhoff Mulder, M; Mangel, MS (2000). "To marry or not to marry? A dynamic model of marriage behavior and demographic transition". In Cronk, L; Chagnon, NA; Irons, W (eds.). Human behavior and adaptation: An anthropological perspective. New York: Aldine Transaction. p. 528. ISBN 978-0-202-02044-0.
- Landry, Adolphe, 1982 [1934], La révolution démographique – Études et essais sur les problèmes de la population, Paris, INED-Presses Universitaires de France
- McNicoll, Geoffrey. "Policy Lessons of the East Asian Demographic Transition," Population and Development Review, Vol. 32, No. 1 (Mar., 2006), pp. 1–25
- Mercer, Alexander (2014), Infections, Chronic Disease, and the Epidemiological Transition. Rochester, NY: University of Rochester Press/Rochester Studies in Medical History, ISBN 978-1-58046-508-3
- Montgomery, Keith. "The Demographic Transition". Geography..
- Notestein, Frank W. 1945. "Population — The Long View," in Theodore W. Schultz, Ed., Food for the World. Chicago: University of Chicago Press.
- Saito, Oasamu (1996). "Historical Demography: Achievements and Prospects". Population Studies. 50 (3): 537–53. doi:10.1080/0032472031000149606. ISSN 0032-4728. JSTOR 2174646. PMID 11618380..
- Soares, Rodrigo R., and Bruno L. S. Falcão. "The Demographic Transition and the Sexual Division of Labor," Journal of Political Economy, Vol. 116, No. 6 (Dec., 2008), pp. 1058–104
- Szreter, Simon (1993). "The Idea of Demographic Transition and the Study of Fertility: A Critical Intellectual History". Population and Development Review. 19 (4): 659–701. doi:10.2307/2938410. JSTOR 2938410..
- ————————; Nye, Robert A; van Poppel, Frans (2003). "Fertility and Contraception During the Demographic Transition: Qualitative and Quantitative Approaches". Journal of Interdisciplinary History. 34 (2): 141–54. doi:10.1162/002219503322649453. ISSN 0022-1953., full text in Project Muse and Ebsco
- Thompson, Warren S (1929). "Population". American Journal of Sociology. 34 (6): 959–75. doi:10.1086/214874.
After the next World War, we will see Germany lose more women and children and soon start again from a developing stage
. - World Bank, Fertility Rate