World Series television ratings
Audience measurement by Nielsen Media Research, commonly referred to as Nielsen ratings, has provided World Series television ratings since at least 1963.[1][lower-alpha 1] Key measurements are ratings, the percentage of all U.S. television-equipped households that watched a game, share, the percentage of television sets in use that were tuned to a game, and total viewers (or viewership), the average number of people watching a game throughout its duration.[4]
.jpg)
The highest ratings for an entire World Series is tied between 1978, featuring the New York Yankees and Los Angeles Dodgers, and 1980, featuring the Philadelphia Phillies and Kansas City Royals. Both series went six games and averaged a rating of 32.8 and a share of 56.[5] Average viewership was slightly larger in 1978 (44,278,950) than in 1980 (42,300,000).[5]
The lowest ratings for an entire World Series was in 2012, a four-game sweep of the Detroit Tigers by the San Francisco Giants, which averaged a 7.6 rating and a 12 share,[5] with an average viewership of 12.636 million.[6]
The highest-rated individual game in World Series history was Game 6 in 1980, when the Philadelphia Phillies defeated the Kansas City Royals; the game had a 40.0 rating.[5][7] The only other games with a rating of 39 or higher were Game 7 in 1975, when the Cincinnati Reds defeated the Boston Red Sox, with a 39.6 rating,[5] and Game 4 in 1963, when the Los Angeles Dodgers swept the New York Yankees, with a 39.5 rating.[7][1] The most-viewed game was Game 7 in 1986, when the New York Mets defeated the Boston Red Sox;[8] with a rating of 38.9,[5] its viewership is estimated at 55 to 60 million.[9][lower-alpha 2]
The lowest-rated individual game was Game 4 in 2019, which had a 5.9 rating, falling below the 6.1 rating of Game 3 in 2008 and Game 3 in 2012.[10] Game 3 in 2008 had the smallest viewership in World Series history,[10] 9.836 million, as a rain delay moved the start of the game to after 10 p.m. on the East Coast with the game not ending until 1:47 a.m.[11]
The most recent World Series game to record a rating of 30 or higher was Game 7 in 1991, as the Minnesota Twins defeated the Atlanta Braves; the game had a viewership of 50.340 million.[5] Game 7 in 2016 between the Chicago Cubs and Cleveland Indians had an average viewership of 40.045 million -- the most-watched World Series game in 25 years dating back to 1991[12] -- and peaked at 49.9 million viewers, and Fox estimated more than 75 million people watched all or part of the game.[13]
All four major U.S. broadcast television networks (ABC, CBS, NBC, and Fox) have broadcast the World Series. Fox has been the exclusive broadcast network for the World Series since 2000, and has a contract with MLB to carry the World Series through 2028.[14]
Viewership by year
The below graph shows the average number of viewers (in millions) for each World Series since 1973; older Nielsen records lack average viewer counts.[5][15]

Least and most viewed World Series
These tables list the World Series with the smallest and largest average viewership (figures in millions) since 1973.[5][15]
|
|
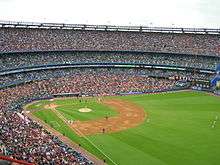
 Yankee Stadium, site for three games of the 1978 World Series.
|
Viewership records for Games 1–7
The following table shows the viewership (figures in millions) records—both largest and smallest—for games one through seven in a World Series since 1973.[5][15]
| Game 1 | Game 2 | Game 3 | Game 4 | Game 5 | Game 6 | Game 7 | |
|---|---|---|---|---|---|---|---|
| Highest | 43.510 M (1978) | 42.990 M (1980) | 43.810 M (1978) | 39.220 M (1978) | 48.990 M (1982) | 54.860 M (1980) | 55–60 M (1986) |
| Lowest | 12.191 M (2014) | 11.925 M (2019) | 9.836 M (2008) | 10.219 M (2019) | 11.390 M (2019) | 13.372 M (2014) | 23.013 M (2019) |
Television ratings by year
Figures are expressed as ratings/share. Ratings represent the percentage of U.S. households that watched the game on television. Share represents the percentage of television sets in use that were tuned to the game.
| Most viewers for each Game (1 through 7) or Average | |
| Fewest viewers for each Game (1 through 7) or Average |
| Year | Net. | Results | Average | Game 1 | Game 2 | Game 3 | Game 4 | Game 5 | Game 6 | Game 7 |
|---|---|---|---|---|---|---|---|---|---|---|
| 2019 | Fox | Washington Nationals 4, Houston Astros 3 |
8.1/16 (13.912 M viewers)[16] |
7.3/15 (12.194 M viewers)[17] |
7.1/15 (11.925 M viewers)[18] |
7.1/15 (12.220 M viewers)[19] |
5.9/13 (10.219 M viewers)[20] |
6.5/12 (11.390 M viewers)[21] |
9.6/19 (16.425 M viewers)[22] |
13.1/25 (23.013 M viewers)[23] |
| 2018 | Fox | Boston Red Sox 4, Los Angeles Dodgers 1 |
8.3/17 (14.125 M viewers)[24] |
8.2/16 (13.761 M viewers)[25] |
8.1/15 (13.458 M viewers)[26] |
7.9/18 (13.251 M viewers)[27] |
7.9/16 (13.563 M viewers)[28] |
10.0/18 (17.634 M viewers)[29] |
No Game | |
| 2017 | Fox | Houston Astros 4, Los Angeles Dodgers 3 |
10.7/20 (18.926 M viewers)[24] |
8.7[30]/15 (14.968 M viewers)[31] |
9.2[32]/18 (15.483 M viewers)[33] |
8.8[34]/17 (15.676 M viewers)[35] |
8.7[36]/17 (15.400 M viewers)[37] |
10.5[38]/21 (18.940 M viewers)[39] |
12.6[40]/23 (22.229 M viewers)[41] |
15.8[42]/28 (28.240 M viewers)[43] |
| 2016 | Fox | Chicago Cubs 4, Cleveland Indians 3 |
12.9/22 (22.847 M viewers)[6] |
11.3[44]/20 (19.368 M viewers)[45] |
10.2[46]/18 (17.395 M viewers)[47] |
11.0[48]/20 (19.384 M viewers)[49] |
9.3[50]/18 (16.705 M viewers)[51] |
13.1[52]/21 (23.638 M viewers)[53] |
13.3[54]/23 (23.396 M viewers)[55] |
21.8[56]/37 (40.045 M viewers)[57] |
| 2015 | Fox | Kansas City Royals 4, New York Mets 1 |
8.6/16 (14.533 M viewers)[6] |
9.0/17 (14.944 M viewers) |
8.3/14 (13.722 M viewers) |
7.9/15 (13.205 M viewers) |
7.8/15 (13.587 M viewers) |
10.0/17 (17.206 M viewers) |
No Game | |
| 2014 | Fox | San Francisco Giants 4, Kansas City Royals 3 |
8.2/14 (13.930 M viewers)[6] |
7.3/12 (12.191 M viewers) |
7.9/14 (12.917 M viewers) |
7.2/13 (12.133 M viewers) |
6.3/12 (10.742 M viewers) |
7.3/12 (12.635 M viewers) |
8.1/13 (13.372 M viewers) |
13.7/23 (23.517 M viewers) |
| 2013 | Fox | Boston Red Sox 4, St. Louis Cardinals 2 |
8.9/15 (14.984 M viewers)[6] |
8.6/14 (14.400 M viewers) |
8.3/13 (13.429 M viewers) |
7.4/14 (12.473 M viewers) |
9.4/15 (15.975 M viewers) |
8.9/14 (14.446 M viewers) |
11.3/18 (19.178 M viewers) |
No Game |
| 2012 | Fox | San Francisco Giants 4, Detroit Tigers 0 |
7.6/12 (12.636 M viewers)[6] |
7.6/12 (12.240 M viewers) |
7.8/12 (12.340 M viewers) |
6.1/11 (10.471 M viewers) |
8.9/14 (15.485 M viewers) |
No Game | ||
| 2011 | Fox | St. Louis Cardinals 4, Texas Rangers 3 |
10.0/16 (16.521 M viewers)[6] |
8.7/14 (14.174 M viewers) |
8.9/14 (14.280 M viewers) |
6.6/12 (11.247 M viewers) |
9.2/14 (15.156 M viewers) |
8.8/14 (14.324 M viewers) |
12.7/21 (21.065 M viewers) |
14.7/25 (25.403 M viewers) |
| 2010 | Fox | San Francisco Giants 4, Texas Rangers 1 |
8.4/14 (14.217 M viewers)[6] |
8.9/15 (15.009 M viewers) |
8.5/14 (14.130 M viewers) |
6.7/13 (11.460 M viewers) |
9.0/15 (15.537 M viewers) |
8.8/14 (14.950 M viewers) |
No Game | |
| 2009 | Fox | New York Yankees 4, Philadelphia Phillies 2 |
11.7/19 (19.334 M viewers)[6] |
11.9/19 (19.511 M viewers) |
11.7/19 (18.897 M viewers) |
9.1/18 (15.397 M viewers) |
13.5/22 (22.761 M viewers) |
10.6/16 (17.092 M viewers) |
13.4/22 (22.339 M viewers) |
No Game |
| 2008 | Fox | Philadelphia Phillies 4, Tampa Bay Rays 1 |
8.4/14 (13.193 M viewers)[6] |
9.2/15 (14.634 M viewers) |
8.1/13 (12.777 M viewers) |
6.1/13 (9.836 M viewers) |
9.3/15 (15.479 M viewers) |
9.6/14 (15.787 M viewers) |
No Game | |
| 2007 | Fox | Boston Red Sox 4, Colorado Rockies 0 |
10.6/18 (17.123 M viewers)[6] |
10.5/18 (16.897 M viewers) |
11.1/18 (16.950 M viewers) |
8.5/16 (14.055 M viewers) |
12.6/21 (20.946 M viewers) |
No Game | ||
| 2006 | Fox | St. Louis Cardinals 4, Detroit Tigers 1 |
10.1/17 (15.812 M viewers)[6] |
8.0/15 (12.840 M viewers) |
11.6/18 (18.165 M viewers) |
10.2/17 (15.582 M viewers) |
10.4/18 (16.113 M viewers) |
10.3/18 (16.277 M viewers) |
No Game | |
| 2005 | Fox | Chicago White Sox 4, Houston Astros 0 |
11.1/19 (17.162 M viewers) |
9.5/17 (15.015 M viewers) |
11.1/17 (17.190 M viewers) |
11.0/21 (16.652 M viewers) |
13.0/21 (19.979 M viewers) |
No Game | ||
| 2004 | Fox | Boston Red Sox 4, St. Louis Cardinals 0 |
15.8/26 (25.390 M viewers) |
13.7/25 (23.168 M viewers) |
15.9/24 (25.463 M viewers) |
15.7/24 (24.422 M viewers) |
18.2/28 (28.844 M viewers) |
No Game | ||
| 2003 | Fox | Florida Marlins 4, New York Yankees 2 |
12.8/22 (20.143 M viewers) |
10.9/20 (17.687 M viewers) |
12.6/20 (20.552 M viewers) |
12.5/21 (18.889 M viewers) |
13.6/23 (20.885 M viewers) |
13.2/21 (19.919 M viewers) |
13.9/25 (23.240 M viewers) |
No Game |
| 2002 | Fox | Anaheim Angels 4, San Francisco Giants 3 |
11.9/20 (19.261 M viewers) |
9.4/18 (15.457 M viewers) |
11.9/20 (19.368 M viewers) |
10.8/18 (17.043 M viewers) |
11.8/19 (18.085 M viewers) |
10.0/17 (15.840 M viewers) |
11.8/21 (19.221 M viewers) |
17.9/28 (30.814 M viewers) |
| 2001 | Fox | Arizona Diamondbacks 4, New York Yankees 3 |
15.7/26 (24.528 M viewers) |
10.4/19 (16.476 M viewers) |
15.0/23 (23.550 M viewers) |
15.4/24 (23.407 M viewers) |
15.8/27 (23.692 M viewers) |
14.4/24 (21.323 M viewers) |
13.8/24 (22.672 M viewers) |
23.5/34 (39.084 M viewers) |
| 2000 | Fox | New York Yankees 4, New York Mets 1 |
12.4/21 (18.081 M viewers) |
11.5/22 (17.556 M viewers) |
12.6/20 (19.045 M viewers) |
12.4/21 (17.453 M viewers) |
12.5/21 (17.611 M viewers) |
13.1/21 (18.927 M viewers) |
No Game | |
| 1999 | NBC | New York Yankees 4, Atlanta Braves 0 |
16.0/26 (23.731 M viewers) |
14.2/26 (22.035 M viewers) |
15.0/23 (22.825 M viewers) |
16.8/27 (24.116 M viewers) |
17.8/29 (25.848 M viewers) |
No Game | ||
| 1998 | Fox | New York Yankees 4, San Diego Padres 0 |
14.1/24 (20.340 M viewers) |
12.4/23 (18.740 M viewers) |
12.6/20 (17.860 M viewers) |
15.4/25 (21.970 M viewers) |
16.6/27 (23.390 M viewers) |
No Game | ||
| 1997 | NBC | Florida Marlins 4, Cleveland Indians 3 |
16.7/29 (24.790 M viewers) |
11.3/22 (16.810 M viewers) |
15.0/24 (22.460 M viewers) |
15.6/27 (22.190 M viewers) |
15.5/26 (22.070 M viewers) |
17.2/30 (24.200 M viewers) |
15.5/28 (23.740 M viewers) |
24.5/39 (37.990 M viewers) |
| 1996 | Fox | New York Yankees 4, Atlanta Braves 2 |
17.4/29 (25.220 M viewers) |
15.7/25 (23.690 M viewers) |
14.0/23 (19.430 M viewers) |
17.5/28 (23.990 M viewers) |
17.9/32 (25.160 M viewers) |
20.0/32 (28.520 M viewers) |
19.1/34 (30.440 M viewers) |
No Game |
| 1995 | ABC | Atlanta Braves 4, Cleveland Indians 2 |
19.5/33 (28.970 M viewers) |
16.4/30 (25.150 M viewers) |
20.0/33 (28.670 M viewers) |
21.6/34 (31.710 M viewers) |
No Game | |||
| NBC | 19.4/31 (29.350 M viewers) |
20.0/34 (28.720 M viewers) |
19.5/35 (30.280 M viewers) | |||||||
| 1994 | Canceled due to the MLB strike | |||||||||
| 1993 | CBS | Toronto Blue Jays 4, Philadelphia Phillies 2 |
17.3/30 (24.700 M viewers) |
15.5/29 (23.100 M viewers) |
17.9/29 (25.200 M viewers) |
15.2/28 (20.570 M viewers) |
18.0/31 (24.590 M viewers) |
18.4/30 (26.110 M viewers) |
19.1/35 (29.050 M viewers) |
No Game |
| 1992 | CBS | Toronto Blue Jays 4, Atlanta Braves 2 |
20.2/34 (30.010 M viewers) |
15.6/28 (25.020 M viewers) |
20.2/32 (29.590 M viewers) |
20.8/33 (29.980 M viewers) |
18.9/30 (26.410 M viewers) |
21.6/36 (31.230 M viewers) |
22.7/41 (35.000 M viewers) |
No Game |
| 1991 | CBS | Minnesota Twins 4, Atlanta Braves 3 |
24.0/39 (35.680 M viewers) |
17.6/32 (26.310 M viewers) |
21.7/34 (30.840 M viewers) |
23.5/39 (33.170 M viewers) |
22.9/36 (32.100 M viewers) |
22.9/37 (33.180 M viewers) |
25.4/44 (40.830 M viewers) |
32.2/49 (50.340 M viewers) |
| 1990 | CBS | Cincinnati Reds 4, Oakland Athletics 0 |
20.8/36 (30.240 M viewers) |
20.2/32 (28.600 M viewers) |
21.8/37 (30.570 M viewers) |
19.4/35 (28.720 M viewers) |
21.4/38 (32.910 M viewers) |
No Game | ||
| 1989 | ABC | Oakland Athletics 4, San Francisco Giants 0 |
16.4/29 (24.550 M viewers) |
16.2/30 (25.030 M viewers) |
17.4/28 (25.410 M viewers) |
17.5/32 (26.610 M viewers) |
14.7/28 (21.640 M viewers) |
No Game | ||
| 1988 | NBC | Los Angeles Dodgers 4, Oakland Athletics 1 |
23.9/39 (34.490 M viewers) |
20.5/38 (30.350 M viewers) |
23.1/36 (34.700 M viewers) |
24.8/40 (34.990 M viewers) |
24.2/39 (33.960 M viewers) |
27.0/43 (38.800 M viewers) |
No Game | |
| 1987 | ABC | Minnesota Twins 4, St. Louis Cardinals 3 |
24.0/41 (35.340 M viewers) |
19.2/35 (30.570 M viewers) |
21.9/34 (33.660 M viewers) |
24.9/40 (34.990 M viewers) |
23.8/38 (34.040 M viewers) |
23.4/38 (32.550 M viewers) |
20.9/47 (29.090 M viewers) |
32.6/50 (51.180 M viewers) |
| 1986 | NBC | New York Mets 4, Boston Red Sox 3 |
28.6/46 (36.370 M viewers) |
24.2/42 (33.100 M viewers) |
25.5/41 (32.340 M viewers) |
25.6/40 (33.200 M viewers) |
26.0/41 (34.490 M viewers) |
29.8/47 (38.710 M viewers) |
30.3/52 (44.510 M viewers) |
38.9/55 (55–60 M viewers)[9] |
| 1985 | ABC | Kansas City Royals 4, St. Louis Cardinals 3 |
25.3/39 (34.510 M viewers) |
22.1/37 (31.510 M viewers) |
23.2/35 (31.770 M viewers) |
25.4/38 (32.800 M viewers) |
24.8/38 (35.040 M viewers) |
24.9/38 (30.950 M viewers) |
24.2/41 (34.860 M viewers) |
32.6/47 (45.000 M viewers) |
| 1984 | NBC | Detroit Tigers 4, San Diego Padres 1 |
22.9/40 (28.010 M viewers) |
27.7/44 (33.860 M viewers) |
26.0/40 (32.010 M viewers) |
21.5/35 (26.810 M viewers) |
15.0/41 (18.020 M viewers) |
22.7/42 (28.580 M viewers) |
No Game | |
| 1983 | ABC | Baltimore Orioles 4, Philadelphia Phillies 1 |
23.4/41 (29.540 M viewers) |
27.7/41 (36.230 M viewers) |
26.8/40 (34.550 M viewers) |
23.9/40 (30.120 M viewers) |
17.6/47 (20.260 M viewers) |
21.0/39 (26.950 M viewers) |
No Game | |
| 1982 | NBC | St. Louis Cardinals 4, Milwaukee Brewers 3 |
27.9/49 (38.070 viewers) |
27.9/42 (37.460 M viewers) |
29.1/45 (37.700 M viewers) |
25.0/41 (32.890 M viewers) |
21.0/56 (26.210 M viewers) |
30.4/57 (48.990 M viewers) |
24.0/44 (32.350 M viewers) |
38.2/56 (49.930 M viewers) |
| 1981 | ABC | Los Angeles Dodgers 4, New York Yankees 2 |
30.0/49 (41.370 viewers) |
29.9/46 (39.720 M viewers) |
28.8/44 (39.110 M viewers) |
29.0/47 (40.140 M viewers) |
28.4/57 (37.970 M viewers) |
26.4/45 (39.110 M viewers) |
37.2/54 (n.a. viewers) |
No Game |
| 1980 | NBC | Philadelphia Phillies 4, Kansas City Royals 2 |
32.8/56 (42.300 M viewers) |
33.5/52 (42.040 M viewers) |
34.4/53 (42.990 M viewers) |
32.0/53 (39.170 M viewers) |
23.9/60 (29.320 M viewers) |
32.0/60 (45.460 M viewers) |
40.0/60 (54.860 M viewers) |
No Game |
| 1979 | ABC | Pittsburgh Pirates 4, Baltimore Orioles 3 |
28.5/50 (37.960 M viewers) |
28.2/46 (38.140 M viewers) |
29.6/48 (36.320 M viewers) |
22.5/39 (31.420 M viewers) |
23.5/63 (27.210 M viewers) |
26.2/53 (39.090 M viewers) |
32.5/48 (43.640 M viewers) |
36.9/56 (49.890 M viewers) |
| 1978 | NBC | New York Yankees 4, Los Angeles Dodgers 2 |
32.8/56 (44.279 M viewers) |
33.1/51 (43.510 M viewers) |
32.2/50 (42.720 M viewers) |
33.0/54 (43.810 M viewers) |
30.1/65 (39.220 M viewers) |
32.6/60 (45.870 M viewers) |
35.9/54 (50.600 M viewers) |
No Game |
| 1977 | ABC | New York Yankees 4, Los Angeles Dodgers 2 |
29.8/53 (37.150 M viewers) |
30.3/50 (36.960 M viewers) |
30.5/49 (35.880 M viewers) |
30.2/51 (37.410 M viewers) |
27.2/64 (31.460 M viewers) |
26.6/52 (37.010 M viewers) |
33.9/50 (44.200 M viewers) |
No Game |
| 1976 | NBC | Cincinnati Reds 4, New York Yankees 0 |
27.5/48 (34.720 viewers) |
20.3/58 (23.730 M viewers) |
29.4/43 (n.a. viewers) |
29.8/44 (36.250 M viewers) |
30.5/48 (38.790 M viewers) |
No Game | ||
| 1975 | NBC | Cincinnati Reds 4, Boston Red Sox 3 |
28.7/52 (35.960 M viewers) |
20.0/58 (20.990 M viewers) |
20.1/53 (24.320 M viewers) |
28.9/47 (37.910 M viewers) |
28.0/46 (34.640 M viewers) |
30.9/48 (40.710 M viewers) |
33.3/55 (41.570 M viewers) |
39.6/60 (51.560 M viewers) |
| 1974 | NBC | Oakland Athletics 4, Los Angeles Dodgers 1 |
25.6/46 (29.080 M viewers) |
23.4/55 (23.750 M viewers) |
25.7/52 (30.470 M viewers) |
26.5/41 (29.830 M viewers) |
25.4/39 (29.760 M viewers) |
27.2/42 (31.610 M viewers) |
No Game | |
| 1973 | NBC | Oakland Athletics 4, New York Mets 3 |
30.7/57 (34.750 M viewers) |
26.4/60 (27.444 M viewers) |
28.8/55 (35.661 M viewers) |
33.6/52 (38.030 M viewers) |
32.2/50 (36.670 M viewers) |
32.6/50 (37.364 M viewers) |
27.7/67 (28.610 M viewers) |
33.7/67 (39.935 M viewers) |
| 1972 | NBC | Oakland Athletics 4, Cincinnati Reds 3 |
27.6/58 (n.a. viewers) |
21.2/60 (22.534 M viewers) |
23.3/57 (27.331 M viewers) |
33.6/49 (37.880 M viewers) |
33.5/50 (38.210 M viewers) |
22.3/56 (23.120 M viewers) |
26.5/63 (30.048 M viewers) |
32.8/71 (41.438 M viewers) |
| 1971 | NBC | Pittsburgh Pirates 4, Baltimore Orioles 3 |
24.2/59 (n.a. viewers) |
21.8/58 (24.778 M viewers) |
16.5/51 (13.633 M viewers) |
16.5/51 (13.633 M viewers) |
34.8/54 (38.898 M viewers) |
16.5/51 (13.633 M viewers) |
28.1/72 (28.095 M viewers) |
34.2/72 (37.420 M viewers) |
| 1970 | NBC | Baltimore Orioles 4, Cincinnati Reds 1 |
19.4/53 (n.a. viewers) |
23.5/58 (14.120 M viewers) |
22.3/55 (13.400 M viewers) |
17.2/51 (10.340 M viewers) |
17.2/51 (10.340 M viewers) |
17.2/51 (10.340 M viewers) |
No Game | |
| 1969 | NBC | New York Mets 4, Baltimore Orioles 1 |
22.4/58 (n.a. viewers) |
25.5/64 (14.920 M viewers) |
29.2/63 (17.080 M viewers) |
19.3/54 (11.290 M viewers) |
19.3/54 (11.290 M viewers) |
19.3/54 (11.290 M viewers) |
No Game | |
| 1968 | NBC | Detroit Tigers 4, St. Louis Cardinals 3 |
22.8/57 (n.a. viewers) |
20.4/53 (n.a. viewers) |
20.4/53 (n.a. viewers) |
26.5/68 (24.780 M viewers) |
26.4/61 (27.542M viewers) |
21.2/54 (n.a. viewers) |
21.2/54 (n.a. viewers) |
21.2/54 (n.a. viewers) |
| Year | Net. | Results | Average | Game 1 | Game 2 | Game 3 | Game 4 | Game 5 | Game 6 | Game 7 |
Source: 1968 through 2007 figures are per Nielsen documents;[5][15] more recent years per inline citations.
See also
Notes
- The first World Series broadcast on television was in 1947 between the New York Yankees and Brooklyn Dodgers, carried regionally in the New York City area.[2][3]
- Nielsen records do not list a viewership figure for this game.[5]
References
- Young, Dick (January 31, 1964). "Young Ideas". Daily News. New York City. p. 57. Retrieved November 4, 2019 – via newspapers.com.
- Gross, Ben (September 27, 1947). "Listening In". Daily News. New York City. p. 16. Retrieved November 3, 2019 – via newspapers.com.
- "100 See Series Here Over Television". The Tribune. Scranton, Pennsylvania. October 1, 1947. p. 3. Retrieved November 3, 2019 – via newspapers.com.
- Porter, Rick (October 5, 2019). "TV Long View: A Guide to the Ever-Expanding World of Ratings Data". The Hollywood Reporter. Retrieved November 3, 2019.
- "World Series Through 2007 Game by Game". Nielsen Media Research. 2007. Retrieved November 3, 2019 – via Wayback Machine. Cite journal requires
|journal=(help) - Mitch Metcalf (November 3, 2016). "World Series Ratings through Game 7". Showbuzz Daily. Retrieved November 3, 2016.
- Quinn, Dan (October 30, 1986). "World Series came out big winner over NFL". The Journal News. White Plains, New York. p. 42. Retrieved November 3, 2019 – via newspapers.com.
- "Game 7 breaks audience mark". The Advocate. Newark, Ohio. AP. October 30, 1986. p. 15. Retrieved November 3, 2019 – via newspapers.com.
- Bonesteel, Matt (November 3, 2016). "Cursed teams make for good TV: World Series Game 7 scores boffo ratings". The Washington Post. Retrieved November 3, 2019.
- Paulsen (October 27, 2019). "World Series posts lowest rating ever in Game 4". SportsMediaWatch.com. Retrieved October 29, 2019.
- Newman, Mark (October 25, 2008). "Rain doesn't dampen enthusiasm". MLB.com. Archived from the original on October 27, 2008. Retrieved October 25, 2008.
- "World Series Game 7 Averages Over 40 Million Viewers – Fox Sports PressPass". Retrieved 22 March 2017.
- World Series Game 7 Averages Over 40 Million Viewers
- Fox Sports and Major League Baseball Extend Rights Deal Through 2028
- "MLB World Series". Nielsen Media Research. 2007. Retrieved November 3, 2019 – via Wayback Machine. Cite journal requires
|journal=(help) - Paulsen (October 31, 2019). "Game 7 helps World Series avoid all-time lows". sportsmediawatch.com. Retrieved October 31, 2019.
- Pucci, Douglas (October 23, 2019). "Tuesday Final Ratings: Fox Wins Prime Time by Large Margin Despite Nationals-Astros Game One Earning Five-Year Low for a World Series Telecast". programminginsider.com. Retrieved October 23, 2019.
- Pucci, Douglas (October 25, 2019). "Wednesday Final Ratings: Tyler Perry's 'The Oval' and 'Sistas' on BET Off to Decent Starts". programminginsider.com. Retrieved October 25, 2019.
- Pucci, Douglas (October 29, 2019). "Friday Final Ratings: Astros-Nationals Delivers Least-Watched World Series Game Three in Five Years". programminginsider.com. Retrieved October 29, 2019.
- Pucci, Douglas (October 29, 2019). "Saturday Final Ratings: Astros-Nationals Game 4 Posts Lowest-Rated World Series Telecast Among Households To-Date". programminginsider.com. Retrieved November 2, 2019.
- Pucci, Douglas (October 30, 2019). "Sunday Final Ratings: Packers-Chiefs on NBC's 'Sunday Night Football' More Than Doubles the Adults 18-49 of Astros-Nationals World Series Game Five on Fox". programminginsider.com. Retrieved October 30, 2019.
- Pucci, Douglas (October 30, 2019). "Tuesday Final Ratings: World Series on Fox Picks Up Considerable Steam with Nationals-Astros Game Six". programminginsider.com. Retrieved October 30, 2019.
- Pucci, Douglas (October 31, 2019). "Wednesday Final Ratings: Nearly 24 Million Viewers for World Series Game Seven Across All Fox Platforms". programminginsider.com. Retrieved October 31, 2019.
- "World Series 4th-least-watched, averaging 14.1M viewers". Boston Herald. AP. October 30, 2018. Retrieved October 31, 2018.
- Pucci, Douglas (October 24, 2018). "Tuesday Final Ratings: Dodgers-Red Sox Draw Four-Year Low for a World Series Game One on Fox". programminginsider.com. Retrieved October 24, 2018.
- Pucci, Douglas (October 25, 2018). "Wednesday Final Ratings: World Series on Fox at Four-Year Low Through Two Games". programminginsider.com. Retrieved October 25, 2018.
- Pucci, Douglas (October 29, 2018). "Friday Final Ratings: 18-Inning World Series Game Three Helps Fox Quadruple the Runner-Up Network Among Adults 18-49". programminginsider.com. Retrieved October 29, 2018.
- Pucci, Douglas (October 30, 2018). "Saturday Final Ratings: Fox, with World Series Game Four, More Than Triples Runner-Up ABC Among Adults 18-49". programminginsider.com. Retrieved November 1, 2018.
- Pucci, Douglas (October 30, 2018). "Sunday Final Ratings: World Series Game Five on Fox Bests Competing 'Sunday Night Football' NBC Telecast for Third Straight Year". programminginsider.com. Retrieved October 30, 2018.
- Paulsen (October 25, 2017). "World Series Game 1 Second-Most Watched Since 2010". Sports Media Watch. Retrieved November 1, 2017.
- Mitch Metcalf (October 25, 2017). "Top 150 Tuesday Cable Originals & Network Finals: 10.24.2017". Showbuzz Daily. Retrieved November 1, 2017.
- Paulsen (October 27, 2017). "World Series Game 2 Third-Most Watched in a Decade". Sports Media Watch. Retrieved November 1, 2017.
- Mitch Metcalf (October 26, 2017). "Top 150 Wednesday Cable Originals & Network Finals: 10.25.2017". Showbuzz Daily. Retrieved November 1, 2017.
- Paulsen (October 28, 2017). "World Series Posts Second-Best Game 3 Audience Since 2005". Retrieved November 1, 2017.
- Mitch Metcalf (October 30, 2017). "Top 150 Friday Cable Originals & Network Finals: 10.27.2017". Showbuzz Daily. Retrieved November 1, 2017.
- Paulsen (October 29, 2017). "World Series Scores Second-Best Saturday Audience Since 2004". Sports Media Watch. Retrieved November 1, 2017.
- Mitch Metcalf (October 31, 2017). "Top 150 Saturday Cable Originals & Network Finals: 10.28.2017". Showbuzz Daily. Retrieved November 1, 2017.
- Paulsen (October 31, 2017). "World Series Third-Best in Decade Entering Game 6". Sports Media Watch. Retrieved November 1, 2017.
- Mitch Metcalf (October 31, 2017). "Top 150 Sunday Cable Originals & Network Finals: 10.29.2017". Showbuzz Daily. Retrieved November 1, 2017.
- Paulsen (November 1, 2017). "Astros-Dodgers Game 6 Among Top World Series Games Since 2004". Sports Media Watch. Retrieved November 1, 2017.
- Mitch Metcalf (November 1, 2017). "Top 150 Tuesday Cable Originals & Network Finals: 10.31.2017". Showbuzz Daily. Retrieved November 1, 2017.
- Paulsen (November 2, 2017). "Over 28 Million For World Series Game 7". Sports Media Watch. Retrieved November 2, 2017.
- Mitch Metcalf (November 2, 2017). "Top 150 Wednesday Cable Originals & Network Finals: 11.1.2017". Showbuzz Daily. Retrieved November 2, 2017.
- Paulsen (October 26, 2016). "Fueled By Cubs, World Series Opener is Strongest in Years". Sports Media Watch. Retrieved October 26, 2016.
- Mitch Metcalf (October 26, 2016). "Top 150 Tuesday Cable Originals & Network Finals: 10.25.2016". Showbuzz Daily. Retrieved October 26, 2016.
- Paulsen (October 27, 2016). "World Series Game 2 Dips From Opener, But Still Best Since 2009". Sports Media Watch. Retrieved October 27, 2016.
- Mitch Metcalf (October 27, 2016). "Top 150 Wednesday Cable Originals & Network Finals: 10.26.2016". Showbuzz Daily. Retrieved October 27, 2016.
- Paulsen (October 29, 2016). "World Series' Return to Wrigley Top Game 3 Since 2004". Sports Media Watch. Retrieved October 31, 2016.
- Mitch Metcalf (October 31, 2016). "Top 150 Friday Cable Originals & Network Finals: 10.28.2016". Showbuzz Daily. Retrieved October 31, 2016.
- Paulsen (October 30, 2016). "World Series Scores Best Saturday Night Audience Since 2004". Sports Media Watch. Retrieved November 1, 2016.
- Mitch Metcalf (November 1, 2016). "Top 150 Saturday Cable Originals & Network Finals: 10.29.2016". Showbuzz Daily. Retrieved November 1, 2016.
- Paulsen (October 31, 2016). "Multiple Viewership Milestones For Cubs' Game 5 Win". Sports Media Watch. Retrieved November 1, 2016.
- Mitch Metcalf (November 1, 2016). "Top 150 Sunday Cable Originals & Network Finals: 10.30.2016". Showbuzz Daily. Retrieved November 1, 2016.
- Paulsen (November 2, 2016). "For Second Straight Night, World Series Hits 19-Year Viewership High". Sports Media Watch. Retrieved November 2, 2016.
- Mitch Metcalf (November 2, 2016). "Top 150 Tuesday Cable Originals & Network Finals: 11.1.2016". Showbuzz Daily. Retrieved November 2, 2016.
- Paulsen (November 3, 2016). "Whoa Cubs Whoa: 40 Million Watch Game 7 of the World Series". Sports Media Watch. Retrieved November 3, 2016.
- Mitch Metcalf (November 3, 2016). "Top 150 Wednesday Cable Originals & Network Finals: 11.2.2016". Showbuzz Daily. Retrieved November 3, 2016.
External links
- Game-by-game ratings (1968–2007) spreadsheet via Wayback Machine
- Average viewership (1973–2007) spreadsheet via Wayback Machine
|