Tropical cyclones in 2017
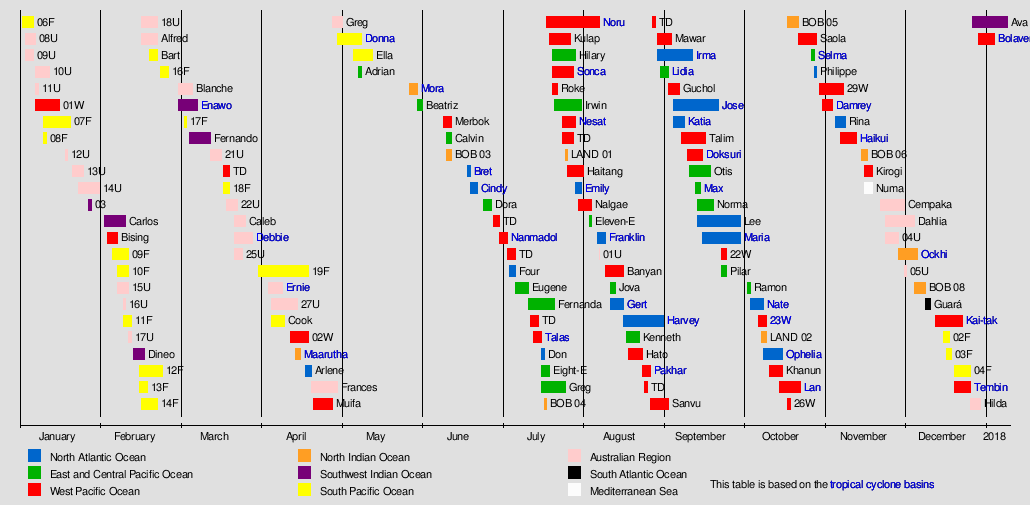
During 2017, tropical cyclones formed within seven different tropical cyclone basins, located within various parts of the Atlantic, Pacific and Indian Oceans. During the year, a total of 146 tropical cyclones had formed this year to date. 88 tropical cyclones had been named by either a Regional Specialized Meteorological Center (RSMC) or a Tropical Cyclone Warning Center (TCWC). The most active basin in the year was the Western Pacific, which documented 27 named systems, the season was a slightly below-average season and the first since 1977 season saw no Category 5-equivalent super typhoon. The Eastern Pacific, despite only amounting to 18 named systems, also was a was significantly less active than the previous three Pacific hurricane seasons (2014, 2015 and 2016). However, the North Atlantic hurricane features 17 named storms, which was costliest tropical cyclone season on record. It also had the fifth-most named storms since reliable records began in 1851 – tied with 1936 – and the most major hurricanes since 2005. The Australian region season experienced the average number of cyclones reaching tropical storm intensity, numbering 11, respectively. Activity across the southern hemisphere's three basins—South-West Indian, Australian, and South Pacific—was spread evenly, with each region recording seven named storms apiece.
| Tropical cyclones in 2017 | |
|---|---|
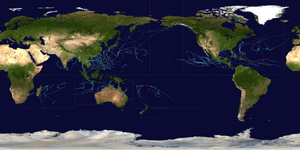 Year summary map | |
| Year boundaries | |
| First system | 06F |
| Formed | January 2, 2017 |
| Last system | Ava |
| Dissipated | January 9, 2018 |
| Strongest system | |
| Name | Maria |
| Lowest pressure | 908 mbar/hPa; 26.81 inHg |
| Longest lasting system | |
| Name | 19F & Noru |
| Duration | 20 days |
| Year statistics | |
| Total systems | 146 |
| Named systems | 88 |
| Total fatalities | 5,645 total |
| Total damage | $321.44 billion (2017 USD) |
The strongest tropical cyclone was Hurricane Maria with a minimum barometric pressure of 908 mbar (hPa; 26.81 inHg). The costliest tropical cyclone of the year was Hurricane Harvey in the Atlantic, which struck Houston metropolitan area in August causing US$125 billion in damage, tying with Hurricane Katrina as the costliest tropical cyclone worldwide. The deadliest tropical cyclone of the year was Hurricane Maria in the North Atlantic which killed 3,000 people in Puerto Rico and Dominica.
Global atmospheric and hydrological conditions
For the majority of the year, the tropics were dominated by neutral El Niño–Southern Oscillation (ENSO) conditions, before La Niña conditions set in later in the year.[1] As the year opened, sea surface temperatures anomalies across the central and east-central equatorial Pacific were cooler than average, while the impacts of La Niña lingered within the atmospheric circulation, following an abrupt end to the 2016 La Niña episode. Over the next few months, these anomalies warmed and nearly reached the thresholds needed for an El Niño event to be declared, however, they subsequently cooled throughout the rest of the year and the 2017–18 La Niña event was declared to be underway.
North Atlantic
Scientists pointed out that the increase of CO
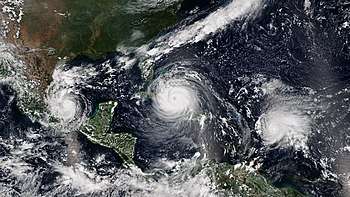
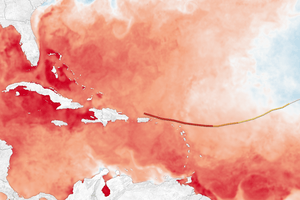
2 emissions contributes to warmer ocean waters and more moist air for rain.[2] Because of sea level rise it is assumed that the storm surge of Hurricane Irma and other storms will cause greater flooding to vulnerable areas.[3][2] Data collected by NASA showed that ocean surface temperatures in the path of Irma were above 30 °C (86 °F), capable of sustaining a Category 5 hurricane.[4]
Prior to affecting the U.S. mainland, Miami’s mayor Tomás Regalado noted on Hurricane Irma, "This is the time to talk about climate change. This is the time that the president and the EPA and whoever makes decisions needs to talk about climate change."[5] A day later the head of the EPA, Scott Pruitt said, "..to discuss the cause and effect of these storms, there’s the… place (and time) to do that, it’s not now."[6] Following Irma's landfall, Donald Trump was asked about the connection between hurricanes and climate change, and stated that "We’ve had bigger storms than this."[7] Richard Branson who was directly impacted by hurricane Irma noted, "..hurricanes are the start of things to come. Look, climate change is real. Ninety-nine per cent of scientists know it's real. The whole world knows it's real except for maybe one person in the White House."[8]
United Nations secretary general António Guterres citing the devastation from hurricanes noted in September, "The catastrophic Atlantic hurricane season has been made worse by climate change. Cutting carbon emissions must clearly be part of our response to the disaster. The rise in the surface temperature of the ocean has had an impact on weather patterns and we must do everything possible to bring it down."[9]
The Associated Press looked at the yearly average Accumulated Cyclone Energy (ACE), which accounts for wind speed and storm duration to assess hurricane power of the past 30 years and found it to be 41 percent higher than the previous 30 years. They asked several experts about their opinion, James Kossin from NOAA “There’s no question that the storms are stronger than they were 30 years ago.” Climate scientist Stefan Rahmstorf of the Potsdam Institute for Climate Impact Research, “The only caveat being that the increase might be exaggerated somewhat because of undercounting early storms.” Meteorologist Philip Klotzbach noted, “What’s happening with hurricanes — the frequency, the duration, and the energy — is probably a combination of factors caused by both nature and man, a mish-mosh of everything.”[10] Kerry Emanuel who studies hurricanes, told the BBC, "The warming of the climate has increased the underlying probabilities of very heavy rain events like happened in Harvey and very high category hurricanes like Irma. It is just not sensible to say either storm was caused by climate change, but the underlying probabilities are going up."[11]
Summary
Systems
January
| Storm name | Dates active | Max wind km/h (mph) | Min pressure (mbar) | Areas affected | Damage (USD) | Deaths | Refs |
|---|---|---|---|---|---|---|---|
| 06F | January 2–6 | Unspecified | 1002 | None | None | None | |
| 08U | January 3–7 | Unspecified | 994 | Northern Territory, Western Australia | None | None | |
| 09U | January 3–15 | Unspecified | 1003 | Cocos (Keeling) Islands, Christmas Island | None | None | |
| 10U | January 7–12 | Unspecified | 1001 | Northern Territory | None | None | |
| 11U | January 7–8 | Unspecified | 1000 | Queensland | None | None | |
| 01W (Auring) | January 7–16 | 55 (35) | 1002 | Philippines, Vietnam, Cambodia | $140 thousand | 11 | [12][13] |
| 07F | January 10–20 | Unspecified | 998 | None | None | None | |
| 08F | January 10–11 | Unspecified | 1009 | None | None | None | |
| 12U | January 18–19 | Unspecified | Unspecified | None | None | None | |
| 13U | January 21–25 | Unspecified | 1009 | None | None | None | |
| 14U | January 23–31 | 85 (50) | 988 | Northern Territory, Western Australia | None | None | |
| 03 | January 27–28 | 55 (35) | 1005 | None | None | None |
February
| Storm name | Dates active | Max wind km/h (mph) | Min pressure (mbar) | Areas affected | Damage (USD) | Deaths | Refs |
|---|---|---|---|---|---|---|---|
| Carlos | February 2–10 | 130 (80) | 965 | None | None | None | |
| Bising | February 3–7 | 55 (35) | 1000 | None | None | None | |
| 09F | February 5–11 | Unspecified | 999 | Fiji | None | None | |
| 10F | February 7–11 | Unspecified | 993 | Fiji, Vanuatu | None | None | |
| 15U | February 7–11 | Unspecified | 984 | Western Australia | Unknown | 2 | |
| 16U | February 9–10 | Unspecified | Unspecified | New Caledonia | None | None | |
| 11F | February 9–12 | Unspecified | 1002 | Vanuatu, Fiji | None | None | |
| 17U | February 11–12 | Unspecified | 1004 | Northern Territory | None | None | |
| Dineo | February 13–17 | 140 (85) | 955 | Mozambique, South Africa, Zimbabwe, Botswana, Malawi | $217 million | 280 | [14][15][16] |
| 12F | February 15–24 | Unspecified | 1002 | Fiji | None | None | |
| 13F | February 15–18 | Unspecified | 998 | None | None | None | |
| 14F | February 16–22 | 55 (35) | 997 | Fiji | None | None | |
| 18U | February 16–22 | Unspecified | Unspecified | None | None | None | |
| Alfred | February 16–22 | 85 (50) | 994 | Northern Territory, Queensland | Unknown | Unknown | |
| Bart | February 19–22 | 75 (45) | 994 | Southern Cook Islands | None | None | |
| 16F | February 23–26 | Unspecified | 1005 | None | None | None |
March

| Storm name | Dates active | Max wind km/h (mph) | Min pressure (mbar) | Areas affected | Damage (USD) | Deaths | Refs |
|---|---|---|---|---|---|---|---|
| Blanche | March 2–7 | 100 (65) | 984 | Northern Territory, Western Australia | None | None | |
| Enawo | March 2–7 | 205 (125) | 932 | Madagascar, Réunion | $20 million | 99 | [17][18][16] |
| 17F | March 4–5 | Unspecified | 1006 | None | None | None | |
| Fernando | March 6–14 | 70 (45) | 992 | Rodriques | None | None | |
| 21U | March 14–18 | Unspecified | Unspecified | None | None | None | |
| TD | March 19–21 | Unspecified | 1008 | Philippines | None | None | |
| 18F | March 19–21 | Unspecified | 1007 | None | None | None | |
| 22U | March 20–24 | 95 (60) | 985 | Western Australia | None | None | |
| Caleb | March 23–27 | 85 (50) | 989 | Cocos (Keeling) Islands | None | None | |
| Debbie | March 23–30 | 175 (110) | 949 | Queensland, New South Wales, New Zealand | $2.67 billion | 14 | [19][20] |
| 25U | March 23–26 | Unspecified | Unspecified | None | None | None |
April
| Storm name | Dates active | Max wind km/h (mph) | Min pressure (mbar) | Areas affected | Damage (USD) | Deaths | Refs |
|---|---|---|---|---|---|---|---|
| 19F | April 1–20 | Unspecified | 988 | Samoa, Niue | None | None | |
| Ernie | April 5–10 | 220 (140) | 922 | None | None | None | |
| 27U | April 6–16 | 55 (35) | 998 | Northern Territory, Western Australia | None | None | |
| Cook | April 6–10 | 155 (100) | 961 | Vanuatu, New Caledonia, New Zealand | Moderate | 1 | [21] |
| 02W (Crising) | April 13–20 | 55 (35) | 1006 | Philippines, Taiwan | $1.7 million | 10 | [22][23] |
| Maarutha | April 15–17 | 75 (45)3 | 996 | Myanmar, Andaman and Nicobar Islands, Thailand, Yunnan | $23.4 thousand | 4 | [24][25][26] |
| Arlene | April 19–21 | 85 (50)4 | 990 | None | None | None | |
| Frances | April 21 – May 1 | 120 (75) | 980 | New Guinea, Maluku, Northern Territory, Timor, Western Australia | None | None | |
| Muifa (Dante) | April 22–29 | 65 (40) | 1002 | None | None | None | |
| Greg | April 29 – May 3 | 65 (40) | 997 | None | None | None |
May
| Storm name | Dates active | Max wind km/h (mph) | Min pressure (mbar) | Areas affected | Damage (USD) | Deaths | Refs |
|---|---|---|---|---|---|---|---|
| Donna | May 1–10 | 205 (125) | 935 | Solomon Islands, Vanuatu, Fiji, New Caledonia, New Zealand | Significant | 2 | [27] |
| Ella | May 7–14 | 110 (70) | 977 | Samoan Islands, Tonga, Wallis and Futuna | None | None | |
| Adrian | May 9–10 | 75 (45)4 | 1004 | None | None | None | |
| Mora | May 28–31 | 110 (70)3 | 978 | Sri Lanka, Andaman and Nicobar Islands, East India, Northeast India, Bangladesh, Myanmar, Bhutan, Tibet | $1.36 billion | 135 | [28][29][30][31] |
| Beatriz | May 31 – June 2 | 75 (45)4 | 1001 | Southwestern Mexico | $3.7 million | 7 |
June
| Storm name | Dates active | Max wind km/h (mph) | Min pressure (mbar) | Areas affected | Damage (USD) | Deaths | Refs |
|---|---|---|---|---|---|---|---|
| Merbok | June 10–13 | 100 (65) | 985 | Philippines, South China | $90.8 million | None | |
| Calvin | June 11–13 | 75 (45)4 | 1004 | Southwestern Mexico, Guatemala | Unknown | None | |
| BOB 03 | June 11–13 | 55 (35)3 | 988 | Northeast India, Bangladesh | $223 million | 170 | [32] |
| Bret | June 19–20 | 85 (50)4 | 1007 | Guyana, Venezuela, Trinidad and Tobago, Windward Islands | ≥$3 million | 2 | |
| Cindy | June 20–23 | 95 (60)4 | 991 | Honduras, Belize, Cayman Islands, Yucatán Peninsula, Cuba, Southern United States, Eastern United States | $25 million | 2 | [33] |
| Dora | June 25–28 | 165 (105)4 | 974 | Southwestern Mexico | Minimum | None | |
| TD | June 29 – July 1 | Unspecified | 1008 | Japan | None | None | |
July
| Storm name | Dates active | Max wind km/h (mph) | Min pressure (mbar) | Areas affected | Damage (USD) | Deaths | Refs |
|---|---|---|---|---|---|---|---|
| Nanmadol (Emong) | July 1–4 | 100 (65) | 985 | Japan | $1.99 billion | 41 | [34][35][36][37] |
| TD | July 4–7 | 55 (35) | 1010 | Taiwan, Ryukyu Islands | None | None | |
| Four | July 5–7 | 45 (30)4 | 1009 | None | None | None | |
| Eugene | July 7–12 | 185 (115)4 | 966 | Baja California Peninsula, California | None | None | |
| Fernanda | July 12–22 | 230 (145)4 | 948 | Hawaii | None | None | |
| TD | July 13–16 | 55 (35) | 1006 | None | None | None | |
| Talas | July 14–17 | 95 (60) | 985 | Hainan, Indochina | $80.1 million | 14 | [38][39] |
| Don | July 17–18 | 85 (50)4 | 1005 | Windward Islands, Barbados, Trinidad and Tobago | None | None | |
| Eight-E | July 17–20 | 55 (35)4 | 1007 | None | None | None | |
| Greg | July 17–26 | 95 (60)4 | 1000 | None | None | None | |
| BOB 04 | July 18–19 | 45 (30)3 | 992 | Orissa, Madhya Pradesh, Chhattisgarh | $34.3 million | 7 | [40] |
| Noru | July 19 – August 8 | 175 (110) | 935 | Japan | $100 million | 2 | [41][42] |
| Kulap | July 20–28 | 75 (45) | 1002 | None | None | None | |
| Hilary | July 21–30 | 175 (110)4 | 969 | Southwestern Mexico | None | None | |
| Sonca | July 21–29 | 65 (40) | 994 | Hainan, Indochina | $306 million | 37 | [43][44][45] |
| Roke (Fabian) | July 21–23 | 65 (40) | 1002 | Philippines, Taiwan, South China | None | None | |
| Irwin | July 22 – August 1 | 150 (90)4 | 970 | None | None | None | |
| Nesat (Gorio) | July 25–30 | 150 (90) | 960 | Philippines, Ryukyu Islands, Taiwan, East China | $281 million | 3 | [46] |
| TD | July 25–29 | 55 (35) | 1006 | None | None | None | |
| LAND 01 | July 26–27 | 45 (30)3 | 992 | West Bengal, Jharkhand, Madhya Pradesh | $2.19 billion | 152 | [47][48] |
| Haitang (Huaning) | July 27 – August 2 | 85 (50) | 985 | Taiwan, East China | $3.77 million | None | |
| Emily | July 30 – August 1 | 95 (60)4 | 1001 | Florida | $10 million | None | [49] |
| Nalgae | July 31 – August 5 | 85 (50) | 990 | None | None | None | |
August

| Storm name | Dates active | Max wind km/h (mph) | Min pressure (mbar) | Areas affected | Damage (USD) | Deaths | Refs |
|---|---|---|---|---|---|---|---|
| Eleven-E | August 4–5 | 55 (35)4 | 1006 | None | None | None | |
| Franklin | August 7–10 | 140 (85)4 | 981 | Nicaragua, Honduras, Guatemala, Cayman Islands, Belize, Yucatán Peninsula, Central Mexico | $15 million | None | |
| 01U | August 8 | 35 (25) | 1005 | None | None | None | |
| Banyan | August 10–17 | 150 (90) | 955 | None | None | None | |
| Jova | August 12–14 | 65 (40)4 | 955 | Western Mexico | None | None | |
| Gert | August 12–17 | 175 (110)4 | 962 | Bermuda, East Coast of the United States, Atlantic Canada | None | 2 | |
| Harvey | August 17 – September 1 | 215 (120)4 | 937 | Barbados, Suriname, Guyana, Windward Islands, Jamaica, Cayman Islands, Nicaragua, Belize, Yucatán Peninsula, Northeastern Mexico, Southern United States (Texas, Louisiana), Eastern United States | $125 billion | 107 | |
| Hato (Isang) | August 19–24 | 140 (85) | 965 | Philippines, Taiwan, South China, Vietnam | $6.4 billion | 24 | |
| Pakhar (Jolina) | August 24–27 | 100 (65) | 985 | Philippines, South China, Vietnam, Thailand | $115 million | 13 | |
| TD | August 25–26 | Unspecified | 1002 | Vietnam | None | None | |
| Sanvu | August 27 – September 3 | 150 (90) | 955 | Mariana Islands, Ogasawara Islands | Unknown | 1 | |
| TD | August 28–29 | 55 (35) | 1002 | Philippines | Unknown | None | |
| Mawar | August 30 – September 4 | 95 (60) | 990 | Philippines, South China | $1.53 million | None | |
| Irma | August 30 – September 12 | 180 (285)4 | 914 | Cape Verde, Leeward Islands (Barbuda, Saint Martin, Saint Barthelemy, U.S. Virgin Islands), Puerto Rico, Hispaniola, Turks and Caicos Islands, The Bahamas, Cuba, Southeastern United States (Florida and Georgia), Northeastern United States | $64.76 billion | 134 | |
| Lidia | August 31 – September 3 | 100 (65)4 | 986 | Western Mexico, Baja California Peninsula, Arizona, California | $36.1 million | 20 |
September
.jpg)
| Storm name | Dates active | Max wind km/h (mph) | Min pressure (mbar) | Areas affected | Damage (USD) | Deaths | Refs |
|---|---|---|---|---|---|---|---|
| Guchol (Kiko) | September 3–7 | 65 (40) | 1000 | Philippines, Taiwan, East China | None | None | |
| Jose | September 5–22 | 250 (155) | 938 | Leeward Islands, East Coast of the United States | $2.84 million | 0 (1) | |
| Katia | September 5–9 | 165 (105) | 972 | Eastern Mexico | Unknown | 3 (0) | |
| Talim (Lannie) | September 8–17 | 175 (110) | 935 | Mariana Islands, Taiwan, East China, Japan | $750 million | 5 | |
| Doksuri (Maring) | September 10–16 | 150 (90) | 955 | Philippines, Hainan, Indochina, Bangladesh | $819 million | 45 | |
| Otis | September 11–19 | 185 (115) | 965 | None | None | None | |
| Max | September 13–15 | 150 (90) | 980 | Southern Mexico | $19.8 million | 1 | |
| Norma | September 14–20 | 120 (75) | 985 | Baja California Peninsula | None | None | |
| Lee | September 14–30 | 185 (115) | 962 | None | None | None | |
| Maria | September 16–30 | 280 (175) | 908 | Lesser Antilles (British Virgin Islands, Dominica, Guadeloupe, Martinique, Saint Croix), Puerto Rico, Hispaniola, Turks and Caicos Islands, The Bahamas, Southeastern United States, Mid-Atlantic States, United Kingdom, Ireland, France, Spain | $91.606 billion | 3,057 | |
| 22W (Nando) | September 23–25 | 55 (35) | 1002 | Philippines, South China, Vietnam | Minimal | None | |
| Pilar | September 23–25 | 85 (50) | 1000 | Western Mexico | Minimal | None |
October
| Storm aame | Dates active | Max wind km/h (mph) | Min pressure (mbar) | Areas affected | Damage (USD) | Deaths | Refs |
|---|---|---|---|---|---|---|---|
| Ramon | October 3-4 | 75 (45) | 1002 | Southern Mexico | None | None | |
| Nate | October 4-9 | 150 (90) | 981 | Central America, Cayman Islands, Cuba, Yucatán Peninsula, Gulf Coast of the United States (Louisiana, Mississippi, Alabama), East Coast of the United States, Atlantic Canada | $787 Million | 48 | |
| 23W | October 7-10 | 45 (35) | 1000 | Philippines, Hainan, Indochina | $602 Million | 109 | |
| LAND 02 | October 9-10 | 45 (35) | 996 | Bangladesh, West Bengal, Jharkhand, Odisha, Andhra Pradesh | Unknown | 7 | |
| Ophelia | October 9-16 | 185 (115) | 959 | Azores, Portugal, Spain, France, Ireland, United Kingdom, Norway, Sweden, Finland, Estonia, and Russia | > $87.7 million | 3 | |
| Khanun (Odette) | October 11-16 | 175 (110) | 955 | Philippines, Taiwan, South China, Vietnam | $373 million | 1 | |
| Lan (Paolo) | October 15-23 | 250 (155) | 915 | Caroline Islands, Philippines, Japan, South Korea | $2 Billion | 17 | |
| 26W | October 18-19 | 45 (30) | 1002 | Philippines | Minimal | 14 | |
| BOB 05 | October 19-22 | 45 (30) | 997 | Odisha, West Bengal, Northeastern India, Bangladesh | Unknown | 1 | |
| Saola (Quedan) | October 22-29 | 120 (75) | 975 | Caroline Islands, Japan | $250 Million | None | |
| Selma | October 27-28 | 65 (40) | 1004 | El Salvador, Honduras, Nicaragua | Unknown | 17 | |
| Philippe | October 28-29 | 65 (40) | 1000 | Central America, Cayman Islands, Yucatán Peninsula, Cuba, Florida | Minimal | None | |
| 29W | October 30-November 7 | 55 (35) | 1004 | Vietnam, Cambodia, Thailand, Malaysia | Minimal | 7 | |
| Damrey (Ramil) | October 31-November 4 | 165 (105) | 970 | Philippines, Vietnam, Cambodia, Thailand | $1.03 Billion | 151 | |
November
| Storm name | Dates active | Max wind km/h (mph) | Min pressure (mbar) | Areas affected | Damage (USD) | Deaths | Refs |
|---|---|---|---|---|---|---|---|
| Rina | November 5-9 | 95 (60) | 991 | None | None | None | |
| Haikui (Salome) | November 7-13 | 75 (45) | 998 | Philippines, South China, Central Vietnam | $4.26 Million | None | |
| BOB 06 | November 15-17 | 45 (35) | 1000 | Odisha, West Bengal, Andhra Pradesh | Unknown | 20 | |
| Kirogi (Tino) | November 16-19 | 75 (45) | 1000 | Philippines, Malaysia, Indochina | $10 Million | 10 | |
| Numa | November 16-20 | 100 (65) | 995 | United Kingdom, Ireland, France, Italy, Tunisia, Greece, Turkey | $100 Million | 22 | |
| Cempaka | November 22-29 | 65 (40) | 998 | Central Java, Special Region of Yogyakarta, East Java, Bali, Banten, West Java | $74 Million | 41 | |
| Dahlia | November 26-December 4 | 100 (65) | 985 | Sumatra, Java | None | None | |
| Ockhi | November 29-December 6 | 185 (115) | 976 | Sri Lanka, India, Maldives | $920 Million | 318 | |
Global effects
Notes
1 Only systems that formed either on or after January 1, 2017 are counted in the seasonal totals.
2 Only systems that formed either before or on December 31, 2017 are counted in the seasonal totals.
3 The wind speeds for this tropical cyclone are based on the IMD Scale which uses 3-minute sustained winds.
4 The wind speeds for this tropical cyclone are based on the Saffir Simpson Scale which uses 1-minute sustained winds.
References
- Hartfield, Gail; Blunden, Jessica; Arndt, Derek S. (2018). "State of the Climate in 2017" (PDF). Bulletin of the American Meteorological Society. 99 (8): S101–S142. doi:10.1175/2018BAMSStateoftheClimate.1.
|chapter=ignored (help) - "Irma and Harvey should kill any doubt that climate change is real". The Washington Post. September 7, 2017.
- "Why Hurricane Irma Could Hurt, a Lot: Much Lies in Harm's Way". The New York Times. September 7, 2017.
- "Hot water ahead for Hurricane Irma". NASA Global Climate Change. September 7, 2017.
- "Miami's mayor on Hurricane Irma: 'If this isn't climate change, I don't know what is'". Miami Herald. September 8, 2017.
- "Scott Pruitt says it's not the time to talk climate change. For him, it never is". The Washington Post. September 9, 2017.
- "Trump weighs in on climate change: Hey, there have been big hurricanes before". The Washington Post. September 14, 2017.
- "Richard Branson criticises Donald Trump after hurricanes: 'Whole world knows climate change is real'". The Independent. September 20, 2017.
- "UN secretary general links hurricane devastation to climate change". Climate Home. September 19, 2017.
- "Hurricane period ravaging Atlantic is the most active on record". Global News. October 5, 2017.
- "Hurricanes: A perfect storm of chance and climate change?". BBC. September 21, 2017.
- "Global Catastrophe Recap January 2017" (PDF). thoughtleadership.aonbenfield.com. Aon Benfield. Retrieved February 8, 2017.
- "'Auring' damage to agro-fishery in Negros Occidental reaches P7.14M". Sunstar. January 21, 2017.
- "Storm Dineo kills at least seven people in Mozambique – govt". Times Live. Reuters. February 16, 2017. Retrieved February 16, 2017.
- "Flash Appeal: Emergency Response Plan for Mozambique – Cyclone Dineo" (PDF). ReliefWeb. UN Country Team in Mozambique. February 28, 2017. Retrieved March 1, 2017.
- "Global Catastrophe Recap March 2017" (PDF). Aon Benfield. Retrieved 8 April 2017.
- "Madagascar: Cyclone Enawo Situation Report No. 3 (17 March 2017)". Relief Web. UN Office for the Coordination of Humanitarian Affairs. Retrieved 18 March 2017.
- "Madagascar cyclone death toll rises to 78". Channel NewsAsia. Agence France-Presse. March 15, 2017. Retrieved March 15, 2017.
- Tropical Cyclone Debbie Technical Report (PDF). Bureau of Meteorology (Report). March 2018. Retrieved 25 April 2018.
- Podlaha, Adam; Bowen, Steve; Darbinyan, Claire; Lörinc, Michal. "Global Catastrophe Recap – April 2017" (PDF). Aon Benfield Analytics. Retrieved 20 June 2017.
- "Cyclone "Cook" hits New Caledonia, leaving 1 dead, 20 000 without power". The Watchers. April 10, 2017.
- "'Crising' death toll in Cebu rises to 10". Philstar. April 17, 2017.
- "Capitol pegs Crising damage at P84.8M". Inquirer. April 25, 2017.
- "Maarutha makes landfall, weakens". The Global New Light of Myanmar. April 18, 2017.
- "Three Die in Cyclone Maarutha". Reliefweb. April 18, 2017.
- "4 killed as Cyclone Maarutha hits Irrawaddy Delta". May 31, 2017. Archived from the original on June 2, 2017. Retrieved June 1, 2017.
- "Damages reported in Temotu". Solomon Star. May 15, 2017. Archived from the original on May 16, 2017.
- "Cyclone Mora kills 9 in 4 districts". Dhaka Tribune. May 30, 2017.
- "Cyclone Mora Wreaks Devastation Along Myanmar's West Coast, Killing One". Radio Free Asia. May 31, 2017. Retrieved June 14, 2017.
- "Sri Lanka: UN agency deploys rapid assessment teams to assist in wake of monsoon floods, landslides". May 30, 2017.
- "EU announces €1.5 million in assistance to victims of Cyclone Mora in Bangladesh, Myanmar". May 31, 2017. Retrieved June 1, 2017.
- "Death toll up to 146 in Bangladesh landslides". Business Day. Agence France-Presse. June 14, 2017. Retrieved June 14, 2017.
- John P. Cangialosi (June 13, 2017). Tropical Weather Outlook (TXT) (Report). National Hurricane Center. Retrieved June 19, 2017.
- "5 still missing, 530 displaced one month after Kyushu's deadly rain". The Borneo Post. August 5, 2017.
- "One dead, 20,000 evacuated as tropical storm Nanmadol batters western Japan". Japan: Sun Daily. July 5, 2017.
- "Death toll from Kyushu rains hits 22 as searches, evacuations continue". Mainichi Daily News. Japan: The Mainichi. July 9, 2017. Retrieved July 10, 2017.
- "In Kyushu floods, destruction was magnified by fast-flowing driftwood". The Japan Times Online. The Japan Times. July 12, 2017.
- "gulftoday.ae – Tropical Storm Talas hits Vietnam, leaves one dead". gulftoday.ae. Archived from the original on 2017-07-17. Retrieved 2018-09-24.
- VnExpress. "9 dead or missing in Vietnam as infrastructure is damaged – VnExpress International".
- "In Pics: Flood Situation in Odisha worsens, four dead". hindustantimes.com/. 2017-07-19. Retrieved 2017-07-19.
- "Two killed as typhoon slams southern Japan". NewsComAu. Retrieved 2017-08-06.
- Martins, Daniel (August 7, 2017). "Deaths reported as weakening Noru slams Japan". The Weather Network. Retrieved 2017-09-12.
- "Sonca storm leaves ruinous signature". 28 July 2017. Retrieved 23 August 2017.
- Limited, Bangkok Post Public Company. "Worst floods in 2 decades hit Sakon Nakhon (Updated)". Retrieved 23 August 2017.
- "Thailand floods kill 23, cause damage estimated at $300 million". 3 August 2017 – via Reuters.
- "Agricultural losses from Typhoon Nesat exceed NT$60 million – Focus Taiwan".
- "16 dead, 20 lakh affected in West Bengal floods". July 28, 2017. Retrieved July 28, 2017.
- "Eight killed as heavy rains lash Jharkhand". hindusthantimes. July 28, 2017. Retrieved July 28, 2017.
- Richard J. Pasch; Andrew S. Latto; John P. Cangialosi (April 2, 2018). Tropical Storm Emily (PDF) (Report). Tropical Cyclone Report. National Hurricane Center. Retrieved April 8, 2018.
External links
Regional Specialized Meteorological Centers
- US National Hurricane Center – North Atlantic, Eastern Pacific
- Central Pacific Hurricane Center – Central Pacific
- Japan Meteorological Agency – NW Pacific
- India Meteorological Department – Bay of Bengal and the Arabian Sea
- Météo-France – La Reunion – South Indian Ocean from 30°E to 90°E
- Fiji Meteorological Service – South Pacific west of 160°E, north of 25° S
Tropical Cyclone Warning Centers
- Meteorology, Climatology, and Geophysical Agency of Indonesia – South Indian Ocean from 90°E to 141°E, generally north of 10°S
- Australian Bureau of Meteorology (TCWC's Perth, Darwin & Brisbane) – South Indian Ocean & South Pacific Ocean from 90°E to 160°E, generally south of 10°S
- Papua New Guinea National Weather Service – South Pacific Ocean from 141°E to 160°E, generally north of 10°S
- Meteorological Service of New Zealand Limited – South Pacific west of 160°E, south of 25°S
![]()