Supply-side economics
Supply-side economics is a macroeconomic theory arguing that economic growth can be most effectively created by lowering taxes and decreasing regulation,[1][2] by which it is directly opposed to demand-side economics. According to supply-side economics, consumers will then benefit from a greater supply of goods and services at lower prices and employment will increase.[3]
The Laffer curve, a theoretical relationship between rates of taxation and government revenue which suggests that lower tax rates when the tax level is too high will actually boost government revenue because of higher economic growth, is one of the main theoretical constructs of supply-side economics.[4][5][6]
The term "supply-side economics" was thought for some time to have been coined by journalist Jude Wanniski in 1975, but according to Robert D. Atkinson the term "supply side" was first used in 1976 by Herbert Stein (a former economic adviser to President Richard Nixon) and only later that year was this term repeated by Jude Wanniski.[7] Its use connotes the ideas of economists Robert Mundell and Arthur Laffer.
Historical origins

Supply-side economics developed in response to the stagflation of the 1970s.[8] It drew on a range of non-Keynesian economic thought, including the Chicago School and New Classical School.[9][10] Bruce Bartlett, an advocate of supply-side economics, traced the school of thought's intellectual descent from the philosophers Ibn Khaldun and David Hume, satirist Jonathan Swift, political economist Adam Smith and United States Secretary of the Treasury Alexander Hamilton.[11]
However, what most distinguishes supply-side economics as a modern phenomenon is its argument in favor of low tax rates primarily for collective and notably working-class reasons, rather than traditional ideological ones. Classical liberals opposed taxes because they opposed government, taxation being the latter's most obvious form. Their claim was that each man had a right to himself and his property and therefore taxation was immoral and of questionable legal grounding.[12] On the other hand, supply-side economists argued that the alleged collective benefit (i.e. increased economic output and efficiency) provided the main impetus for tax cuts.
As in classical economics, supply-side economics proposed that production or supply is the key to economic prosperity and that consumption or demand is merely a secondary consequence. Early on, this idea had been summarized in Say's Law of economics, which states: "A product is no sooner created, than it, from that instant, affords a market for other products to the full extent of its own value", or as John Maynard Keynes put it, "supply creates its own demand"[13]
Supply-side economics rose in popularity among Republican Party politicians from 1977 onwards. Prior to 1977, Republicans were more split on tax reduction, with some worrying that tax cuts would fuel inflation and exacerbate deficits.[14]
In 1978, Jude Wanniski published The Way the World Works in which he laid out the central thesis of supply-side economics[15] and detailed the failure of high tax rate progressive income tax systems and United States monetary policy under Richard Nixon and Jimmy Carter in the 1970s. Wanniski advocated lower tax rates and a return to some kind of gold standard, similar to the 1944–1971 Bretton Woods System that Nixon abandoned.
Laffer curve
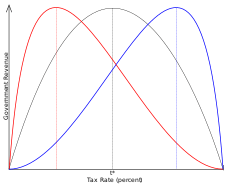
The Laffer curve embodies a postulate of supply-side economics: that tax rates and tax revenues are distinct, with government tax revenues the same at a 100% tax rate as they are at a 0% tax rate and maximum revenue somewhere in between these two values. Supply-siders argued that in a high tax rate environment lowering tax rates would result in either increased revenues or smaller revenue losses than one would expect relying on only static estimates of the previous tax base.[16][17]
This led supply-siders to advocate large reductions in marginal income and capital gains tax rates to encourage greater investment, which would produce more supply. Jude Wanniski and many others advocate a zero capital gains rate.[18][19] The increased aggregate supply should result in increased aggregate demand, hence the term "supply-side economics".
History
Reaganomics
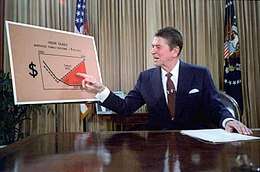
In the United States, commentators frequently equate supply-side economics with Reaganomics. The fiscal policies of Republican Ronald Reagan were largely based on supply-side economics. Reagan made supply-side economics a household phrase and promised an across-the-board reduction in income tax rates and an even larger reduction in capital gains tax rates.[20] During Reagan's 1980 presidential campaign, the key economic concern was double digit inflation, which Reagan described as "[t]oo many dollars chasing too few goods", but rather than the usual dose of tight money, recession and layoffs, with their consequent loss of production and wealth, he promised a gradual and painless way to fight inflation by "producing our way out of it".[21]
Switching from an earlier monetarist policy, Federal Reserve chair Paul Volcker began a policy of tighter monetary policies such as lower money supply growth to break the inflationary psychology and squeeze inflationary expectations out of the economic system.[22] Therefore, supply-side supporters argue that Reaganomics was only partially based on supply-side economics.
Congress under Reagan passed a plan that would slash taxes by $749 billion over five years. Critics claim that the tax cuts increased budget deficits while Reagan supporters credit them with helping the 1980s economic expansion that eventually lowered the deficits and argued that the budget deficit would have decreased if not for massive increases in military spending.[23] As a result, Jason Hymowitz cited Reagan—along with Jack Kemp—as a great advocate for supply-side economics in politics and repeatedly praised his leadership.[24]
Critics of Reaganomics claim it failed to produce much of the exaggerated gains some supply-siders had promised. Paul Krugman later summarized the situation: "When Ronald Reagan was elected, the supply-siders got a chance to try out their ideas. Unfortunately, they failed." Although he credited supply-side economics for being more successful than monetarism which he claimed "left the economy in ruins", he stated that supply-side economics produced results which fell "so far short of what it promised", describing the supply-side theory as "free lunches".[25]
Clinton years
President Clinton presided over the budgets for fiscal years 1994–2001. From 1998 to 2001, the budget was in a surplus for the first time since 1969. Economists Jeffrey Frankel and Peter Orszag summarized Clintonomics in a 2001 paper: "It sought to adopt some of the pro-market orientation associated with the ascendancy of the Republicans in the 1980s, and marry it with traditional Democratic values such as concern for the environment and a more progressive income distribution."[29]
Clinton signed the Omnibus Budget Reconciliation Act of 1993 into law, which raised income taxes rates on incomes above $115,000, created additional higher tax brackets for corporate income over $335,000, removed the cap on Medicare taxes, raised fuel taxes and increased the portion of Social Security income subject to tax, among other tax increases. Frankel and Orszag described the “progressive fiscal conservatism" of the 1993 package: "Such progressive fiscal conservatism combines modest attempts at redistribution (the progressive component) and budget discipline (the fiscal conservative component). Thus the 1993 package included significant spending reductions and tax increases. But it concentrated the tax increases on upper-income taxpayers, while substantially expanding the Earned Income Tax Credit, Head Start, and other government programs aimed at lower earners." President George H.W. Bush had raised marginal income tax rates in 1990.[29] The tax increases led to greater revenue (relative to a baseline without a tax increase).[30]
The bill was strongly opposed by Republicans, vigorously attacked by John Kasich and Minority Whip Newt Gingrich as destined to cause job losses and lower revenue.[31]
Economist Paul Krugman wrote in 2017 that Clinton's tax increases on the rich provided counter-example to the supply-side tax cut doctrine: "Bill Clinton provided a clear test, by raising taxes on the rich. Republicans predicted disaster, but instead the economy boomed, creating more jobs than under Reagan."[27]
Supply-side economist Alan Reynolds argued that the Clinton era represented a continuation of a low tax policy (from the 1980s):
In reality, tax policy was not unambiguously better in the eighties than in the nineties. The highest income tax rate was 50 percent from 1983 to 1986, but below 40 percent after 1993. And the capital gains tax was 28 percent from 1987 to [1997], but only 20 percent in the booming years of 1997-2000. On balance, there were good and bad things about both periods. But both the eighties and the nineties had much wiser tax policies than we had from 1968 to 1982.[32]
Kansas experiment
In May 2012, Sam Brownback, Governor of the state of Kansas, signed into law the "Kansas Senate Bill Substitute HB 2117",[33][34] which cut state income taxes deeply and was intended to generate rapid economic growth. The tax cuts have been called the "Kansas experiment",[35] and described as "one of the cleanest experiments for how tax cuts effect economic growth in the U.S."[36] The law cut taxes by US$231 million in its first year, and cuts were projected to total US$934 million after six years.[37] They eliminated taxes on "pass-through" income (used by sole proprietorships, partnerships, limited liability companies, subchapter S corporations,[35][34] for the owners of almost 200,000 businesses, and cut individual income tax rates as well.[37]
The original bill proposed by Brownback offset the losses expected to result from the cuts with increases in the state sales tax, as well as the elimination of numerous tax credits and deductions, but by the time the bill came to the governor to be signed these had been removed.[38] Brownback then argued that the cuts would pay for themselves by increasing revenue by boosting the state's economic growth.[39] Supporters pointed to projections from the conservative Kansas Policy Institute predicting that the bill would lead to a $323 million increase in tax revenue.[40]
Brownback forecast his cuts would create an additional 23,000 jobs in Kansas by 2020.[34] On the other hand, the Kansas Legislature's research staff warned of the possibility of a deficit of nearly US$2.5 billion by July 2018.[37] Brownback compared his tax cut policies with those of Ronald Reagan, but also described them as "a real live experiment ... We'll see how it works."[41] The cuts were based on model legislation published by the conservative American Legislative Exchange Council (ALEC),[42][43] and were supported by The Wall Street Journal,[44][45] supply-side economist Arthur Laffer,[46] and anti-tax leader Grover Norquist.[47]
By 2017, state revenues had fallen by hundreds of millions of dollars[48] causing spending on roads, bridges, and education to be slashed,[49][50] but instead of boosting economic growth, growth in Kansas remained consistently below average.[51] A working paper by two economists at Oklahoma State University (Dan Rickman and Hongbo Wang) using historical data from several other states with economies structured similarly to Kansas found that the Kansas economy grew about 7.8% less and employment about 2.6% less than it would have had Brownback not cut taxes.[52][53] In 2017, the Republican Legislature of Kansas voted to roll back the cuts, and after Brownback vetoed the repeal, overrode his veto.[54]
According to Max Ehrenfreund and economists he consulted, an explanation for the reduction instead of increase in economic growth from the tax cuts is that "any" benefits from tax cuts come over the long, not short run, but what does come in the short run is a major decline in demand for goods and services. In the Kansas economy cuts in state government expenditures cut incomes of state government "employees, suppliers and contractors" who spent much or most of their incomes locally.[52] In addition, concern over the state's large budget deficits "might have deterred businesses from making major new investments".[52]
Economist Paul Krugman wrote in 2017: "Sam Brownback, governor of Kansas, slashed taxes in what he called a “real live experiment” in conservative fiscal policy. But the growth he promised never came, while a fiscal crisis did. At the same time, Jerry Brown's California raised taxes, leading to proclamations from the right that the state was committing “economic suicide”; in fact, the state has experienced impressive employment and economic growth."[27]
Gov. Brownback himself strongly rejected criticism of his cuts or any need to adjust the law,[55] declaring the cuts a success, blaming perceptions to the contrary on a “rural recession,” and on “the left media" which "lies about the tax cuts all the time”.[50]
Trump tax cuts
President Trump implemented individual and corporate income tax cuts which took effect in 2018. Rutgers economics professor Farrokh Langdana claimed that the Trump tax cuts were an example of supply-side tax policy, citing a letter from economists long-associated with the supply-side theory describing them as such.[56]
The New York Times reported in November 2018 that the Trump tax overhaul "has fattened the paychecks of most American workers, padded the profits of large corporations and sped economic growth." Cautioning that "its still early but ten months after the law took effect, the promised 'supply side' bump is harder to find than the sugar-high stimulus." The writers explained that "It's highly unusual for deficits...to grow this much during periods of prosperity" and that "the fiscal health of the U.S. is deteriorating fast, as revenues have declined sharply" (nearly $200 billion or about 6%) relative to the CBO forecast prior to the tax cuts. Results included:
- Contrary to claims the tax cuts would pay for themselves, the budget deficit rose to $779 billion in fiscal year 2018, up 17% versus the prior year.
- Corporate tax revenues were down by one-third in fiscal year 2018.
- Stock buyback activity increased significantly.
- GDP growth, business investment and corporate profits increased.
- A typical worker in a large company got a $225 raise or one-time bonus, due to the law.
- Real wage growth (adjusted for inflation) was slightly slower in 2018 than 2017.[57]
Fiscal policy theory
Supply-side fiscal policies are designed to increase aggregate supply, as opposed to aggregate demand, thereby expanding output and employment while lowering prices. Such policies are of several general varieties:
- Investments in human capital, such as education, healthcare, and encouraging the transfer of technologies and business processes, to improve productivity (output per worker). Encouraging globalized free trade via containerization is a major recent example.
- Tax reduction, to provide incentives to work, invest and take risks. Lowering income tax rates and eliminating or lowering tariffs are examples of such policies.
- Investments in new capital equipment and research and development (R&D), to further improve productivity. Allowing businesses to depreciate capital equipment more rapidly (e.g., over one year as opposed to 10), encourages them to purchase such equipment.
- Reduction in government regulations, to encourage business formation and expansion.[58]
One benefit of such policies is that shifting the aggregate supply curve outward means prices can be lowered along with expanding output and employment. This is in contrast to demand-side policies (e.g., higher government spending), which even if successful tend to create inflationary pressures (i.e., raise the aggregate price level) as the aggregate demand curve shifts outward. Infrastructure investment is an example of a policy that has both demand-side and supply-side elements.[58]
Supply-side economics holds that increased taxation steadily reduces economic activity within a nation and discourages investment. Taxes act as a type of trade barrier or tariff that causes economic participants to revert to less efficient means of satisfying their needs. As such, higher taxation leads to lower levels of specialization and lower economic efficiency. The idea is said to be illustrated by the Laffer curve.[59]
Supply-side economists have less to say on the effects of deficits and sometimes cite Robert Barro’s work that states that rational economic actors will buy bonds in sufficient quantities to reduce long-term interest rates.[60]
Effect on economic growth and tax revenues
Many supply-side proponents argue that tax cuts can lead to increases in overall tax revenue because of the tax cuts' positive impact on economic growth[17] However, a 2012 survey of leading economists showed a consensus against the proposition that tax reductions would increase tax revenue in the United States.[62]
Some contemporary economists do not consider supply-side economics a tenable economic theory, with Alan Blinder calling it an "ill-fated" and perhaps "silly" school on the pages of a 2006 textbook.[63] Greg Mankiw, former chairman of President President George W. Bush's Council of Economic Advisers, offered similarly sharp criticism of the school in the early editions of his introductory economics textbook. "Tax cuts rarely pay for themselves. My reading of the academic literature leads me to believe that about one-third of the cost of a typical tax cut is recouped with faster economic growth."[64]
In a 1992 article for the Harvard International Review, James Tobin wrote: "The] idea that tax cuts would actually increase revenues turned out to deserve the ridicule."[65]
Karl Case and Ray Fair wrote in Principles of Economics, "The extreme promises of supply-side economics did not materialize. President Reagan argued that because of the effect depicted in the Laffer curve, the government could maintain expenditures, cut tax rates, and balance the budget. This was not the case. Government revenues fell sharply from levels that would have been realized without the tax cuts."[66]
Supply side proponents Trabandt and Uhlig argue that "static scoring overestimates the revenue loss for labor and capital tax cuts" and that "dynamic scoring" is a better predictor for the effects of tax cuts.[67]
A 1999 study by University of Chicago economist Austan Goolsbee, which examined major changes in high income tax rates in the United States from the 1920s onwards concluded that there only modest changes in the reported income of high-income individuals, indicating that the tax changes had little effect on how much people work.[68][69] He concluded that the notion that governments could raise more money by cutting rates "is unlikely to be true at anything like today's marginal tax rates."[68] In addition, some studies have shown that in the past several decades, tax cuts in the U.S. seldom recoup revenue losses and have minimal impact on GDP growth.[70][71][72][73]
A 2008 working paper found that in the case of Russia, "tax rate cuts can increase revenues by improving tax compliance."[74]
The New Palgrave Dictionary of Economics reports that estimates of revenue-maximizing tax rates have varied widely, with a mid-range of around 70%.[75] A 2012 survey found a consensus among leading economists that reducing the US federal income tax rate would raise GDP but would not increase tax revenue.[76] According to a 2012 study, "the U.S. marginal top [tax] rate is far from the top of the Laffer curve."[77]
John Quiggin distinguishes between the Laffer curve and Laffer's analysis of tax rates. The Laffer curve was "correct but unoriginal", but Laffer's analysis that the United States was on the wrong side of the Laffer curve "was original but incorrect."[78]
1920s tax cuts
Proponents of supply-side economics have sometimes cited tax cuts enacted in the 1920s as evidence that tax cuts can increase tax revenue. After World War I, the highest tax bracket, which was for those earning over $100,000 a year (worth at least $1 million a year now), was over 70 percent.[79] The revenue acts of 1921, 1924 and 1926 reduced this tax rate to less than 25 percent, yet tax revenues actually went up significantly.[80] Tax historian Joseph Thorndike argues that the tax cuts helped "bolster" growth but did not "cover the full cost of those tax cuts."[81]
According to a 1995 study, the tax reductions implemented in the 1920s reduced tax avoidance.[82] Gene Smiley at the Foundation for Economic Education explains: "The share of income taxes paid by the higher net income tax classes fell as tax rates were raised. With the reduction in rates in the twenties, higher-income taxpayers reduced their sheltering of income and the number of returns and share of income taxes paid by higher-income taxpayers rose".[83]
Revenue Act of 1964
Proponents of supply-side economics sometimes cite tax cuts enacted by President Lyndon B. Johnson with the Revenue Act of 1964. John F. Kennedy had the year prior advocated a drastic tax-rate cut in 1963 when the top income tax rate was 91%, arguing that "[t]ax rates are too high today and tax revenues too low, and the soundest way to raise revenues in the long run is to cut rates now".[84] The CBO concluded in 1978 that the tax cuts reduced tax revenue by $12 billion and that only between $3 billion to $9 million were recaptured due to bolstered economic growth. According to the CBO, "most of this rise [in revenues] was due to economic growth that would have taken place even without the tax cut."[81]
Reaganomics
Supply-siders justified Reagan's tax cuts during the 1980s by claiming they would result in net increases in tax revenue, yet tax revenues declined (relative to a baseline without the cuts) due to Reagan's tax cuts and the deficit ballooned during Reagan's term in office.[85][86][87][88] The Treasury Department studied the Reagan tax cuts and concluded they significantly reduced tax revenues relative to a baseline without them.[89] The 1990 budget by the Reagan administration concluded that the 1981 tax cuts had caused a reduction in tax revenue.[81]
Both CBO and the Reagan Administration forecast that individual and business income tax revenues would be lower if the Reagan tax cut proposals were implemented, relative to a policy baseline without those cuts, by about $50 billion in 1982 and $210 billion by 1986.[90] FICA tax revenue increased because in 1983 FICA tax rates were increased from 6.7% to 7% and the ceiling was raised by $2,100. For the self-employed, the FICA tax rate went from 9.35% to 14%.[91] The FICA tax rate increased throughout Reagan's term and rose to 7.51% in 1988 and the ceiling was raised by 61% through Reagan's two terms. Those tax hikes on wage earners, along with inflation, were the source of revenue gains in the early 1980s.[92]
It has been contended by some supply-side critics that the argument to lower taxes to increase revenues was a smokescreen for "starving" the government of revenues in the hope that the tax cuts would lead to a corresponding drop in government spending, but this did not turn out to be the case. Paul Samuelson called this notion "the tape worm theory—the idea that the way to get rid of a tape worm is [to] stab your patient in the stomach".[93]
There is frequent confusion on the meaning of the term "supply-side economics" between the related ideas of the existence of the Laffer Curve and the belief that decreasing tax rates can increase tax revenues. Many supply-side economists doubt the latter claim while still supporting the general policy of tax cuts. Economist Gregory Mankiw used the term "fad economics" to describe the notion of tax rate cuts increasing revenue in the third edition of his Principles of Macroeconomics textbook in a section entitled "Charlatans and Cranks":
An example of fad economics occurred in 1980, when a small group of economists advised Presidential candidate, Ronald Reagan, that an across-the-board cut in income tax rates would raise tax revenue. They argued that if people could keep a higher fraction of their income, people would work harder to earn more income. Even though tax rates would be lower, income would rise by so much, they claimed, that tax revenues would rise. Almost all professional economists, including most of those who supported Reagan's proposal to cut taxes, viewed this outcome as far too optimistic. Lower tax rates might encourage people to work harder and this extra effort would offset the direct effects of lower tax rates to some extent, but there was no credible evidence that work effort would rise by enough to cause tax revenues to rise in the face of lower tax rates. [...] People on fad diets put their health at risk but rarely achieve the permanent weight loss they desire. Similarly, when politicians rely on the advice of charlatans and cranks, they rarely get the desirable results they anticipate. After Reagan's election, Congress passed the cut in tax rates that Reagan advocated, but the tax cut did not cause tax revenues to rise.[94][95]
Clinton administration
Clinton signed the Omnibus Budget Reconciliation Act of 1993 into law, which raised income taxes rates on incomes above $115,000, created additional higher tax brackets for corporate income over $335,000, removed the cap on Medicare taxes, raised fuel taxes and increased the portion of Social Security income subject to tax, among other tax increases. CBO reported in 1999 that: "In the absence of changes in tax laws, total revenues tend to grow over a period of years at the same average rate as the economy. But 1998 marked the fifth consecutive year in which growth in revenues outstripped growth in national income. Tax increases enacted in 1993 helped boost revenues in 1994 and 1995, but rapid growth in taxes on capital gains realizations, increases in taxable incomes as a share of GDP, and other exceptional factors have driven the increases relative to GDP since then."[30] In 2008, the Center for American Progress compared economic and budgetary results from two supply-side periods (1981-1992 and 2001-2007), against the Clinton era (1993-2000) as a counter-example where tax rates were increased contrary to supply-side theory. In terms of growth in wages, real investment, and GDP, results were better during the Clinton era. While the tax cuts in the supply-side periods contributed to greater deficits, the tax increases of the Clinton era contributed to surpluses.[96]
Bush tax cuts
During his presidency, President Bush signed the Economic Growth and Tax Relief Reconciliation Act of 2001 and Jobs and Growth Tax Relief Reconciliation Act of 2003, which entailed significant tax cuts. In 2003, the Congressional Budget Office conducted a dynamic scoring analysis of tax cuts advocated by supply advocates, and found that the Bush tax cuts would not pay for themselves. Two of the nine models used in the study predicted a large improvement in the deficit over the next ten years resulting from tax cuts, but only by making the assumption that people would work harder from 2004 to 2014 because they believed that the tax cuts would go up again in 2014 and they wanted to make more money before the tax cuts expired.[97]
In 2006, the CBO released a study titled "A Dynamic Analysis of Permanent Extension of the President's Tax Relief".[98] This study found that under the best possible scenario making tax cuts permanent would increase the economy "over the long run" by 0.7%. Since the "long run" is not defined, some commentators[99] have suggested that 20 years should be used, making the annual best case GDP growth equal to 0.04%. When compared with the cost of the tax cuts, the best case growth scenario is still not sufficient to pay for the tax cuts. Previous official CBO estimates had identified the tax cuts as costing an amount equal to 1.4% of GDP. According to the study, if the best case growth scenario is applied, the tax cuts would still cost an amount equal to 1.27% of GDP.[99] This study was criticized by many economists, including Harvard Economics Professor Greg Mankiw, who pointed out that the CBO used a very low value for the earnings-weighted compensated labor supply elasticity of 0.14.[100] In a paper published in the Journal of Public Economics, Mankiw and Matthew Weinzierl noted that the current economics research would place an appropriate value for labor supply elasticity at around 0.5.[101]
The Congressional Budget Office (CBO) estimated that extending the Bush tax cuts beyond their 2010 expiration would increase the deficit by $1.8 trillion over 10 years.[102] The CBO also completed a study in 2005 analyzing a hypothetical 10% income tax cut and concluded that under various scenarios there would be minimal offsets to the loss of revenue. In other words, deficits would increase by nearly the same amount as the tax cut in the first five years with limited feedback revenue thereafter.[103]
According to an analysis by the Economic Policy Institute, the Bush tax cuts failed to promote growth since all macroeconomic growth indicators were well below average for the 2001–2005 business cycle. These critics argue the Bush tax cuts have done little more than deprive the government of revenue necessary to keep a balanced budget.[104]
Before President George W. Bush signed the 2003 tax cuts, the Economic Policy Institute (EPI) released a statement signed by ten Nobel prize laureates entitled "Economists' statement opposing the Bush tax cuts", which states:
Passing these tax cuts will worsen the long-term budget outlook, adding to the nation’s projected chronic deficits. This fiscal deterioration will reduce the capacity of the government to finance Social Security and Medicare benefits as well as investments in schools, health, infrastructure, and basic research. Moreover, the proposed tax cuts will generate further inequalities in after-tax income.[105]
Nobel laureate economist Milton Friedman agreed the tax cuts would reduce tax revenues and result in intolerable deficits, though he supported them as a means to restrain federal spending.[106] Friedman characterized the reduced government tax revenue as "cutting their allowance".
Trump tax cuts
Some proponents for the 2017 tax cuts implemented by the Trump administration argued that the tax cuts would be revenue neutral. Proponents argued this before the passage of the tax cuts and continued to argue that the tax cuts paid for themselves in the years subsequent to the tax cuts; the CBO estimated in 2017 that tax cuts would increase deficits, and analyses published in subsequent showed that the tax cuts did indeed increase deficits.[107][108][109] The New York Times reported in August 2019 that: "The increasing levels of red ink stem from a steep falloff in federal revenue after Mr. Trump’s 2017 tax cuts, which lowered individual and corporate tax rates, resulting in far fewer tax dollars flowing to the Treasury Department. Tax revenues for 2018 and 2019 have fallen more than $430 billion short of what the budget office predicted they would be in June 2017, before the tax law was approved that December."[110]
Effect on income inequality
Income inequality can be measured both pre- and after-tax. There is no consensus on the effects of income tax cuts on pre-tax income inequality, although one 2013 study indicated a strong correlation between how much top marginal tax rates were cut and greater pre-tax inequality across many countries.[111] However, an important side effect of income tax cuts in the U.S. is an increase in after-tax income inequality (other things equal), meaning the top earners receive a greater share of the after-tax income.[112] This is due to several tax policy factors:
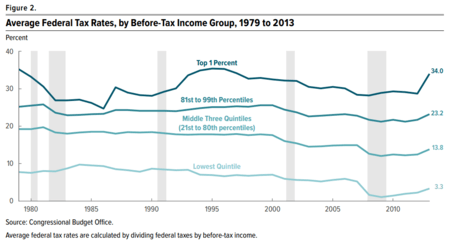
- Federal income taxes are progressive, meaning that higher income tax rates are levied on higher levels of income. For example, married couples filing jointly in 2017 pay a 25% tax rate on their income between $75,900 and $153,100, but 39.6% for income above $470,700.[113] This progressive policy meant the top 1% of income earners paid roughly 45% of the income taxes despite earning 17% of the pre-tax income in 2014.[114] So cutting income tax rates means relatively less is paid by higher-income households, leaving them with a greater share of the after-tax income.[112]
- Approximately 40-50% of American households do not pay federal income taxes, either because they do not earn sufficient income to pay federal income taxes or qualify for exclusions (e.g. many elderly households do not pay income taxes on their Social Security benefits). The percentage of households paying income taxes by age tends to rise into the prime working years (peaking at about 80% around age 50) and falls upon retirement.[115]
- Income taxes are distinct from payroll taxes, which all workers pay. In other words, a paycheck will have withdrawal amounts for payroll taxes (e.g. Social Security and Medicare) along with withdrawals for federal income taxes; some of the latter may be refunded when the annual tax return is filed. Payroll taxes are flat taxes (the same rate is levied) for salary and wage income up to a specific threshold ($127,400 in 2017).[116]
For example, the Tax Policy Center evaluated a detailed supply-side tax cut proposal from presidential candidate Jeb Bush in 2015. Their conclusion was that the proposal would both increase deficits dramatically and worsen after-tax income inequality.[117]
The combination of market forces driving pre-tax inequality combined with a reduction in marginal tax rates after 1979 resulted in the share of after-tax income received by the top 1% increasing from 7.4% to a peak of 16.7% in 2007 before falling to 12.4% in 2013. The tax increases effective in 2013 due to the expiration of the Bush tax cuts for income over $400,000 ($450,000 for couples filing jointly) along with other tax increases on high incomes related to the Patient Protection and Affordable Care Act (Obamacare) contributed to the decline in after-tax inequality, although they were not sufficient to offset the rise in inequality since 1979.[112]
Criticism
Critics of supply-side policies emphasize the growing federal deficits, increased income inequality and lack of growth.[119] They argue that the Laffer curve only measures the rate of taxation, not tax incidence, which may be a stronger predictor of whether a tax code change is stimulative or dampening.[120] David Harper claims that some economists dismiss the theory as offering "nothing particularly new or controversial as an updated view of classical economics".[121]
Writing in 2010, John Quggin said, "To the extent that there was an economic response to the Reagan tax cuts, and to those of George W. Bush twenty years later, it seems largely to have been a Keynesian demand-side response, to be expected when governments provide households with additional net income in the context of a depressed economy."[78]
Cutting marginal tax rates can also be perceived as primarily beneficial to the wealthy, which some see as politically rather than economically motivated:[122]
The specific set of foolish ideas that has laid claim to the name "supply side economics" is a crank doctrine that would have had little influence if it did not appeal to the prejudices of editors and wealthy men.
— Paul Krugman[123]
Mr. David Stockman has said that supply-side economics was merely a cover for the trickle-down approach to economic policy—what an older and less elegant generation called the horse-and-sparrow theory: If you feed the horse enough oats, some will pass through to the road for the sparrows.
— John Kenneth Galbraith[124]
See also
Notes and references
- Neva Goodwin; Jonathan M. Harris; Julie A. Nelson; Brian Roach; Mariano Torras (March 4, 2015). Principles of Economics in Context. Routledge. p. 286. ISBN 978-1-317-46217-0.
supply-side-economics: the macroeconomic theory [...]
- Dwivedi (2010). Macroeconomics, 3E. Tata McGraw-Hill Education. p. 372. ISBN 978-0-07-009145-0.
The supply-side economics is the most recent macroeconomic thought.
- Wanniski, Jude (1978). The Way the World Works: How Economies Fail—and Succeed. New York: Basic Books. ISBN 0-465-09095-8.
- Kyer, Ben L.; Maggs, Gary E. (1994). "A Macroeconomic Approach to Teaching Supply-Side Economics". The Journal of Economic Education. 25 (1): 44–48. doi:10.2307/1182895. ISSN 0022-0485.
- Kolb, Robert W. (March 27, 2018). The SAGE Encyclopedia of Business Ethics and Society. SAGE Publications. p. 3303. ISBN 978-1-4833-8151-0.
- Mankiw, N. Gregory (January 1, 2020). Principles of Economics. Cengage Learning. pp. 161–162. ISBN 978-0-357-13380-4.
- Robert D. Atkinson (October 29, 2007). Supply-Side Follies: Why Conservative Economics Fails, Liberal Economics Falters, and Innovation Economics Is the Answer. Rowman & Littlefield. p. 50. ISBN 978-0-7425-5107-7.
- Case, Karl E. & Fair, Ray C. (1999). Principles of Economics (5th ed.), p. 780. Prentice-Hall. ISBN 0-13-961905-4.
- Schmidt, I.; Rittaler, J. B. (February 28, 1989). A Critical Evaluation of the Chicago School of Antitrust Analysis. Springer Science & Business Media. ISBN 9789024737925 – via Google Books.
- Gandhi, Mr Ved P.; Ebrill, Mr Liam P.; Shome, Mr Parthasrathi; Anton, Mr Luis A. Manas; Modi, Jitendra R.; Sanchez-Ugarte, Mr Fernando J.; Mackenzie, Mr G. A. (June 15, 1987). Supply-Side Tax Policy: Its Relevance to Developing Countries. International Monetary Fund. ISBN 9781455271962 – via Google Books.
- Bartlett, Bruce. "Supply-Side Economics: "Voodoo Economics" or Lasting Contribution?" (PDF). Laffer Associates: Supply-Side Investment Research (November 11, 2003). Retrieved November 17, 2008.
- Gray, pp. 26–7 Liberalism. Minneapolis: University of Minnesota Press, 1995. ISBN 0-8166-2801-7
- Malabre Jr., Alfred L. (1994). Lost Prophets: An Insider's History of the Modern Economists, p. 182. Harvard Business School Press. ISBN 0-87584-441-3.
- Burns, John W.; Taylor, Andrew J. (2000). "The Mythical Causes of the Republican Supply-Side Economics Revolution". Party Politics. 6 (4): 419–440. doi:10.1177/1354068800006004002. ISSN 1354-0688.
- Gross, Neil; Medvetz, Thomas; Russell, Rupert (August 11, 2011). "The Contemporary American Conservative Movement". Annual Review of Sociology. 37 (1): 325–354. doi:10.1146/annurev-soc-081309-150050. ISSN 0360-0572.
Jude Wanniski, who wrote the supply-side economics bible, The Way the World Works (1978), while an AEI scholar-in-residence
- Laffer, Arthur (June 1, 2004). "The Laffer Curve, Past, Present and Future". The Heritage Foundation. Retrieved December 11, 2007.
- Bartlett, Bruce (April 6, 2007). "How Supply-Side Economics Trickled Down". New York Times.
- Wanniski, Jude "Taxing Capital Gains" Archived May 2, 2014, at the Wayback Machine
- Alan Reynolds (July 1999). "Capital gains tax: Analysis of reform options for Australia" (PDF). Hudson Institute. Archived from the original (PDF) on July 18, 2005.
- (Karl Case ad Ray Fair, 1999: pp. 781–2).
- Case & Fair, pp. 781–2.
- Malabre, Jr., pp. 170–1.
- "Busting the Left's myths about Reaganomics". CapX. June 22, 2017.
- Malabre, Jr., p. 188.
- Malabre, Jr., p. 195.
- "The Distribution of Household Income and Federal Taxes, 2010". The US Congressional Budget Office (CBO). December 4, 2013. Retrieved January 6, 2014.
- "Zombies of Voodoo Economics". nytimes.com. April 24, 2017. Retrieved March 6, 2020.
- "Twitter post: Tax rate chart". Paul Krugman. April 22, 2017. Retrieved March 6, 2020.
- "Retrospective on American Economic Policy in the 1990s". brookings.edu. November 2, 2001.
- "The Economic and Budget Outlook: Fiscal years 2000-2009" (PDF). cbo.gov. January 1999.
- Kornacki, Steve (April 19, 2011). "The decade the GOP hopes you've forgotten". Salon. Retrieved December 22, 2018.
- "Supply Side Economics After 30 years, Presentation at Vanderbilt University". Research Gate. 23 January 2003. Retrieved 5 March 2020.
- "Senate Substitute for HB 2117 by Committee on Taxation -- Reduction of income tax rates for individuals and determination of income tax credits; severance tax exemptions; homestead property tax refunds; food sales tax refunds". Retrieved October 29, 2014.
- "Kansas small-business owners say elimination of income tax is a big help". The Wichita Eagle. May 24, 2012.
- HOBSON, JEREMY; RUSSELL, DEAN; RAPHELSON, SAMANTHA (October 25, 2017). "As Trump Proposes Tax Cuts, Kansas Deals With Aftermath Of Experiment". NPR. Retrieved November 20, 2018.
- Gale, William G. (July 11, 2017). "The Kansas tax cut experiment". Brookings Institution. Retrieved November 20, 2018.
- "Brownback Signs Tax Cuts Law In Statehouse Ceremony". KAKE News. Archived from the original on October 29, 2014. Retrieved October 29, 2014.
- Williamson, Kevin D. (May 3, 2016). "Starving the Beast in Kansas". National Review. Retrieved October 10, 2016.
- Caldwell, Patrick (May 4, 2016). "Trickle-Down Economics Has Ruined the Kansas Economy". Mother Jones. Retrieved October 10, 2016.
- Levitz, Eric (March 18, 2016). "The Republican Party Must Answer for What It Did to Kansas and Louisiana". New York Magazine. Retrieved October 10, 2016.
- "Brownback gets heat for 'real live experiment' comment on tax cuts". Lawrence Journal World. Retrieved October 28, 2014.
- Rothschild, Scott (December 17, 2013). "Brownback says perception of ALEC influence is 'overblown'". Lawrence Journal-World.
- Pilkington, Ed (November 20, 2013). "Obamacare faces new threat at state level from corporate interest group Alec". The Guardian.
- Brownback, Sam. "A Midwest Renaissance Rooted in the Reagan Formula". Retrieved October 28, 2014.
- Cooper, Brad (May 23, 2012). "Brownback signs big tax cut in Kansas". Kansas City Star. Retrieved October 10, 2016.
- Josh Barro (June 27, 2014). "Yes, if You Cut Taxes, You Get Less Tax Revenue". The New York Times. Retrieved September 2, 2014.
- "Norquist defends tax cuts despite Brownback woes in Kansas". The Hill. Retrieved October 29, 2014.
- Casselman, Ben; Koerth-Baker, Maggie; Barry-Jester, Anna Maria; Cheng, Michelle (June 9, 2017). "The Kansas Experiment Is Bad News For Trump's Tax Cuts". FiveThirtyEight. FiveThirtyEight. Retrieved October 4, 2017.
- "Kansas Legislature approves budget deal, after lawmakers deliver blistering critiques of state finances," Archived October 4, 2017, at the Wayback Machine May 2, 2016, Topeka Capital-Journal
- "Kansas Republicans Sour on Their Tax-Cut Experiment" February 24, 2017, The Atlantic
- Gleckman, Howard (June 7, 2017). "The Great Kansas Tax Cut Experiment Crashes And Burns". Forbes. Retrieved November 20, 2018.
- Ehrenfreund, Max (June 15, 2017). "Wonkblog. Kansas's conservative experiment may have gone worse than people thought". Washington Post. Retrieved November 22, 2018.
- Rickman, Dan S., Dan S.; Wang, Hongbo (June 9, 2017). "Two Tales of Two U.S. States: Regional Fiscal Austerity and Economic Performance". Munich Personal RePEc Archive. Retrieved November 22, 2018.
- Berman, Russell (June 7, 2017). "The Death of Kansas's Conservative Experiment". The Atlantic. Retrieved June 7, 2017.
- LOWRY, BRYAN; WISE, LINDSAY; WOODALL, HUNTER; SHORMAN, JONATHAN (January 24, 2018). "Brownback, confirmed in dramatic D.C. vote, leaves legacy of controversy in Kansas". Kansas City Star. Retrieved November 29, 2018.
- "Supply-side economic theory powers Trump tax plan". Rutgers Business School-Newark and New Brunswick.
- Tankersley, Jim; Phillips, Matt (November 12, 2018). "Trump's Tax Cut Was Supposed to Change Corporate Behavior. Here's What Happened" – via NYTimes.com.
- Chiang, Eric (2014). CoreMacroeconomics 3rd ed. Worth Publishers. p. 245. ISBN 978-1-4292-7849-2.
- (Karl Case and Ray Fair, 1999: pp. 780–1).
- Reynolds, Alan. "The "Conventional" Hypothesis: Deficit Estimates, Savings Rates, Twin Deficits and Yield Curves" (PDF). Cato Institute. Archived from the original (PDF) on August 6, 2009. Retrieved October 19, 2010.
- "Tax Cuts for Job Creators". The New York Times. October 19, 2012.
- "Laffer Curve". IMG Forum. University of Chicago Booth School of Business. Retrieved June 15, 2015.
- Blinder, A. S. (2006). "Can fiscal policy improve macro-stabilization". In Kopcke, E.; Tootell, G. M. B.; Triest, R. K. (eds.). The macroeconomics of fiscal policy. Cambridge, MA: MIT Press. pp. 23–62. ISBN 0-262-11295-7.
- Mankiw, N. Gregory (June 2, 2017). "A Tax Cut Might Be Nice. But Remember the Deficit". The New York Times.
- Tobin, J. (1992). "Voodoo curse". Harvard International Review. 14 (4): 10.
- Case, K. E.; Fair, R. C. (2007). Principles of Economics (8th ed.). Upper Saddle Rive, NJ: Prentice Hall. ISBN 978-0-13-228914-6.
- "Microsoft Word – SFB DP Frontpage.doc" (PDF).
- Goolsbee, Austan (1999). "Evidence on the High-Income Laffer Curve from Six Decades of Tax Reform". Brookings Papers on Economic Activity. 1999 (2): 1. doi:10.2307/2534678. ISSN 0007-2303.
- "A new crop of candidates discovers the father of supply side economics". The Washington Post. 2015.
- Tax Cuts: Myths and Realities, Center on Budget and Policy Priorities, May 9, 2008, retrieved August 26, 2016
- Furman, Jason (August 24, 2006), Treasury Dynamic Scoring Analysis Refutes Claims by Supporters of the Tax Cuts, Center on Budget and Policy Priorities, retrieved August 26, 2016
- Barro, Josh (March 17, 2015). "Tax Cuts Still Don't Pay for Themselves". The New York Times. ISSN 0362-4331. Retrieved August 26, 2016.
- Gale, William G.; Samwick, Andrew A. (September 9, 2014), Effects of Income Tax Changes on Economic Growth (PDF), Brookings Institution, retrieved August 26, 2016
- Papp, TK & Takáts, E. "Tax rate cuts and tax compliance—the Laffer curve revisited" (PDF). IMF Working Paper. Cite journal requires
|journal=(help) - Fullerton, Don (2008). "Laffer curve". In Durlauf, Steven N.; Blume, Lawrence E. (eds.). The New Palgrave Dictionary of Economics (2nd ed.). p. 839. doi:10.1057/9780230226203.0922. ISBN 978-0-333-78676-5.
- "Laffer Curve | IGM Forum". www.igmchicago.org. Retrieved October 14, 2017.
- Saez, Emmanuel; Slemrod, Joel; Giertz, Seth H. (2012). "The Elasticity of Taxable Income with Respect to Marginal Tax Rates: A Critical Review". Journal of Economic Literature. 50 (1): 3–50. doi:10.1257/jel.50.1.3. ISSN 0022-0515. JSTOR 23269968.
- Quiggin, John (May 21, 2012). Zombie Economics. Princeton University Press. p. 142. doi:10.2307/j.ctt7rg7m. ISBN 978-1-4008-4208-7.
- March 4, Veronique de Rugy; 2003 (March 4, 2003). "1920s Income Tax Cuts Sparked Economic Growth and Raised Federal Revenues". Cato Institute.CS1 maint: numeric names: authors list (link)
- Mitchell, Daniel. "The Heritage Foundation". The Heritage Foundation.
- "History lesson: Do big tax cuts pay for themselves?". The Washington Post. 2017.
- Smiley, Gene; Keehn, Richard H. (1995). "Federal Personal Income Tax Policy in the 1920s". The Journal of Economic History. 55 (2): 285–303. doi:10.1017/S0022050700041061. ISSN 1471-6372.
- Smiley, Gene (October 1, 1996). "Cutting Marginal Tax Rates: Evidence from the 1920s - Gene Smiley". fee.org.
- "Tax Cuts, King Dollar & Growth: From JFK to Reagan to Trump". September 16, 2016.
- "Can countries lower taxes and raise revenues?". The Economist. ISSN 0013-0613. Retrieved June 13, 2020.
- "How the GOP tax overhaul compares to the Reagan-era tax bills". PBS NewsHour. December 4, 2017. Retrieved June 13, 2020.
- "How Reagan's Tax Cuts Fared". NPR.org. Retrieved June 14, 2020.
- Narizny, Kevin (2003). "Both Guns and Butter, or Neither: Class Interests in the Political Economy of Rearmament". American Political Science Review. 97 (2): 203–220. doi:10.1017/S0003055403000625. ISSN 1537-5943.
[Reagan] proposed a new paradigm, supply-side economics, that promised to increase revenue by decreasing taxes (Hibbs 1987, 280–87, 296– 326). Despite its questionable logic, the sheer novelty of the idea gave Reagan greater leeway in budgetary politics than the public normally would have accepted (Modigliani and Modigliani 1987; Peterson 1985)... He had only a brief window of opportunity before supply-side economics was discredited by staggering budget deficits
- Treasury Department (September 2006) [2003]. "Revenue Effects of Major Tax Bills" (PDF). United States Department of the Treasury. Working Paper 81, Table 2. Retrieved November 28, 2007. Cite journal requires
|journal=(help) - "An Analysis of President Reagan's Budget Revisions for Fiscal Year 1982-See Table 4" (PDF). cbo.gov. March 25, 1981.
- "Annual maximum taxable earnings and contribution rates" (PDF). Social Security Administration.
- The Reagan Tax Cuts: Lessons for Tax Reform – Joint Economic Committee Archived February 26, 2009, at the Wayback Machine
- Malabre, Jr., pp. 197–8.
- Scheiber, Noam (2004-04-08). "Can Greg Mankiw Survive Politics?". The New Republic. Archived from the original on 2008-04-23.
- Moore, Stephen (February 28, 2003). "Think Twice About Gregory Mankiw". National Review.
- "Take a Walk on the Supply Side". americanprogress.org. September 12, 2008.
- `Dynamic' Scoring Finally Ends Debate On Taxes, Revenue. By Alan Murray. Wall Street Journal. (Eastern edition). New York, N.Y.: April 1, 2003. p. A.4
- Microsoft Word – treasury dyn anal report jul 24 10am II FINAL.doc Archived July 14, 2007, at the Wayback Machine
- "Treasury Dynamic Scoring Analysis Refutes Claims by Supporters of the Tax Cuts - Center on Budget and Policy Priorities". November 17, 2008.
- "Greg Mankiw's Blog: CBO on Supply-side Economics".
- "Journal of Public Economics : Dynamic scoring: A back-of-the-envelope guide" (PDF). Journal of Public Economics. 90: 1415–1433. doi:10.1016/j.jpubeco.2005.11.006.
- "An Analysis of the President's Budgetary Proposals for Fiscal Year 2008" (PDF). March 21, 2007.
- "Analyzing the Economic and Budgetary Effects of a 10 Percent Cut in Income Tax Rates" (PDF). December 1, 2005.
- The boom that wasn't Archived December 29, 2007, at the Wayback Machine
- "Economists' statement opposing the Bush tax cuts (2003)".
- Friedman, Milton (January 15, 2003). "What Every American Wants". Wall Street Journal.
- Pramuk, Jacob (November 8, 2017). "GOP tax cut plan would add $1.7 trillion to the deficit, CBO projects". CNBC. Retrieved June 16, 2020.
- Gore, D'Angelo (August 2, 2018). "CBO Didn't Say Tax Cuts Were 'Virtually Paid For'". FactCheck.org. Retrieved June 16, 2020.
- Kiely, Eugene (March 12, 2019). "Larry Kudlow's Revenue Deception". FactCheck.org. Retrieved June 16, 2020.
- Tankersley, Jim; Cochrane, Emily (August 21, 2019). "Deficit Will Reach $1 Trillion Next Year, Budget Office Predicts" – via NYTimes.com.
- Weissmann, Jordan (May 30, 2013). "Study: Tax Cuts Might Drive Income Inequality After All". The Atlantic.
- "The Distribution of Household Income and Federal Taxes, 2013 - Congressional Budget Office". www.cbo.gov.
- Pomerleau, Kyle (November 10, 2016). "2017 Tax Brackets - Center for Federal Tax Policy".
- Frank, Robert (April 14, 2015). "Top 1% pay nearly half of federal income taxes". CNBC.
- Washington Post-Brad Plumer-Who doesn't pay taxes, in eight charts-September 18, 2012
- "Social Security Administration Fact Sheet-2017 Social Security Changes" (PDF).
- Washington Post-Jared Bernstein-Bush tax cut plan loses trillions and worsens inequality-December 11,2015
- Optimal Taxation of Top Labor Incomes: A Tale of Three Elasticities Thomas Piketty, Emmanuel Saez, Stefanie Stantcheva, NBER, Nov. 2011
- Gale, W. G. & Orszag, P. R. (May 9, 2003). "Bush's Tax Plan Slashes Growth". The Brookings Institution. Retrieved October 23, 2007.
- Holter; et al. (November 2014). "How Does Tax Progressivity and Household Heterogeneity Affect Laffer Curves?" (PDF). Penn Institute for Economic Research. Centre for Economic Policy Research. Retrieved July 29, 2015. Cite journal requires
|journal=(help) - Harper, David. "Understanding Supply-Side Economics".
- Krugman, Paul (December 23, 2005). "The Tax Cut Zombies". New York Times.
- Krugman, Paul R. (2009). The Return Of Depression Economics And The Crisis Of 2008. W.W. Norton. p. 192. ISBN 978-0-393-07101-6.
- Galbraith, John Kenneth (1982-02-04). "Recession Economics". New York Review of Books.
External links
- Sowell, Thomas. "Trickle Down" Theory and "Tax Cuts for the Rich".
- Gwartney, James D. (2008). "Supply-Side Economics". In David R. Henderson (ed.). Concise Encyclopedia of Economics (2nd ed.). Indianapolis: Library of Economics and Liberty. ISBN 978-0865976658. OCLC 237794267.
- "Portion of Mundell's Nobel Prize Lecture" (awarded for unrelated work in optimum currency area). Claiming that supply side economics was responsible for growth, price stability and the collapse of the Soviet Union.
- "Supply Side Library". A collection of essays and studies by Robert Mundell, Paul Craig Roberts, Stephen Entin and Alan Reynolds.