San Andreas, California
San Andreas is an unincorporated census-designated place and the county seat of Calaveras County, California. The population was 2,783 at the 2010 census, up from 2,615 at the 2000 census. Like most towns in the region, it was founded during the California Gold Rush. The town is located on State Route 49 and is registered as California Historical Landmark #252.[3]
San Andreas | |
|---|---|
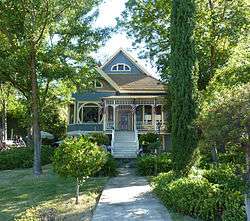
 Main Street | |
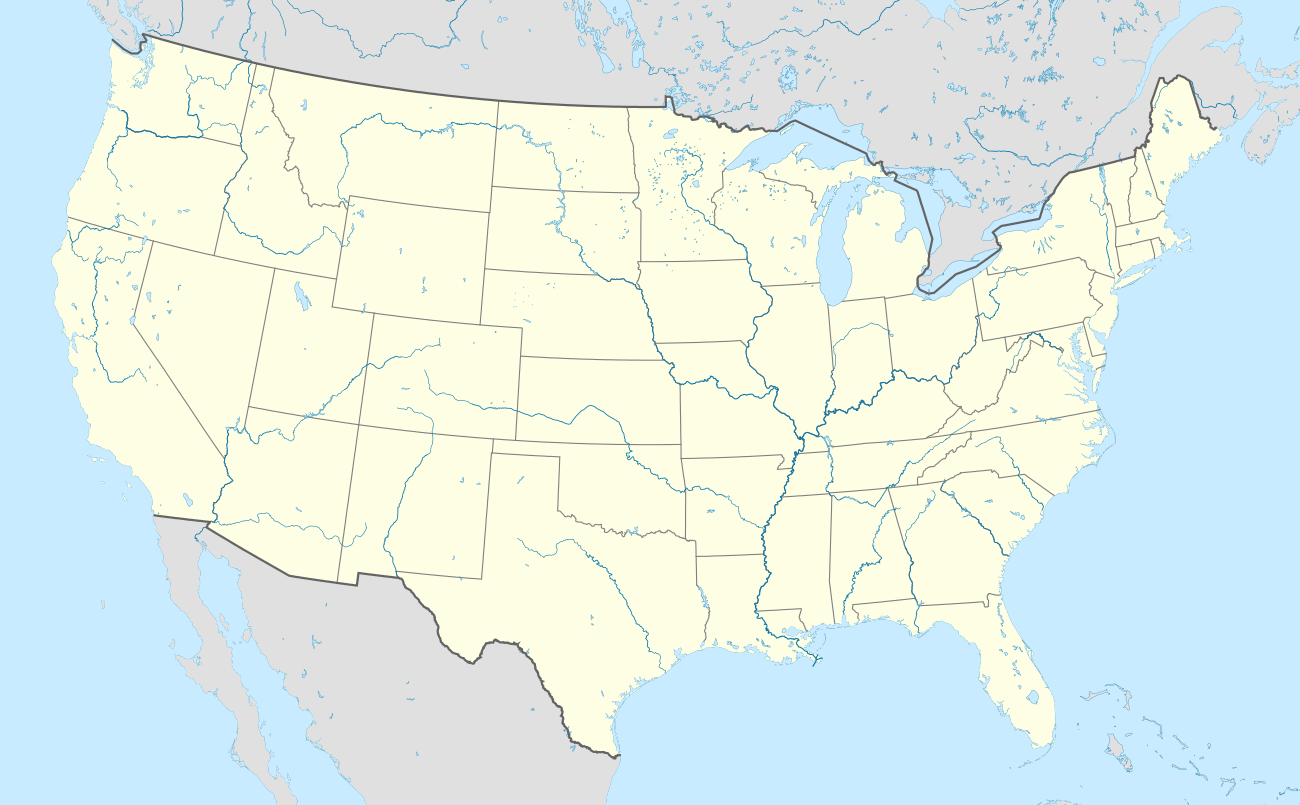 San Andreas Location in the United States | |
| Coordinates: 38°11′46″N 120°40′50″W | |
| Country | |
| State | |
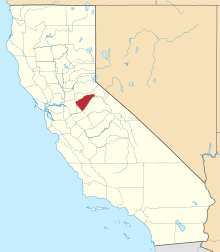
| County | Calaveras |
| Area | |
| • Total | 8.394 sq mi (21.741 km2) |
| • Land | 8.378 sq mi (21.700 km2) |
| • Water | 0.016 sq mi (0.041 km2) 0.19% |
| Elevation | 926 ft (268 m) |
| Population (2010) | |
| • Total | 2,783 |
| • Density | 330/sq mi (130/km2) |
| Time zone | UTC-8 (Pacific (PST)) |
| • Summer (DST) | UTC-7 (PDT) |
| ZIP codes | 95249-95250 |
| Area code(s) | 209 |
| FIPS code | 06-64420 |
| GNIS feature IDs | 277590, 2409247 |
| Reference no. | 252 |
History

Settled by Mexican gold miners in 1848 and named after the Catholic parish St. Andrew, the town has been a noted mining camp since early days. The gold from the initially discovered placers gave out after a few years, but the discovery of gold in an underground river channel in 1853 revitalized the camp and it soon became a town. Mining of the channels was lucrative enough for the town to completely rebuild after fires in 1858 and 1863. The gold discovered here contributed greatly to the success of the Union during the Civil War. In 1866, San Andreas became the seat of Calaveras County. It was said to be a rendezvous location for Joaquin Murrieta. Notorious highwayman Black Bart was tried here and sent to prison.
The post office was established in 1854.[4]
Geography
According to the United States Census Bureau, the CDP has a total area of 8.4 square miles (22 km2), of which, 99.81% is land and 0.19% is water.
Climate
San Andreas has a Mediterranean climate typical of the Sierra Nevada foothills. Winters are cool and wet with mild days, chilly nights, and substantial rainfall. Summers are hot and dry with very hot days, cool nights, and minimal rainfall. Due to the orographic effect, rainfall in all seasons is significantly greater than on the valley floor to the west.
| Climate data for United States | |||||||||||||
|---|---|---|---|---|---|---|---|---|---|---|---|---|---|
| Month | Jan | Feb | Mar | Apr | May | Jun | Jul | Aug | Sep | Oct | Nov | Dec | Year |
| Average high °F (°C) | 55.5 (13.1) |
60.3 (15.7) |
64.7 (18.2) |
69.6 (20.9) |
79.1 (26.2) |
88.0 (31.1) |
94.9 (34.9) |
94.0 (34.4) |
88.7 (31.5) |
78.6 (25.9) |
64.8 (18.2) |
55.7 (13.2) |
74.5 (23.6) |
| Daily mean °F (°C) | 46.0 (7.8) |
49.7 (9.8) |
53.0 (11.7) |
56.5 (13.6) |
64.0 (17.8) |
71.1 (21.7) |
76.9 (24.9) |
77.0 (25.0) |
72.4 (22.4) |
63.8 (17.7) |
53.3 (11.8) |
46.2 (7.9) |
60.8 (16.0) |
| Average low °F (°C) | 36.6 (2.6) |
39.0 (3.9) |
41.3 (5.2) |
43.4 (6.3) |
48.9 (9.4) |
54.2 (12.3) |
59.0 (15.0) |
59.9 (15.5) |
56.1 (13.4) |
48.9 (9.4) |
41.7 (5.4) |
36.7 (2.6) |
47.2 (8.4) |
| Average precipitation inches (mm) | 5.34 (136) |
5.15 (131) |
4.41 (112) |
2.13 (54) |
1.15 (29) |
0.27 (6.9) |
0.04 (1.0) |
0.07 (1.8) |
0.35 (8.9) |
1.50 (38) |
2.82 (72) |
4.21 (107) |
27.45 (697) |
| Average relative humidity (%) | 74.6 | 70.0 | 66.6 | 59.4 | 51.4 | 43.5 | 38.6 | 38.2 | 39.4 | 46.9 | 63.4 | 72.6 | 55.4 |
| Source: PRISM Climate Group[5] | |||||||||||||
Demographics
2010
At the 2010 census San Andreas had a population of 2,783. The population density was 331.5 people per square mile (128.0/km²). The racial makeup of San Andreas was 2,453 (88.1%) White, 23 (0.8%) African American, 48 (1.7%) Native American, 28 (1.0%) Asian, 1 (0.0%) Pacific Islander, 83 (3.0%) from other races, and 147 (5.3%) from two or more races. Hispanic or Latino of any race were 255 people (9.2%).[6]
The census reported that 2,595 people (93.2% of the population) lived in households, 21 (0.8%) lived in non-institutionalized group quarters, and 167 (6.0%) were institutionalized.
There were 1,146 households, 314 (27.4%) had children under the age of 18 living in them, 449 (39.2%) were opposite-sex married couples living together, 156 (13.6%) had a female householder with no husband present, 66 (5.8%) had a male householder with no wife present. There were 91 (7.9%) unmarried opposite-sex partnerships, and 13 (1.1%) same-sex married couples or partnerships. 396 households (34.6%) were one person and 190 (16.6%) had someone living alone who was 65 or older. The average household size was 2.26. There were 671 families (58.6% of households); the average family size was 2.84.
The age distribution was 585 people (21.0%) under the age of 18, 197 people (7.1%) aged 18 to 24, 589 people (21.2%) aged 25 to 44, 777 people (27.9%) aged 45 to 64, and 635 people (22.8%) who were 65 or older. The median age was 45.7 years. For every 100 females, there were 88.6 males. For every 100 females age 18 and over, there were 85.0 males.
There were 1,311 housing units at an average density of 156.2 per square mile (60.3/km²),of which 1,146 were occupied, 632 (55.1%) by the owners and 514 (44.9%) by renters. The homeowner vacancy rate was 1.9%; the rental vacancy rate was 13.3%. 1,404 people (50.4% of the population) lived in owner-occupied housing units and 1,191 people (42.8%) lived in rental housing units.
2000

At the 2000 census there were 2,615 people, 1,097 households, and 652 families in the CDP. The population density was 299.4 people per square mile (115.5/km²). There were 1,167 housing units at an average density of 133.6 per square mile (51.6/km²). The racial makeup of the CDP was 92.1% White, 0.1% Black or African American, 1.5% Native American, 0.7% Asian, 2.0% from other races, and 3.6% from two or more races. 6.4% of the population were Hispanic or Latino of any race.[7] Of the 1,097 households 28.0% had children under the age of 18 living with them, 41.9% were married couples living together, 13.8% had a female householder with no husband present, and 40.5% were non-families. 34.2% of households were one person and 18.4% were one person aged 65 or older. The average household size was 2.24 and the average family size was 2.85.
The age distribution was 24.2% under the age of 18, 7.6% from 18 to 24, 21.6% from 25 to 44, 22.6% from 45 to 64, and 23.9% 65 or older. The median age was 43 years. For every 100 females, there were 89.8 males. For every 100 females age 18 and over, there were 81.9 males.
The median household income was $32,500 and the median family income was $37,969. Males had a median income of $39,583 versus $24,500 for females. The per capita income for the CDP was $16,813. About 14.4% of families and 14.8% of the population were below the poverty line, including 19.5% of those under age 18 and 8.9% of those age 65 or over.
Politics
In the state legislature, San Andreas is in the 8th Senate District, represented by Republican Andreas Borgeas,[8] and the 5th Assembly District, represented by Republican Frank Bigelow.[9] Federally, San Andreas is in California's 4th congressional district, represented by Republican Tom McClintock.[10]
References
- "2010 Census U.S. Gazetteer Files – Places – California". United States Census Bureau.
- "San Andreas". Geographic Names Information System. United States Geological Survey. Retrieved January 8, 2015.
- "San Andreas". Office of Historic Preservation, California State Parks. Retrieved 2012-10-06.
- Durham, David L. (1998). California's Geographic Names: A Gazetteer of Historic and Modern Names of the State. Clovis, Calif.: Word Dancer Press. p. 824. ISBN 1-884995-14-4.
- "PRISM Climate Group". Oregon State University. Retrieved June 25, 2020. Input coordinates: 38.1987 N, 120.6835 W.
- "2010 Census Interactive Population Search: CA - San Andreas CDP". U.S. Census Bureau. Archived from the original on July 15, 2014. Retrieved July 12, 2014.
- "U.S. Census website". United States Census Bureau. Retrieved 2008-01-31.
- "Senators". State of California. Retrieved March 21, 2013.
- "Members Assembly". State of California. Retrieved March 21, 2013.
- "California's 4th Congressional District - Representatives & District Map". Civic Impulse, LLC. Retrieved March 2, 2013.
External links
| Authority control |
|
|---|