Penobscot County, Maine
Penobscot County is a county in the U.S. state of Maine. As of the 2010 census, the population was 153,923.[1] Its county seat is Bangor.[2] The county was established on February 15, 1816 from part of Hancock County when the area was still part of Massachusetts. Penobscot County is home to the University of Maine.
Penobscot County | |
|---|---|
 Penobscot County Courthouse | |
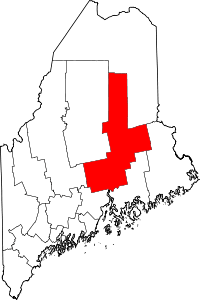 Location within the U.S. state of Maine | |
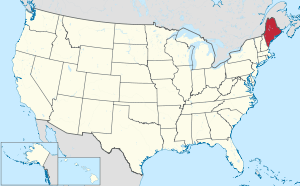 Maine's location within the U.S. | |
| Coordinates: 45.40°N 68.63°W | |
| Country | |
| State | |
| Founded | 1816 |
| Named for | Penobscot tribe |
| Seat | Bangor |
| Largest city | Bangor |
| Area | |
| • Total | 3,557 sq mi (9,210 km2) |
| • Land | 3,397 sq mi (8,800 km2) |
| • Water | 160 sq mi (400 km2) 4.5%% |
| Population (2010) | |
| • Total | 153,923 |
| • Estimate (2019) | 152,148 |
| • Density | 45/sq mi (17/km2) |
| Time zone | UTC−5 (Eastern) |
| • Summer (DST) | UTC−4 (EDT) |
| Congressional district | 2nd |
| Website | www.penobscot-county.net |
Penobscot County comprises the Bangor, ME Metropolitan Statistical Area.
Geography
According to the U.S. Census Bureau, the county has an area of 3,557 square miles (9,210 km2), of which 3,397 square miles (8,800 km2) is land and 160 square miles (410 km2) (4.5%) is water.[3]
Adjacent counties
- Aroostook County – north
- Washington County – southeast
- Hancock County – south
- Waldo County – southwest
- Somerset County – west
- Piscataquis County – northwest
National protected area
Demographics
| Historical population | |||
|---|---|---|---|
| Census | Pop. | %± | |
| 1820 | 13,870 | — | |
| 1830 | 31,530 | 127.3% | |
| 1840 | 45,705 | 45.0% | |
| 1850 | 63,089 | 38.0% | |
| 1860 | 72,731 | 15.3% | |
| 1870 | 75,150 | 3.3% | |
| 1880 | 70,476 | −6.2% | |
| 1890 | 72,865 | 3.4% | |
| 1900 | 76,246 | 4.6% | |
| 1910 | 85,285 | 11.9% | |
| 1920 | 87,684 | 2.8% | |
| 1930 | 92,379 | 5.4% | |
| 1940 | 97,104 | 5.1% | |
| 1950 | 108,198 | 11.4% | |
| 1960 | 126,346 | 16.8% | |
| 1970 | 125,393 | −0.8% | |
| 1980 | 137,015 | 9.3% | |
| 1990 | 146,601 | 7.0% | |
| 2000 | 144,919 | −1.1% | |
| 2010 | 153,923 | 6.2% | |
| Est. 2019 | 152,148 | [4] | −1.2% |
| U.S. Decennial Census[5] 1790–1960[6] 1900–1990[7] 1990–2000[8] 2010–2019[1] | |||
2000 census
At the 2000 census there were 144,919 people, 58,096 households, and 37,820 families living in the county. The population density was 43 people per square mile (16/km²). There were 66,847 housing units at an average density of 20 per square mile (8/km²). The county's racial makeup was 96.60% White, 0.49% Black or African American, 1.00% Native American, 0.70% Asian, 0.03% Pacific Islander, 0.23% from other races, and 0.96% from two or more races. 0.61% of the population were Hispanic or Latino of any race. 17.8% were of English, 17.3% United States or American, 14.0% French, 13.0% Irish and 6.7% French Canadian ancestry. 95.8% spoke English and 2.3% French as their first language.[9] There were 58,096 households, of which 30.10% had children under the age of 18 living with them, 51.50% were married couples living together, 9.90% had a female householder with no husband present, and 34.90% were non-families. 26.70% of households were one person and 10.00% were one person aged 65 or older. The average household size was 2.38 and the average family size was 2.88.
The age distribution was 22.80% under the age of 18, 11.30% from 18 to 24, 29.00% from 25 to 44, 23.80% from 45 to 64, and 13.10% 65 or older. The median age was 37 years. For every 100 females there were 95.30 males. For every 100 females age 18 and over, there were 92.30 males.
The median household income was $34,274 and the median family income was $42,206. Males had a median income of $32,824 versus $23,346 for females. The per capita income for the county was $17,801. About 9.70% of families and 13.70% of the population were below the poverty line, including 15.00% of those under age 18 and 11.10% of those age 65 or over.
2010 census
At the 2010 census, there were 153,923 people, 62,966 households, and 38,917 families living in the county.[10] The population density was 45.3 inhabitants per square mile (17.5/km2). There were 73,860 housing units at an average density of 21.7 per square mile (8.4/km2).[11] The county's racial makeup was 95.4% white, 1.2% American Indian, 0.9% Asian, 0.8% black or African American, 0.2% from other races, and 1.5% from two or more races. Those of Hispanic or Latino origin made up 1.1% of the population.[10] In terms of ancestry, 20.9% were English, 17.2% were Irish, 9.4% were American, 7.1% were German, 6.0% were French Canadian, and 5.9% were Scottish.[12]
Of the 62,966 households, 27.5% had children under the age of 18 living with them, 47.1% were married couples living together, 10.3% had a female householder with no husband present, 38.2% were non-families, and 28.0% of households were made up of individuals. The average household size was 2.33 and the average family size was 2.82. The median age was 39.9 years.[10]
The county's median household income was $42,658 and the median family income was $54,271. Males had a median income of $41,094 versus $31,910 for females. The county's per capita income was $22,977. About 10.1% of families and 15.7% of the population were below the poverty line, including 20.4% of those under age 18 and 9.2% of those age 65 or over.[13]
Politics
As the most populous county in Maine's 2nd congressional district, Penobscot County's support for Donald Trump in 2016 helped deliver him a split electoral vote from Maine. It was the first time since 1828 that Maine split its electoral votes.
| Voter registration and party enrollment as of May 2019 [14] | |||||
|---|---|---|---|---|---|
| Unenrolled | 40,750 | 35.22% | |||
| Republican | 36,320 | 31.4% | |||
| Democratic | 33,802 | 29.22% | |||
| Green Independent | 4,800 | 4.15% | |||
| Libertarian | 13 | 0.01% | |||
| Total | 115,685 | 100% | |||
| Year | Republican | Democratic | Third parties |
|---|---|---|---|
| 2016 | 51.7% 41,622 | 40.8% 32,838 | 7.6% 6,080 |
| 2012 | 47.3% 36,547 | 50.2% 38,811 | 2.5% 1,948 |
| 2008 | 46.6% 37,495 | 51.7% 41,614 | 1.7% 1,358 |
| 2004 | 49.1% 40,318 | 49.2% 40,417 | 1.7% 1,377 |
| 2000 | 48.7% 35,620 | 44.9% 32,868 | 6.4% 4,718 |
| 1996 | 32.5% 22,885 | 51.0% 35,961 | 16.6% 11,671 |
| 1992 | 30.1% 24,218 | 36.7% 29,485 | 33.2% 26,741 |
| 1988 | 54.8% 34,912 | 44.6% 28,429 | 0.7% 413 |
| 1984 | 62.1% 40,403 | 37.6% 24,445 | 0.3% 206 |
| 1980 | 46.0% 28,869 | 42.2% 26,519 | 11.8% 7,405 |
| 1976 | 52.2% 29,016 | 44.4% 24,672 | 3.5% 1,925 |
| 1972 | 61.9% 30,186 | 38.1% 18,552 | 0.0% 11 |
| 1968 | 44.5% 20,011 | 54.1% 24,327 | 1.5% 661 |
| 1964 | 33.4% 14,449 | 66.5% 28,766 | 0.0% 17 |
| 1960 | 59.8% 28,459 | 40.3% 19,175 | 0.0% 0 |
| 1956 | 76.4% 27,806 | 23.6% 8,568 | 0.0% 0 |
| 1952 | 68.6% 24,614 | 31.3% 11,222 | 0.1% 49 |
| 1948 | 59.9% 16,367 | 39.2% 10,705 | 0.9% 243 |
| 1944 | 56.0% 16,934 | 43.9% 13,292 | 0.1% 38 |
| 1940 | 55.8% 18,674 | 44.1% 14,757 | 0.1% 40 |
| 1936 | 60.8% 19,077 | 31.0% 9,732 | 8.2% 2,559 |
| 1932 | 58.8% 18,987 | 40.4% 13,058 | 0.8% 272 |
| 1928 | 70.3% 21,750 | 29.4% 9,114 | 0.3% 96 |
| 1924 | 74.9% 15,081 | 18.0% 3,618 | 7.1% 1,429 |
| 1920 | 69.4% 14,145 | 30.0% 6,110 | 0.7% 143 |
| 1916 | 49.4% 7,324 | 49.2% 7,294 | 1.4% 205 |
| 1912 | 23.9% 3,367 | 36.2% 5,093 | 39.9% 5,622 |
| 1908 | 66.0% 7,336 | 31.7% 3,525 | 2.3% 250 |
Communities
Towns
- Alton
- Bradford
- Bradley
- Burlington
- Carmel
- Charleston
- Chester
- Clifton
- Corinna
- Corinth
- Dexter
- Dixmont
- East Millinocket
- Eddington
- Edinburg
- Enfield
- Etna
- Exeter
- Garland
- Glenburn
- Greenbush
- Hampden
- Hermon
- Holden
- Howland
- Hudson
- Kenduskeag
- Lagrange
- Lakeville
- Lee
- Levant
- Lincoln
- Lowell
- Mattawamkeag
- Maxfield
- Medway
- Milford
- Millinocket
- Mount Chase
- Newburgh
- Newport
- Orono
- Orrington
- Passadumkeag
- Patten
- Plymouth
- Springfield
- Stacyville
- Stetson
- Veazie
- Winn
- Woodville
Census-designated places
Unorganized territories
Indian reservation
References
- "State & County QuickFacts". United States Census Bureau. Archived from the original on June 6, 2011. Retrieved August 19, 2013.
- "Find a County". National Association of Counties. Retrieved 2011-06-07.
- "2010 Census Gazetteer Files". United States Census Bureau. August 22, 2012. Archived from the original on September 9, 2014. Retrieved September 7, 2014.
- "Population and Housing Unit Estimates". Retrieved May 21, 2020.
- "U.S. Decennial Census". United States Census Bureau. Retrieved September 7, 2014.
- "Historical Census Browser". University of Virginia Library. Retrieved September 7, 2014.
- "Population of Counties by Decennial Census: 1900 to 1990". United States Census Bureau. Retrieved September 7, 2014.
- "Census 2000 PHC-T-4. Ranking Tables for Counties: 1990 and 2000" (PDF). United States Census Bureau. Retrieved September 7, 2014.
- "U.S. Census website". United States Census Bureau. Retrieved 2008-01-31.
- "DP-1 Profile of General Population and Housing Characteristics: 2010 Demographic Profile Data". United States Census Bureau. Archived from the original on 2020-02-13. Retrieved 2016-01-21.
- "Population, Housing Units, Area, and Density: 2010 - County". United States Census Bureau. Archived from the original on 2020-02-13. Retrieved 2016-01-21.
- "DP02 SELECTED SOCIAL CHARACTERISTICS IN THE UNITED STATES – 2006-2010 American Community Survey 5-Year Estimates". United States Census Bureau. Archived from the original on 2020-02-13. Retrieved 2016-01-21.
- "DP03 SELECTED ECONOMIC CHARACTERISTICS – 2006-2010 American Community Survey 5-Year Estimates". United States Census Bureau. Archived from the original on 2020-02-13. Retrieved 2016-01-21.
- Bureau of Corporations, Elections & Commissions (5 May 2019). "Registered & Enrolled Voters - Statewide" (PDF). Department of the Secretary of State, State of Maine. p. 22. Retrieved 13 November 2019.
- Leip, David. "Dave Leip's Atlas of U.S. Presidential Elections". uselectionatlas.org.
External links
- Penobscot County Official Website
- Penobscot County on Maine.gov
- "The Ancient Penobscot, or Panawanskek". Historical Magazine, February 1872.
Places adjacent to Penobscot County, Maine | ||||||||||
|---|---|---|---|---|---|---|---|---|---|---|
| ||||||||||
Municipalities and communities of Penobscot County, Maine, United States | ||
|---|---|---|
| Cities | Penobscot County map | |
| Towns |
| |
| Plantations | ||
| Unorganized territories | ||
| CDPs | ||
| Other villages | ||
| Indian reservation | ||
Augusta (capital) | ||
| Topics |
| |
| Society |
| |
| Regions | ||
| Counties | ||
| Cities | ||
| Largest towns | ||

| Authority control |
|
|---|