Kennebec County, Maine
Kennebec County is a county in the U.S. state of Maine, in the United States. As of the 2010 census, the population was 121,581.[1] Its county seat is Augusta,[2] the state capital. The county was established on February 20, 1799 from portions of Cumberland and Lincoln Counties. The name Kennebec comes from the Eastern Abenaki /kínipekʷ/, meaning "large body of still water, large bay."[3]
Kennebec County | |
|---|---|
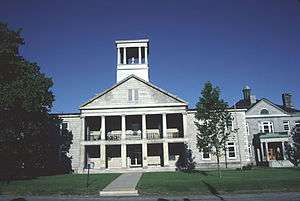 Kennebec County Courthouse | |
 Seal | |
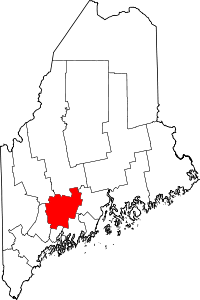 Location within the U.S. state of Maine | |
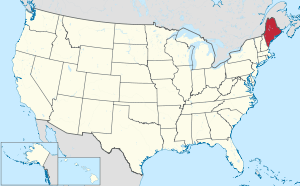 Maine's location within the U.S. | |
| Coordinates: 44°24′00″N 69°47′04″W | |
| Country | |
| State | |
| Founded | 1799 |
| Named for | Kennebec River |
| Seat | Augusta |
| Largest city | Augusta |
| Area | |
| • Total | 951 sq mi (2,460 km2) |
| • Land | 868 sq mi (2,250 km2) |
| • Water | 84 sq mi (220 km2) 8.8%% |
| Population (2010) | |
| • Total | 121,581 |
| • Estimate (2019) | 122,302 |
| • Density | 130/sq mi (49/km2) |
| Time zone | UTC−5 (Eastern) |
| • Summer (DST) | UTC−4 (EDT) |
| Congressional districts | 1st, 2nd |
| Website | www |
Kennebec County comprises the Augusta–Waterville, ME Micropolitan Statistical Area.
In 2010, the center of population of Maine was in Kennebec County, in the city of Augusta.[4]
Geography
According to the U.S. Census Bureau, the county has a total area of 951 square miles (2,460 km2), of which 868 square miles (2,250 km2) is land and 84 square miles (220 km2) (8.8%) is water.[5]
Adjacent counties
- Somerset County – north
- Waldo County – east
- Sagadahoc County – south
- Lincoln County – south
- Androscoggin County – southwest
- Franklin County – northwest
Demographics
| Historical population | |||
|---|---|---|---|
| Census | Pop. | %± | |
| 1800 | 24,571 | — | |
| 1810 | 32,564 | 32.5% | |
| 1820 | 42,623 | 30.9% | |
| 1830 | 52,485 | 23.1% | |
| 1840 | 55,823 | 6.4% | |
| 1850 | 62,521 | 12.0% | |
| 1860 | 55,655 | −11.0% | |
| 1870 | 53,203 | −4.4% | |
| 1880 | 53,058 | −0.3% | |
| 1890 | 57,012 | 7.5% | |
| 1900 | 59,117 | 3.7% | |
| 1910 | 62,863 | 6.3% | |
| 1920 | 63,844 | 1.6% | |
| 1930 | 70,691 | 10.7% | |
| 1940 | 77,231 | 9.3% | |
| 1950 | 83,881 | 8.6% | |
| 1960 | 89,150 | 6.3% | |
| 1970 | 95,247 | 6.8% | |
| 1980 | 109,889 | 15.4% | |
| 1990 | 115,904 | 5.5% | |
| 2000 | 117,114 | 1.0% | |
| 2010 | 122,151 | 4.3% | |
| Est. 2019 | 122,302 | 0.1% | |
| U.S. Decennial Census[6] 1790–1960[7] 1900–1990[8] 1990–2000[9] 2010–2019[1] | |||
2000 census
As of the census[10] of 2000, there were 117,114 people, 47,683 households, and 31,327 families living in the county. The population density was 135 people per square mile (52/km²). There were 56,364 housing units at an average density of 65 per square mile (25/km²). The racial makeup of the county was 97.45% White, 0.34% Black or African American, 0.40% Native American, 0.59% Asian, 0.02% Pacific Islander, 0.18% from other races, and 1.02% from two or more races. 0.73% of the population were Hispanic or Latino of any race. 20.6% were of English, 17.4% French, 13.4% French Canadian, 10.9% United States or American and 9.9% Irish ancestry. 92.5% spoke only English at home, while 5.48% spoke French.[11]
There were 47,683 households out of which 31.20% had children under the age of 18 living with them, 51.60% were married couples living together, 10.00% had a female householder with no husband present, and 34.30% were non-families. 27.60% of all households were made up of individuals and 10.60% had someone living alone who was 65 years of age or older. The average household size was 2.38 and the average family size was 2.89.
In the county, the population was spread out with 23.80% under the age of 18, 8.50% from 18 to 24, 28.60% from 25 to 44, 24.90% from 45 to 64, and 14.20% who were 65 years of age or older. The median age was 39 years. For every 100 females there were 94.00 males. For every 100 females age 18 and over, there were 90.80 males.
The median income for a household in the county was $36,498, and the median income for a family was $43,814. Males had a median income of $32,279 versus $24,032 for females. The per capita income for the county was $18,520. About 8.50% of families and 11.10% of the population were below the poverty line, including 13.20% of those under age 18 and 10.20% of those age 65 or over.
2010 census
As of the 2010 United States Census, there were people, households, and families living in the county.[12] The population density was 140.8 inhabitants per square mile (54.4/km2). There were 60,972 housing units at an average density of 70.3 per square mile (27.1/km2).[13] The racial makeup of the county was % from other races, and % from two or more races. Those of Hispanic or Latino origin made up % of the population.[12] In terms of ancestry, 24.2% were English, 17.0% were Irish, 8.3% were German, 7.7% were French Canadian, 5.7% were American, and 5.4% were Scottish.[14]
Of the households, % had children under the age of 18 living with them, % were married couples living together, % had a female householder with no husband present, % were non-families, and % of all households were made up of individuals. The average household size was and the average family size was . The median age was years.[12]
The median income for a household in the county was $45,973 and the median income for a family was $56,853. Males had a median income of $42,176 versus $32,471 for females. The per capita income for the county was $24,656. About 7.8% of families and 12.5% of the population were below the poverty line, including 16.9% of those under age 18 and 9.6% of those age 65 or over.[15]
Micropolitan statistical area
The United States Office of Management and Budget has designated Kennebec County as the Augusta–Waterville, ME Micropolitan Statistical Area (µSA). As of the 2010 U.S. Census[16] the micropolitan area ranked the most populous in the State of Maine and also the only micropolitan area within the state. The area also ranks 13th most populous in the United States with a population of 122,151.
Economy
Kennebec County's economy has traditionally been industrial. A large amount of paper and textiles were produced, and mills sprung up along the Kennebec river. The median household income is $36,498. The unemployment rate is 4.2% (lower than it has been in a year).
Education
There are three colleges: Colby College and Thomas College (both in Waterville), and the University of Maine at Augusta. There are 19 school districts (however, 4 are consolidated ones). In China Maine, there is no public high school, but a private school (Erskine Academy) exists, and the town pays for students tuition if they choose to attend. Students from Vassalboro can pick from one of four school districts (Cony in Augusta, Erskine, Winslow, or Waterville). However, many towns have local public high schools.
Politics
Kennebec County has consistently voted Democrat in recent elections, until 2016 when it voted for Donald Trump, the first time since 1988. While the more rural areas support the Republican Party, the urban areas are strongly Democratic. Kennebec County is the only county in Maine that is split between Maine's two congressional districts. The larger, southern portion of the county is in the 1st Congressional District of Maine, while the northern, smaller portion is in the 2nd Congressional District of Maine.
Voter registration
| Voter registration and party enrollment as of May 2019 [17] | |||||
|---|---|---|---|---|---|
| Unenrolled | 32,904 | 34.8% | |||
| Democratic | 30,205 | 31.94% | |||
| Republican | 27,378 | 28.95% | |||
| Green Independent | 4,070 | 4.3% | |||
| Libertarian | 6 | 0.01% | |||
| Total | 94,564 | 100% | |||
| Year | Republican | Democratic | Third parties |
|---|---|---|---|
| 2016 | 47.8% 31,675 | 44.3% 29,302 | 7.9% 5,231 |
| 2012 | 41.8% 26,519 | 55.2% 35,068 | 3.0% 1,910 |
| 2008 | 41.7% 27,482 | 56.4% 37,238 | 1.9% 1,266 |
| 2004 | 44.6% 29,761 | 53.3% 35,616 | 2.1% 1,395 |
| 2000 | 40.7% 23,967 | 53.0% 31,198 | 6.4% 3,742 |
| 1996 | 27.7% 15,403 | 54.4% 30,257 | 18.0% 9,994 |
| 1992 | 26.8% 17,135 | 39.3% 25,125 | 33.9% 21,661 |
| 1988 | 53.6% 27,734 | 45.6% 23,578 | 0.8% 433 |
| 1984 | 59.7% 31,753 | 39.8% 21,183 | 0.5% 255 |
| 1980 | 43.8% 21,517 | 42.7% 20,943 | 13.5% 6,617 |
| 1976 | 47.5% 22,534 | 49.5% 23,473 | 3.0% 1,400 |
| 1972 | 60.0% 24,617 | 39.9% 16,379 | 0.1% 39 |
| 1968 | 41.8% 16,009 | 56.8% 21,752 | 1.4% 531 |
| 1964 | 31.3% 11,307 | 68.7% 24,813 | 0.1% 23 |
| 1960 | 54.3% 21,699 | 45.7% 18,252 | 0.0% 0 |
| 1956 | 66.7% 23,028 | 33.3% 11,483 | 0.0% 0 |
| 1952 | 63.6% 21,207 | 36.3% 12,113 | 0.1% 31 |
| 1948 | 55.1% 13,923 | 44.2% 11,163 | 0.7% 174 |
| 1944 | 50.4% 14,335 | 49.5% 14,070 | 0.1% 25 |
| 1940 | 48.4% 14,877 | 51.6% 15,861 | 0.1% 27 |
| 1936 | 55.3% 14,987 | 41.6% 11,268 | 3.1% 826 |
| 1932 | 53.9% 14,451 | 45.2% 12,110 | 0.9% 236 |
| 1928 | 65.1% 15,541 | 34.5% 8,226 | 0.4% 92 |
| 1924 | 72.3% 13,122 | 23.0% 4,184 | 4.7% 853 |
| 1920 | 68.6% 12,333 | 30.4% 5,466 | 1.0% 174 |
| 1916 | 53.7% 6,731 | 44.1% 5,527 | 2.2% 273 |
| 1912 | 15.2% 1,782 | 37.5% 4,397 | 47.3% 5,547 |
| 1908 | 66.0% 6,133 | 30.9% 2,871 | 3.1% 290 |
Communities
Cities
- Augusta (county seat)
- Gardiner
- Hallowell
- Waterville
Towns
Unorganized territory
Census-designated places
Other unincorporated villages
Footnotes
- "State & County QuickFacts". United States Census Bureau. Archived from the original on June 6, 2011. Retrieved August 19, 2013.
- "Find a County". National Association of Counties. Archived from the original on May 31, 2011. Retrieved June 7, 2011.
- Bright, William (2004). Native American placenames of the United States. University of Oklahoma Press. p. 212. ISBN 978-0-8061-3598-4. Retrieved April 14, 2011.
- "Centers of Population by State: 2010". United States Census Bureau. Archived from the original on January 3, 2014. Retrieved September 7, 2014.
- "2010 Census Gazetteer Files". United States Census Bureau. August 22, 2012. Archived from the original on September 9, 2014. Retrieved September 7, 2014.
- "U.S. Decennial Census". United States Census Bureau. Retrieved September 7, 2014.
- "Historical Census Browser". University of Virginia Library. Retrieved September 7, 2014.
- "Population of Counties by Decennial Census: 1900 to 1990". United States Census Bureau. Retrieved September 7, 2014.
- "Census 2000 PHC-T-4. Ranking Tables for Counties: 1990 and 2000" (PDF). United States Census Bureau. Retrieved September 7, 2014.
- "U.S. Census website". United States Census Bureau. Retrieved January 31, 2008.
- http://www.mla.org/map_data_results&state_id=23&county_id=11&mode=geographic&zip=&place_id=&cty_id=&a=&ea=&order=&ll=all
- "DP-1 Profile of General Population and Housing Characteristics: 2010 Demographic Profile Data". United States Census Bureau. Archived from the original on February 13, 2020. Retrieved January 21, 2016.
- "Population, Housing Units, Area, and Density: 2010 - County". United States Census Bureau. Archived from the original on February 13, 2020. Retrieved January 21, 2016.
- "DP02 SELECTED SOCIAL CHARACTERISTICS IN THE UNITED STATES – 2006-2010 American Community Survey 5-Year Estimates". United States Census Bureau. Archived from the original on February 13, 2020. Retrieved January 21, 2016.
- "DP03 SELECTED ECONOMIC CHARACTERISTICS – 2006-2010 American Community Survey 5-Year Estimates". United States Census Bureau. Archived from the original on February 13, 2020. Retrieved January 21, 2016.
- "2010 U.S. Census website". United States Census Bureau. Retrieved July 10, 2016.
- Bureau of Corporations, Elections & Commissions (May 5, 2019). "Registered & Enrolled Voters - Statewide" (PDF). Department of the Secretary of State, State of Maine. p. 15. Retrieved November 13, 2019.
- Leip, David. "Dave Leip's Atlas of U.S. Presidential Elections". uselectionatlas.org. Retrieved August 25, 2018.
Further reading
- Samuel Lane Boardman, History of the Agriculture of Kennebec County, Maine. New York: Blake, 1892.
- Raymond Stevens Finley, The History of Secondary Education in Kennebec County in Maine. Orono, ME: University of Maine at Orono Press, 1941.
- Rufus Matthew Jones, The Society of Friends in Kennebec County, Maine. New York: H.W. Blake and Co., 1892.
- Henry D. Kingsbury and Simeon L. Deyo (eds.), Illustrated history of Kennebec County, Maine: 1625-1799-1892. New York: H.W. Blake and Co., 1892.
- Cynthia MacAlman McCausland, Index to Kingsbury and Deyo's illustrated history of Kennebec County, Maine. Camden, ME: Picton Press, 1996.
- George W. Walton, History of the Town of Wayne, Kennebec County, Maine, From Its Settlement to 1898. Augusta, ME: Maine Farmer Publishing Co., 1898.
- Edwin Carey Whittemore, The Centennial History of Waterville, Kennebec County, Maine, Including the Oration, the Historical Address and the Poem Presented at the Celebration of the Centennial Anniversary of the Incorporation of the Town, June 23d, 1902. Waterville, ME: Executive Committee of the Centennial Celebration, 1902.
External links
Places adjacent to Kennebec County, Maine | ||||||||||
|---|---|---|---|---|---|---|---|---|---|---|
| ||||||||||
Municipalities and communities of Kennebec County, Maine, United States | ||
|---|---|---|
| Cities | Kennebec County map | |
| Towns | ||
| Unorganized territory | ||
| CDPs |
| |
| Other villages | ||
Augusta (capital) | ||
| Topics |
| |
| Society |
| |
| Regions | ||
| Counties | ||
| Cities | ||
| Largest towns | ||

| Authority control |
|
|---|