Maribojoc, Bohol
Maribojoc, officially the Municipality of Maribojoc (Cebuano: Lungsod sa Maribojoc; Tagalog: Bayan ng Maribojoc), is a 4th class municipality in the province of Bohol, Philippines. According to the 2015 census, it has a population of 20,688 people.[4]
Maribojoc | |
|---|---|
| Municipality of Maribojoc | |
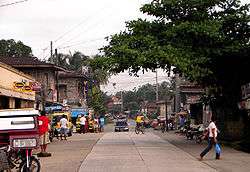 Poblacion of Maribojoc | |
 Flag | |
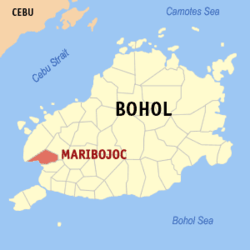 Map of Bohol with Maribojoc highlighted | |
OpenStreetMap 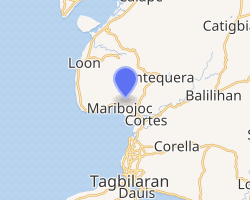
| |
.svg.png) Maribojoc Location within the Philippines | |
| Coordinates: 9°45′N 123°51′E | |
| Country | |
| Region | Central Visayas (Region VII) |
| Province | Bohol |
| District | 1st District |
| Founded | 15 October 1860 |
| Barangays | 22 (see Barangays) |
| Government | |
| • Type | Sangguniang Bayan |
| • Mayor | Romulo A. Manuta |
| • Vice Mayor | Emilio "Boyet" J. Castilla |
| • Congressman | Edgardo M. Chatto |
| • Electorate | 14,194 voters (2019) |
| Area | |
| • Total | 69.08 km2 (26.67 sq mi) |
| Elevation | 8.1 m (26.6 ft) |
| Population (2015 census)[4] | |
| • Total | 20,688 |
| • Density | 300/km2 (780/sq mi) |
| • Households | 4,723 |
| Economy | |
| • Income class | 4th municipal income class |
| • Poverty incidence | 14.6% (2015)[5] |
| • Revenue (₱) | 73,236,575.78 (2016) |
| Time zone | UTC+8 (PST) |
| ZIP code | 6336 |
| PSGC | |
| IDD : area code | +63 (0)38 |
| Climate type | tropical monsoon climate |
| Native languages | Boholano dialect Cebuano Tagalog |
The municipality has a land area of 6,908 hectares (17,070 acres). The first language spoken is Cebuano, with a Boholano dialect, however English and Filipino are often also spoken and understood. Fishing and agriculture are the two main sources of livelihood.
The town of Maribojoc, Bohol celebrates its feast on November 10, to honor the town patron Saint Vincent.[6]
History
Maribojoc was a fishing village when Jesuit priests Juan de Torres and Gabriel Sanchez landed in Baclayon in 1595, bringing Catholicism also to Maribojoc. Fr. Francisco Colín, an early Jesuit historian, listed the town's name as Malabooch and later changed it to Malabohoc.[7] During the pre-Spanish era, the town's name was Dunggoan, meaning "place of anchorage" and referred to the sheltered bay where sailors used to land and engage in business with the early settlers.[8]
The Maribojoc parish, officially known as Parroquía de Santa Cruz, was founded in 1767, when the Jesuits left Maribojoc. Maribojoc was one of the nine big villages founded by the Augustinian Recollect friars when they took over in 1768. They laid the foundation of the Maribojoc church in 1798 on what was once swampy land, and it was finished in 1816, after 18 years of work. At the back of the church is a flight of stone stairs, built in 1864. Earlier, in 1796, the Punta Cruz Watchtower was built as a lookout against marauding pirates.
The town of Maribojoc was officially incorporated on 15 October 1860, and grew into a thriving town with a population of 18,200 by 1879.[8]
Maribojoc was severely affected by the magnitude 7.2 earthquake which struck Bohol, suffering 16 fatalities and damage to some 3,700 homes, as well as total destruction of its Catholic church.[9]
Barangays
Maribojoc comprises 22 barangays:
| PSGC | Barangay | Population | ±% p.a. | Area | PD 2015 | |||||
|---|---|---|---|---|---|---|---|---|---|---|
| 2015[4] | 2010[10] | ha | acre | /km2 | /sq mi | |||||
| 071232002 | Agahay | 3.0% | 625 | 603 | 0.68% | 305 | 754 | 200 | 530 | |
| 071232003 | Aliguay | 4.7% | 971 | 859 | 2.36% | 326 | 806 | 300 | 770 | |
| 071232004 | Anislag | 4.8% | 988 | 1,004 | −0.31% | 93 | 230 | 1,100 | 2,800 | |
| 071232005 | Bayacabac | 8.9% | 1,835 | 1,601 | 2.63% | 353 | 872 | 520 | 1,300 | |
| 071232006 | Bood | 2.1% | 426 | 475 | −2.05% | 312 | 771 | 140 | 350 | |
| 071232007 | Busao | 2.6% | 537 | 587 | −1.68% | 146 | 361 | 370 | 950 | |
| 071232008 | Cabawan | 7.9% | 1,626 | 1,516 | 1.34% | 467 | 1,154 | 350 | 900 | |
| 071232009 | Candavid | 2.4% | 498 | 541 | −1.56% | 367 | 907 | 140 | 350 | |
| 071232010 | Dipatlong | 7.2% | 1,495 | 1,562 | −0.83% | 147 | 363 | 1,000 | 2,600 | |
| 071232011 | Guiwanon | 2.6% | 532 | 569 | −1.27% | 335 | 828 | 160 | 410 | |
| 071232012 | Jandig | 5.0% | 1,032 | 897 | 2.71% | 662 | 1,636 | 160 | 400 | |
| 071232013 | Lagtangon | 1.1% | 232 | 266 | −2.57% | 331 | 818 | 70 | 180 | |
| 071232014 | Lincod | 8.3% | 1,726 | 1,781 | −0.60% | 245 | 605 | 700 | 1,800 | |
| 071232015 | Pagnitoan | 3.0% | 630 | 630 | 0.00% | 510 | 1,260 | 120 | 320 | |
| 071232016 | Poblacion | 10.2% | 2,103 | 2,298 | −1.67% | 93 | 230 | 2,300 | 5,900 | |
| 071232017 | Punsod | 3.2% | 657 | 644 | 0.38% | 119 | 294 | 550 | 1,400 | |
| 071232018 | Punta Cruz | 3.6% | 737 | 770 | −0.83% | 435 | 1,075 | 170 | 440 | |
| 071232019 | San Isidro | 2.9% | 605 | 525 | 2.74% | 309 | 764 | 200 | 510 | |
| 071232001 | San Roque (Aghao) | 6.1% | 1,256 | 1,177 | 1.24% | 536 | 1,325 | 230 | 610 | |
| 071232020 | San Vicente | 5.3% | 1,097 | 1,115 | −0.31% | 113 | 279 | 970 | 2,500 | |
| 071232021 | Tinibgan | 2.8% | 576 | 614 | −1.21% | 441 | 1,090 | 130 | 340 | |
| 071232022 | Toril | 2.4% | 504 | 457 | 1.88% | 263 | 650 | 190 | 500 | |
| Total | 20,688 | 20,491 | 0.18% | 6,908 | 17,070 | 300 | 780 | |||
Climate
| Climate data for Maribojoc, Bohol | |||||||||||||
|---|---|---|---|---|---|---|---|---|---|---|---|---|---|
| Month | Jan | Feb | Mar | Apr | May | Jun | Jul | Aug | Sep | Oct | Nov | Dec | Year |
| Average high °C (°F) | 28 (82) |
29 (84) |
30 (86) |
31 (88) |
31 (88) |
30 (86) |
30 (86) |
30 (86) |
30 (86) |
29 (84) |
29 (84) |
29 (84) |
30 (85) |
| Average low °C (°F) | 23 (73) |
22 (72) |
23 (73) |
23 (73) |
24 (75) |
25 (77) |
24 (75) |
24 (75) |
24 (75) |
24 (75) |
23 (73) |
23 (73) |
24 (74) |
| Average precipitation mm (inches) | 102 (4.0) |
85 (3.3) |
91 (3.6) |
75 (3.0) |
110 (4.3) |
141 (5.6) |
121 (4.8) |
107 (4.2) |
111 (4.4) |
144 (5.7) |
169 (6.7) |
139 (5.5) |
1,395 (55.1) |
| Average rainy days | 18.6 | 14.8 | 16.5 | 16.7 | 23.9 | 26.4 | 25.6 | 24.1 | 24.4 | 26.3 | 23.7 | 20.5 | 261.5 |
| Source: Meteoblue [11] | |||||||||||||
Demographics
| Population census of Maribojoc | ||
|---|---|---|
| Year | Pop. | ±% p.a. |
| 1903 | 11,830 | — |
| 1918 | 13,627 | +0.95% |
| 1939 | 13,834 | +0.07% |
| 1948 | 13,906 | +0.06% |
| 1960 | 13,003 | −0.56% |
| 1970 | 14,055 | +0.78% |
| 1975 | 14,333 | +0.39% |
| 1980 | 14,008 | −0.46% |
| 1990 | 15,214 | +0.83% |
| 1995 | 14,664 | −0.69% |
| 2000 | 16,786 | +2.94% |
| 2007 | 18,113 | +1.05% |
| 2010 | 20,491 | +4.59% |
| 2015 | 20,688 | +0.18% |
| Source: Philippine Statistics Authority[4][10][12][13] | ||
Gallery
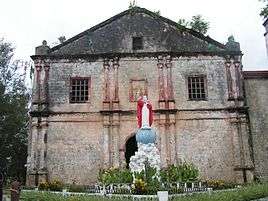 Roman Catholic Church, before its destruction in the 2013 earthquake
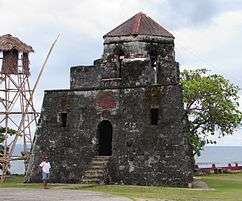
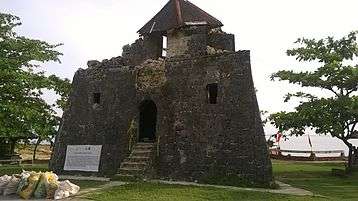 Remains of Punta Cruz watchtower, Maribojoc Bohol post-2013 earthquake
References
- "Municipality". Quezon City, Philippines: Department of the Interior and Local Government. Retrieved 31 May 2013.
- "Province: Bohol". PSGC Interactive. Quezon City, Philippines: Philippine Statistics Authority. Retrieved 12 November 2016.
- "Maribojoc, Bohol Profile". PhilAtlas.com. Retrieved 15 June 2020.
- Census of Population (2015). "Region VII (Central Visayas)". Total Population by Province, City, Municipality and Barangay. PSA. Retrieved 20 June 2016.
- "PSA releases the 2015 Municipal and City Level Poverty Estimates". Quezon City, Philippines. Retrieved 12 October 2019.
- "Bohol Festivals Timetable". "www.bohol-philippines.com". Retrieved 2019-04-02.
- Colín 1663.
- "Municipality of Maribojoc". Province of Bohol. Retrieved 2012-09-19.
- "SitRep No. 35 re Effects of Magnitude 7.2 Sagbayan, Bohol Earthquake" (PDF). National Disaster Risk Reduction and Management Council. November 3, 2013. Archived from the original (PDF) on December 14, 2013. Retrieved November 7, 2013.
- Census of Population and Housing (2010). "Region VII (Central Visayas)". Total Population by Province, City, Municipality and Barangay. NSO. Retrieved 29 June 2016.
- "Maribojoc: Average Temperatures and Rainfall". Meteoblue. Retrieved 9 May 2020.
- Censuses of Population (1903–2007). "Region VII (Central Visayas)". Table 1. Population Enumerated in Various Censuses by Province/Highly Urbanized City: 1903 to 2007. NSO.
- "Province of Bohol". Municipality Population Data. Local Water Utilities Administration Research Division. Retrieved 17 December 2016.
Sources
- Colín, Fr Francisco (1663). Labor evangelica, ministerios apostolicos de los obreros de la Compañia de Jesus, fundacion y progresos de su provincia en las Islas Filipinas (3 vols) (in Spanish). Madrid: Joseph Fernandez Buendia. OCLC 41563762.CS1 maint: ref=harv (link)
| Wikimedia Commons has media related to Maribojoc. |
External links
Places adjacent to Maribojoc, Bohol | |
|---|---|