Tropical monsoon climate
An area of tropical monsoon climate (occasionally known as a tropical wet climate or a tropical monsoon and trade-wind littoral climate) is a type of climate that corresponds to the Köppen climate classification category "Am". Tropical monsoon climates have monthly mean temperatures above 18 °C (64 °F) in every month of the year and a dry season. [1]:200–1 Tropical monsoon climates is the intermediate climate between the wet Af (or tropical rainforest climate) and the drier Aw (or tropical savanna climate).
A tropical monsoon climate, however, has its driest month seeing on average less than 60 mm, but more than .[1] This latter fact is in direct contrast to a tropical savanna climate, whose driest month sees less than 60 mm of precipitation and also less than of average monthly precipitation. In essence, a tropical monsoon climate tends to either see more rainfall than a tropical savanna climate or have less pronounced dry seasons. Additionally, a tropical monsoon climate tends to see less variance in temperatures during the course of the year than a tropical savanna climate. This climate has a driest month which nearly always occurs at or soon after the "winter" solstice for that side of the equator.[1]

Versions
There are generally two versions of a tropical monsoon climate:
- Less pronounced dry seasons. Regions with this variation of the tropical monsoon climate typically see copious amounts of rain during the wet season(s), usually in the form of frequent thunderstorms. However, unlike most tropical savanna climates, a sizeable amount of precipitation also falls during the dry season(s). In essence, this version of the tropical monsoon climate generally has less pronounced dry seasons than tropical savanna climates.
- Extraordinarily rainy wet seasons and pronounced dry seasons. This variation features pronounced dry seasons similar in length and character to dry seasons observed in tropical savanna climates. However, this is followed by a sustained period (or sustained periods) of extraordinary rainfall. In some instances, up to (and sometimes in excess of) 1,000 mm of precipitation is observed per month for two or more consecutive months. Tropical savanna climates generally do not see this level of sustained rainfall.
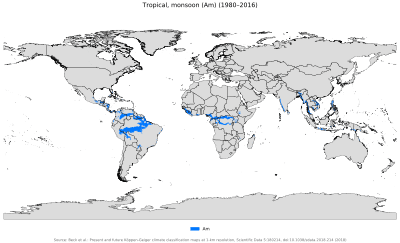
Distribution
Tropical monsoon climates are most commonly found in South and Central America. However, there are sections of South Asia, Southeast Asia, Africa (particularly West and Central Africa), the Caribbean, North America, and Australia that also feature this climate.
Factors
The major controlling factor over a tropical monsoon climate is its relationship to the monsoon circulation. The monsoon is a seasonal change in wind direction. In Asia, during the summer (or high-sun season) there is an onshore flow of air (air moving from ocean towards land). In the “winter” (or low-sun season) an offshore air flow (air moving from land toward water) is prevalent. The change in direction is due to the difference in the way water and land heat.
Changing pressure patterns that affect the seasonality of precipitation also occur in Africa though it generally differs from the way it operates in Asia. During the high-sun season, the Intertropical convergence zone (ITCZ) induces rain. During the low-sun season, the subtropical high creates dry conditions. The monsoon climates of Africa, and the Americas for that matter, are typically located along tradewind coasts.
Cities with a tropical monsoon climate
- Cairns, Australia
- Calamba, Philippines
- Chittagong, Bangladesh
- Conakry, Guinea
- Kochi, Kerala, India
- Jakarta, Indonesia
- Malé, Maldives
- Miami, United States
- Port Harcourt, Nigeria
- Recife, Brazil
- San Juan, Puerto Rico
- Santo Domingo, Dominican Republic
- Taitung, Taiwan
- Yangon, Myanmar
- Hue, Vietnam
- Da Nang, Vietnam
Charts of selected cities
| Chittagong | ||||||||||||||||||||||||||||||||||||||||||||||||||||||||||||
|---|---|---|---|---|---|---|---|---|---|---|---|---|---|---|---|---|---|---|---|---|---|---|---|---|---|---|---|---|---|---|---|---|---|---|---|---|---|---|---|---|---|---|---|---|---|---|---|---|---|---|---|---|---|---|---|---|---|---|---|---|
| Climate chart (explanation) | ||||||||||||||||||||||||||||||||||||||||||||||||||||||||||||
| ||||||||||||||||||||||||||||||||||||||||||||||||||||||||||||
| ||||||||||||||||||||||||||||||||||||||||||||||||||||||||||||
| Conakry | ||||||||||||||||||||||||||||||||||||||||||||||||||||||||||||
|---|---|---|---|---|---|---|---|---|---|---|---|---|---|---|---|---|---|---|---|---|---|---|---|---|---|---|---|---|---|---|---|---|---|---|---|---|---|---|---|---|---|---|---|---|---|---|---|---|---|---|---|---|---|---|---|---|---|---|---|---|
| Climate chart (explanation) | ||||||||||||||||||||||||||||||||||||||||||||||||||||||||||||
| ||||||||||||||||||||||||||||||||||||||||||||||||||||||||||||
| ||||||||||||||||||||||||||||||||||||||||||||||||||||||||||||
| Manaus | ||||||||||||||||||||||||||||||||||||||||||||||||||||||||||||
|---|---|---|---|---|---|---|---|---|---|---|---|---|---|---|---|---|---|---|---|---|---|---|---|---|---|---|---|---|---|---|---|---|---|---|---|---|---|---|---|---|---|---|---|---|---|---|---|---|---|---|---|---|---|---|---|---|---|---|---|---|
| Climate chart (explanation) | ||||||||||||||||||||||||||||||||||||||||||||||||||||||||||||
| ||||||||||||||||||||||||||||||||||||||||||||||||||||||||||||
| ||||||||||||||||||||||||||||||||||||||||||||||||||||||||||||
| Miami | ||||||||||||||||||||||||||||||||||||||||||||||||||||||||||||
|---|---|---|---|---|---|---|---|---|---|---|---|---|---|---|---|---|---|---|---|---|---|---|---|---|---|---|---|---|---|---|---|---|---|---|---|---|---|---|---|---|---|---|---|---|---|---|---|---|---|---|---|---|---|---|---|---|---|---|---|---|
| Climate chart (explanation) | ||||||||||||||||||||||||||||||||||||||||||||||||||||||||||||
| ||||||||||||||||||||||||||||||||||||||||||||||||||||||||||||
| ||||||||||||||||||||||||||||||||||||||||||||||||||||||||||||
References
- McKnight, Tom L; Hess, Darrel (2000). "Climate Zones and Types". Physical Geography: A Landscape Appreciation. Upper Saddle River, New Jersey: Prentice Hall. ISBN 978-0-13-020263-5.
- "Average Conditions - Chittagong, Bangladesh". BBC Weather. Archived from the original on 11 March 2006. Retrieved 25 June 2018.
- "Climatological Normals of Conakry". Hong Kong Observatory. Retrieved 2014-02-12.
- "Weather Information for Manaus". World Meteorological Organization. Retrieved 25 June 2018.
- "Climatological Information for Manaus, Brazil". Hong Kong Observatory. 20 December 2012. Retrieved 25 June 2018.
- "Weather Information for Miami, Florida". World Meteorological Organization. Retrieved 25 June 2018.