List of cities in Bavaria by population
The following list sorts all cities in the German state of Bavaria with a population of more than 20,000.[1] As of December 31, 2017, 74 cities fulfill this criterion and are listed here. This list refers only to the population of individual municipalities within their defined limits, which does not include other municipalities or suburban areas within urban agglomerations.
List
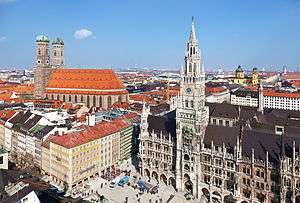
Munich

Nuremberg
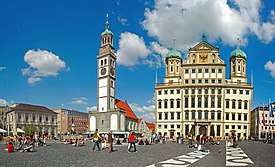
Augsburg
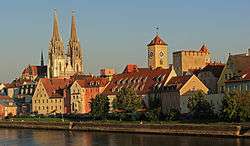
Regensburg
Ingolstadt
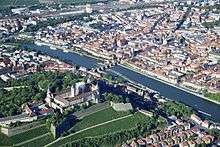
Würzburg
Fürth
Erlangen
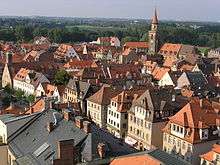
Bamberg
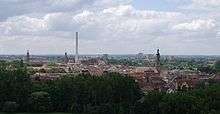
Schweinfurt
The following table lists the 74 cities in Bavaria with a population of at least 20,000 on December 31, 2017, as estimated by the Federal Statistical Office of Germany.[2] A city is displayed in bold if it is a state or federal capital.
- The city rank by population as of December 31, 2017, as estimated by the Federal Statistical Office of German[2]
- The city name[2]
- The name of the district (Landkreis) in which the city lies (some cities are districts on their own called urban districts)[2]
- The city population as of December 31, 2017, as estimated by the Federal Statistical Office of Germany[2]
- The city population as of May 9, 2011, as enumerated by the 2011 European Union census[3]
- The city land area as of December 31, 2017[2]
- The city population density as of December 31, 2017 (residents per unit of land area)[2]
- Yearly population growth since 2011
| 2017 Rank |
City | district | 2017 estimate | 2011 Census | 2017 land area | 2017 pop. density | growth (2011–2017) |
|---|---|---|---|---|---|---|---|
| 1 | Munich | urban district | 1,456,039 | 1,348,335 | 311 km² | 4,686/km² | +1.16% |
| 2 | Nuremberg | urban district | 515,201 | 486,314 | 186 km² | 2,763/km² | +0.87% |
| 3 | Augsburg | urban district | 292,851 | 267,767 | 147 km² | 1,994/km² | +1.36% |
| 4 | Regensburg | urban district | 150,894 | 135,403 | 80.8 km² | 1,866/km² | +1.64% |
| 5 | Ingolstadt | urban district | 135,244 | 124,927 | 133 km² | 1,014/km² | +1.20% |
| 6 | Würzburg | urban district | 126,635 | 124,297 | 87.6 km² | 1,446/km² | +0.28% |
| 7 | Fürth | urban district | 126,526 | 115,613 | 63.4 km² | 1,997/km² | +1.37% |
| 8 | Erlangen | urban district | 110,998 | 103,719 | 77.0 km² | 1,442/km² | +1.03% |
| 9 | Bamberg | urban district | 77,179 | 70,635 | 54.6 km² | 1,413/km² | +1.34% |
| 10 | Bayreuth | urban district | 73,999 | 70,808 | 66.9 km² | 1,106/km² | +0.67% |
| 11 | Landshut | urban district | 71,193 | 63,544 | 65.8 km² | 1,081/km² | +1.72% |
| 12 | Aschaffenburg | urban district | 69,928 | 67,359 | 62.5 km² | 1,120/km² | +0.56% |
| 13 | Kempten (Allgäu) | urban district | 68,330 | 64,078 | 63.3 km² | 1,080/km² | +0.97% |
| 14 | Rosenheim | urban district | 63,080 | 59,329 | 37.2 km² | 1,695/km² | +0.93% |
| 15 | Neu-Ulm | Neu-Ulm (district) | 57,727 | 52,706 | 81.0 km² | 713.1/km² | +1.38% |
| 16 | Schweinfurt | urban district | 53,437 | 52,143 | 35.7 km² | 1,497/km² | +0.37% |
| 17 | Passau | urban district | 51,781 | 48,649 | 69.6 km² | 744.4/km² | +0.94% |
| 18 | Freising | Freising (district) | 48,318 | 44,578 | 88.6 km² | 545.4/km² | +1.22% |
| 19 | Straubing | urban district | 47,586 | 44,488 | 67.6 km² | 704.0/km² | +1.02% |
| 20 | Dachau | Dachau (district) | 47,255 | 43,402 | 35.0 km² | 1,352/km² | +1.29% |
| 21 | Hof | urban district | 45,950 | 44,759 | 58.0 km² | 792.0/km² | +0.40% |
| 22 | Kaufbeuren | urban district | 43,478 | 41,550 | 40.0 km² | 1,086/km² | +0.68% |
| 23 | Memmingen | urban district | 43,470 | 41,241 | 70.1 km² | 620.0/km² | +0.79% |
| 24 | Weiden in der Oberpfalz | urban district | 42,543 | 41,746 | 70.6 km² | 602.8/km² | +0.28% |
| 25 | Amberg | urban district | 42,248 | 41,911 | 50.1 km² | 842.8/km² | +0.12% |
| 26 | Ansbach | urban district | 41,652 | 39,491 | 99.9 km² | 416.9/km² | +0.80% |
| 27 | Coburg | urban district | 41,236 | 41,023 | 48.3 km² | 853.9/km² | +0.08% |
| 28 | Schwabach | urban district | 40,781 | 38,469 | 40.8 km² | 999.5/km² | +0.88% |
| 29 | Germering | Fürstenfeldbruck (district) | 40,285 | 37,724 | 21.6 km² | 1,865/km² | +0.99% |
| 30 | Neumarkt in der Oberpfalz | Neumarkt (district) | 39,822 | 38,362 | 79.0 km² | 504.0/km² | +0.56% |
| 31 | Fürstenfeldbruck | Fürstenfeldbruck (district) | 37,202 | 33,379 | 32.5 km² | 1,144/km² | +1.64% |
| 32 | Erding | Erding (district) | 36,382 | 33,528 | 54.6 km² | 666.2/km² | +1.24% |
| 33 | Deggendorf | Deggendorf (district) | 33,373 | 31,491 | 77.1 km² | 432.6/km² | +0.88% |
| 34 | Forchheim | Forchheim (district) | 32,125 | 30,329 | 44.5 km² | 722.7/km² | +0.87% |
| 35 | Friedberg | Aichach-Friedberg | 29,782 | 28,640 | 81.3 km² | 366.5/km² | +0.59% |
| 36 | Neuburg an der Donau | Neuburg-Schrobenhausen | 29,608 | 27,733 | 81.3 km² | 364.2/km² | +0.99% |
| 37 | Landsberg am Lech | Landsberg (district) | 28,865 | 27,324 | 57.9 km² | 498.4/km² | +0.83% |
| 38 | Unterschleißheim | Munich (district) | 28,809 | 25,872 | 14.9 km² | 1,930/km² | +1.63% |
| 39 | Schwandorf | Schwandorf (district) | 28,730 | 27,556 | 124 km² | 232.0/km² | +0.63% |
| 40 | Königsbrunn | Augsburg (district) | 27,850 | 26,997 | 18.4 km² | 1,514/km² | +0.47% |
| 41 | Olching | Fürstenfeldbruck (district) | 27,592 | 24,751 | 29.9 km² | 922.2/km² | +1.65% |
| 42 | Garmisch-Partenkirchen | Garmisch (district) | 27,024 | 25,581 | 206 km² | 131.4/km² | +0.83% |
| 43 | Lauf an der Pegnitz | Nürnberger Land | 26,571 | 25,629 | 59.8 km² | 444.6/km² | +0.54% |
| 44 | Kulmbach | Kulmbach (district) | 26,002 | 26,678 | 92.8 km² | 280.3/km² | –0.39% |
| 45 | Pfaffenhofen an der Ilm | Pfaffenhofen (district) | 25,781 | 23,603 | 92.6 km² | 278.3/km² | +1.34% |
| 46 | Zirndorf | Fürth (district) | 25,307 | 24,752 | 28.8 km² | 879.0/km² | +0.33% |
| 47 | Lindau (Bodensee) | Lindau (district) | 25,253 | 24,491 | 33.1 km² | 763.9/km² | +0.46% |
| 48 | Roth | Roth (district) | 25,220 | 24,348 | 96.3 km² | 261.8/km² | +0.53% |
| 49 | Geretsried | Bad Tölz-Wolfratshausen | 24,892 | 23,042 | 24.6 km² | 1,012/km² | +1.17% |
| 50 | Unterhaching | Munich (district) | 24,864 | 22,298 | 10.4 km² | 2,398/km² | +1.65% |
| 51 | Waldkraiburg | Mühldorf (district) | 23,435 | 21,435 | 21.6 km² | 1,087/km² | +1.35% |
| 52 | Starnberg | Starnberg (district) | 23,339 | 22,165 | 61.9 km² | 377.3/km² | +0.78% |
| 53 | Vaterstetten | Ebersberg (district) | 23,229 | 21,069 | 34.1 km² | 681.6/km² | +1.48% |
| 54 | Herzogenaurach | Erlangen-Höchstadt | 23,098 | 22,214 | 47.6 km² | 485.0/km² | +0.59% |
| 55 | Gersthofen | Augsburg (district) | 22,430 | 20,743 | 34.0 km² | 659.5/km² | +1.18% |
| 56 | Weilheim in Oberbayern | Weilheim-Schongau | 22,355 | 21,149 | 55.5 km² | 402.8/km² | +0.84% |
| 57 | Bad Kissingen | Bad Kissingen (district) | 22,245 | 20,993 | 69.9 km² | 318.1/km² | +0.88% |
| 58 | Senden | Neu-Ulm (district) | 22,133 | 21,560 | 25.2 km² | 877.9/km² | +0.40% |
| 59 | Neusäß | Augsburg (district) | 22,038 | 21,052 | 25.2 km² | 873.8/km² | +0.69% |
| 60 | Sonthofen | Oberallgäu | 21,522 | 21,105 | 46.5 km² | 462.3/km² | +0.29% |
| 61 | Ottobrunn | Munich (district) | 21,503 | 20,082 | 5.2 km² | 4,111/km² | +1.03% |
| 62 | Puchheim | Fürstenfeldbruck (district) | 21,396 | 19,613 | 12.2 km² | 1,748/km² | +1.32% |
| 63 | Kitzingen | Kitzingen (district) | 21,346 | 20,237 | 47.0 km² | 454.3/km² | +0.81% |
| 64 | Aichach | Aichach-Friedberg | 21,169 | 20,247 | 92.8 km² | 228.0/km² | +0.67% |
| 65 | Karlsfeld | Dachau (district) | 21,141 | 18,117 | 15.6 km² | 1,354/km² | +2.35% |
| 66 | Haar | Munich (district) | 21,000 | 19,231 | 12.9 km² | 1,628/km² | +1.33% |
| 67 | Traunreut | Traunstein (district) | 20,934 | 19,941 | 45.1 km² | 464.6/km² | +0.73% |
| 68 | Gauting | Starnberg (district) | 20,556 | 19,294 | 55.5 km² | 370.4/km² | +0.96% |
| 69 | Günzburg | Günzburg (district) | 20,355 | 19,436 | 55.4 km² | 367.4/km² | +0.70% |
| 70 | Nördlingen | Donau-Ries | 20,236 | 19,051 | 68.1 km² | 297.2/km² | +0.91% |
| 71 | Traunstein | Traunstein (district) | 20,172 | 18,635 | 48.6 km² | 415.3/km² | +1.20% |
| 72 | Lichtenfels | Lichtenfels (district) | 20,158 | 20,204 | 122 km² | 165.0/km² | –0.03% |
| 73 | Mühldorf am Inn | Mühldorf am Inn (district) | 20,123 | 16,807 | 29.4 km² | 684.0/km² | +2.75% |
| 74 | Neufahrn bei Freising | Freising (district) | 20,096 | 18,392 | 45.5 km² | 441.3/km² | +1.34% |
External links
References
- "Laufende Stadtbeobachtung – Raumabgrenzungen" (in German). Bundesinstitut für Bau-, Stadt- und Raumforschung. Archived from the original on October 1, 2017. Retrieved Feb 15, 2018.
- "Homepage - Federal Statistical Office (Destatis)". www.destatis.de.
- "Bevölkerung nach Geschlecht für Kreise und kreisfreie Städte" (XLS) (in German). Wiesbaden: Federal Statistical Office of Germany. April 10, 2014.
| States |  | |
|---|---|---|
| City-states | ||
This article is issued from Wikipedia. The text is licensed under Creative Commons - Attribution - Sharealike. Additional terms may apply for the media files.