Islam in North Macedonia
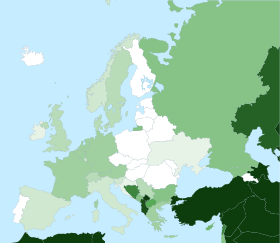
Muslims in North Macedonia represent one third of the nation's total population,[2][3] making Islam the second most widely professed religion in the country. Muslims in North Macedonia follow Sunni Islam of the Hanafi madhhab. Some northwestern and western regions of the country have Muslim majorities. A large majority of all the Muslims in the country are ethnic Albanians, with the rest being primarily Turks, Romani, Bosniaks or Torbeš.
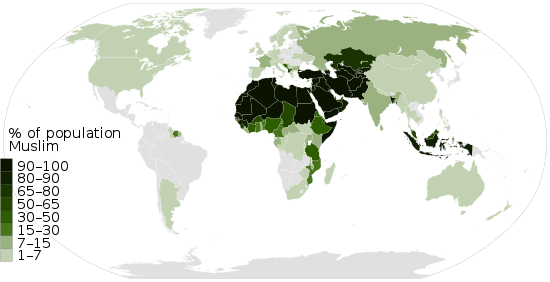
| 90–100% | |
| 70–80% | Kazakhstan |
| 50–70% | |
| 30–50% | North Macedonia |
| 10–20% | |
| 5–10% | |
| 4–5% | |
| 2–4% | |
| 1–2% | |
| < 1% |
Population
Ethnicity
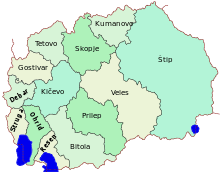
Albanian Muslims, forming roughly 25% of the nation's total population and most of the Muslim population, live mostly in the Polog and western regions of the country. The Turks, who make up about 4% of the country's total population, are scattered throughout the country, but mostly in major cities, as are Roma Muslims. Bosniaks are mostly concentrated within Skopje. Muslims of Macedonian ethnicity number roughly 40,000 to 100,000 and can be found in the western part of North Macedonia in the Centar Župa, Debar, Struga and Plasnica areas.[4]
| Ethnic group | Population 1981 | Population 2002 |
|---|---|---|
| Albanians | 377,208[5][6] | 509,083[6][7] |
| Turks | 86,591[5][6] | 77,959[6][7] |
| Romani | 43,125[5][6] | 53,879[6][7] |
| Macedonian Muslims | 39,513[6] | 2,553[6][8] |
| Bosniaks | 17,018[6][7] |
Historical population
The following table shows the Muslim population and percentage for each given year. The Muslim percentage in North Macedonia generally decreased from 1904 to 1961 but began to rise again due to high fertility rate among Muslim families, reaching 33.33% in 2002. According to the 2002 Census, 46.5% of the children aged 0–4 were Muslim.[9] In 2011, 28.6% of the population were Muslim.[10]
| Year | Muslim population | Muslim percentage |
|---|---|---|
| 1904 | 634,000[11] | 36.76% |
| 1912 | 384,000[11] | 33.47% |
| 1921 | 269,000[11] | 31.43% |
| 1948 | 314,603[11] | 27.29% |
| 1953 | 388,515[11] | 29.78% |
| 1961 | 338,200[11] | 24.05% |
| 1971 | 414,176[11] | 25.14% |
| 1981 | 546,437[11] | 28.62% |
| 1991 | 611,326[11] | 30.06% |
| 1994 | 581,203[11][12] | 30.04% |
| 2002 | 674,015[11][9] | 33.33% |
| 2011 | 808,512 | 28.6%[13][10] |
Geographical distribution
| Municipality | Population (2002) | Muslims (2002) | Percentage (%) |
|---|---|---|---|
| Tetovo | 70,841 | 49,927 | 70.5% |
| Gostivar | 49,545 | 36,045 | 72.8% |
| Centar | 82,604 | 34,325 | 41.6% |
| Čair | 68,395 | 32,877 | 48.1% |
| Kumanovo | 103,205 | 31,758 | 30.8% |
| Lipkovo | 27,058 | 26,351 | 97.4% |
| Želino | 24,390 | 24,210 | 99.3% |
| Saraj | 24,253 | 22,768 | 93.9% |
| Tearce | 22,454 | 19,508 | 86.9% |
| Struga | 36,892 | 18,967 | 51.4% |
| Debar | 17,952 | 17,083 | 95.2% |
| Studeničani | 17,246 | 16,828 | 97.6% |
| Negotino-Pološko | 16,813 | 16,720 | 99.4% |
| Gazi Baba | 72,222 | 15,968 | 22.1% |
| Šuto Orizari | 17,357 | 15,231 | 87.8% |
| Bogovinje | 14,555 | 14,445 | 99.2% |
| Kamenjane | 14,442 | 14,365 | 99.5% |
| Kičevo | 30,138 | 13,703 | 45.5% |
| Čegrane | 12,310 | 11,967 | 97.2% |
| Zajas | 11,605 | 11,303 | 97.4% |
| Kondovo | 11,155 | 11,047 | 99.0% |
| Aračinovo | 11,992 | 10,925 | 91.1% |
| Oslomej | 10,425 | 10,260 | 98.4% |
| Veles | 57,602 | 9,786 | 17.0% |
| Brvenica | 15,855 | 9,781 | 61.7% |
| Rostuša | 9,451 | 8,940 | 94.6% |
| Velešta | 8,156 | 8,072 | 99.0% |
| Labuništa | 8,935 | 8,061 | 90.2% |
| Dolna Banjica | 9,467 | 7,847 | 82.9% |
| Džepčište | 7,919 | 7,789 | 98.4% |
| Šipkovica | 7,820 | 7,783 | 99.5% |
| Delogoždi | 7,884 | 7,724 | 98.0% |
| Ohrid | 54,380 | 7,684 | 14.1% |
| Vrapčište | 8,586 | 7,525 | 87.6% |
| Bitola | 86,408 | 7,043 | 8.2% |
| Dolneni | 11,583 | 6,688 | 57.7% |
| Centar Župa | 6,299 | 6,215 | 98.7% |
| Vrutok | 5,999 | 5,159 | 86.0% |
| Kisela Voda | 125,379 | 4,654 | 3.7 |
| Plasnica | 4,545 | 4,465 | 98.2% |
| Prilep | 73,351 | 4,393 | 6.0% |
| Radoviš | 24,498 | 4,341 | 17.7% |
| Resen | 16,825 | 3,927 | 23.3% |
| Đorče Petrov | 41,490 | 3,792 | 9.1% |
| Srbinovo | 3,709 | 3,593 | 96.9% |
| Petrovec | 8,255 | 3,564 | 43.2% |
| Štip | 47,796 | 3,555 | 7.4% |
| Karpoš | 59,810 | 3,107 | 5.2% |
| Strumica | 45,087 | 3,038 | 6.7% |
| Kruševo | 9,684 | 2,514 | 26.0% |
| Јegunovce | 7,227 | 2,511 | 34.7% |
| Sopište | 9,522 | 2,310 | 24.3% |
| Kočani | 33,689 | 2,273 | 6.7% |
| Vasilevo | 12,122 | 2,196 | 18.1% |
| Vratnica | 3,563 | 2,181 | 61.2% |
| Čučer-Sandevo | 8,493 | 1,954 | 23.0% |
| Žitoše | 2,128 | 1,917 | 90.1% |
| Zelenikovo | 4,077 | 1,491 | 36.6% |
| Vinica | 17,914 | 1,489 | 8.3% |
| Valandovo | 11,890 | 1,355 | 11.4% |
| Bistrica | 5,042 | 1,320 | 26.2% |
| Kavadarci | 38,391 | 1,161 | 3.0% |
| Čaška | 2,878 | 1,006 | 35.0% |
| Murtino | 6,544 | 953 | 14.6% |
| Negotino | 19,212 | 912 | 4.7% |
| Topolčani | 2,923 | 859 | 29.4% |
| Gradsko | 3,760 | 815 | 21.7% |
| Delčevo | 17,505 | 773 | 4.4% |
| Ilinden | 15,894 | 748 | 4.7% |
| Karbinci | 4,012 | 729 | 18.2% |
| Pehčevo | 5,517 | 702 | 12.7% |
| Bosilovo | 12,457 | 618 | 5.0% |
| Berovo | 13,941 | 556 | 4.0% |
| Kriva Palanka | 20,820 | 530 | 2.5% |
| Konče | 3,536 | 521 | 14.7% |
| Star Dojran | 3,426 | 483 | 14.1% |
| Drugovo | 3,249 | 448 | 13.8% |
| Mavrovi Anovi | 984 | 415 | 42.2% |
| Demir Kapija | 4,545 | 409 | 9.0% |
| Capari | 1,424 | 320 | 22.5% |
| Vraneštica | 1,322 | 287 | 21.7% |
| Demir Hisar | 7,178 | 280 | 3.9% |
| Lozovo | 2,858 | 253 | 8.9% |
| Dobruševo | 2,174 | 218 | 10.0% |
| Kukliš | 4,449 | 203 | 4.6% |
| Makedonski Brod | 5,588 | 182 | 3.3% |
| Kratovo | 10,441 | 173 | 1.7% |
| Mešeišta | 2,567 | 163 | 6.3% |
| Sveti Nikole | 18,497 | 159 | 0.9% |
| Kukurečani | 2,511 | 69 | 2.7% |
| Bogdanci | 8,707 | 60 | 0.7% |
| Gevgelija | 20,362 | 51 | 0.3% |
| Probištip | 12,765 | 49 | 0.4% |
| Bogomila | 1,252 | 48 | 3.8% |
| Novaci | 2,478 | 48 | 1.9% |
| Mogila | 4,536 | 48 | 1.1% |
| Lukovo | 1,509 | 43 | 2.8% |
| Rankovce | 4,144 | 26 | 0.6% |
| Makedonska Kamenica | 2,567 | 23 | 0.9% |
| Podareš | 3,746 | 13 | 0.3% |
| Krivogaštani | 6,007 | 8 | 0.1% |
| Novo Selo | 11,966 | 8 | 0.1% |
| Rosoman | 4,141 | 6 | 0.1% |
| Belčišta | 2,940 | 4 | 0.1% |
| Konopište | 350 | 3 | 0.9% |
| Vevčani | 2,433 | 3 | 0.1% |
| Staro Nagoričane | 4,258 | 3 | 0.1% |
| Staravina | 316 | 1 | 0.3% |
| Bač | 755 | 1 | 0.1% |
| Izvor | 1,049 | 1 | 0.1% |
| Orašac | 1,252 | 1 | 0.1% |
| Sopotnica | 2,319 | 1 | 0.0% |
| Miravci | 2,626 | 1 | 0.0% |
| Orizari | 4,403 | 1 | 0.0% |
| Obleševo | 5,071 | 1 | 0.0% |
| Zletovo | 3,428 | 0 | 0.0% |
| Zrnovci | 3,264 | 0 | 0.0% |
| Češinovo | 2,419 | 0 | 0.0% |
| Blatec | 2,024 | 0 | 0.0% |
| Klečevce | 1,609 | 0 | 0.0% |
| Samokov | 1,553 | 0 | 0.0% |
| Kosel | 1,369 | 0 | 0.0% |
| Vitolište | 494 | 0 | 0.0% |
| Macedonia (total) | 2,022,547 | 674,015 | 33.3% |
Gallery


See also
References
- "Religious Composition by Country, 2010-2050". Pew Research Center. 12 April 2015. Retrieved 22 October 2017.
- "naslovna-10PUB" (PDF). Retrieved 2018-06-22.
- "Macedonia country profile". 22 February 2018 – via www.bbc.co.uk.
- Nielsen, Akgonul & Alibasic 2009, 221
- Ortakovski, Vladimir T. Interethnic Relations and Minorities in the Republic of Macedonia (PDF). Southeast European Politics. 2. pp. 25–45.
- "Statistical Yearbook of the Republic of Macedonia, 2016, p. 67" (PDF). Republic of Macedonia, State Statistical Office. 2016. Retrieved 13 June 2017.
- "Census of Pupulation, Households and Dwellings in the Republic of Macedonia, 2002, p. 591" (PDF). Republic of Macedonia, State Statistical Office. 2002. Retrieved 20 November 2016.
- Statistical Yearbook of the Republic of Macedonia, 2014, p. 67, Retrieved 11 December 2016
- Census of Pupulation, Households and Dwellings in the Republic of Macedonia, 2002, p. 518
- "Strategies of symbolic nation-building in West Balkan states: intents and results (completed) - Department of Literature, Area Studies and European Languages". www.hf.uio.no. Retrieved 2018-01-19.
- Kettani, Houssain (2010). "Muslim Population in Europe: 1950 – 2020" (PDF). International Journal of Environmental Science and Development vol. 1, no. 2, p. 156. Retrieved 17 November 2016.
- Coughlin, Kathryn M. (2006). Muslim Cultures Today, A Reference Guide. Greenwood Press, Westport, Connecticut, London. p. 16.
- "Religious Composition by Country, 2010-2050" in: Pew Research Center, Retrieved 10 November 2016
North Macedonia articles | ||||||||||||
|---|---|---|---|---|---|---|---|---|---|---|---|---|
| History |
|  | ||||||||||
| Geography | ||||||||||||
| Politics |
| |||||||||||
| Economy |
| |||||||||||
| Society |
| |||||||||||
| ||||||||||||