History of photovoltaic growth
The history of photovoltaic growth includes previous forecast and annual deployment figures by country.
Deployment reports
Most PV deployment figures in this article are provided by the European Photovoltaic Industry Association in the "Global Outlook for Photovoltaics" report, the Observatoire des énergies renouvelables or EurObserv'ER's "Photovoltaic Barometer" report, and the IEA-PVPS (photovoltaic power systems) "Snapshot" and "Trends" report.
|
<0.1, n/a
0.1–1
1–10
10–50 |
50–100
100–150
150–200
200–300 |
300–450
>450 |
- EPIA
- 2014 – Global Market Outlook for Photovoltaics 2014–2018[1]
- 2013 – Global Market Outlook for Photovoltaics 2013–2017[2]
- 2012 – Global Market Outlook for Photovoltaics until 2016[3]
- 2011 – Global Market Outlook for Photovoltaics until 2015[4]
- 2010 – Global Market Outlook for Photovoltaics until 2014[5]
- 2009 – Global Market Outlook for Photovoltaics until 2013[6]
- 2008 – Global Market Outlook for Photovoltaics until 2012[7]
- The European Photovoltaic Industry Association (EPIA) represents members of the entire PV industry from silicon producers to cells and module manufactures and PV systems installers to PV electricity generation as well as marketing and sales. EPIA releases its annual Global Market Outlook for Photovoltaics report in May/June.
- PV-Barometer
- EUROBSER'VER (Observatoire des énergies renouvelables) was set up in 1980, and is composed of engineers and experts releasing the Photovoltaic Barometer report containing early, year-end PV deployment figures for the 28 member states of the European Union.[14] Eurobserver works closely together with several French ministries and is co-founded by the European Commission's IEE programm.[15]
- 2015 – Snapshot of Global PV 1992-2014[16]
- 2014 – Trends 2014 in Photovoltaic Applications – Survey report of selected IEA countries between 1992 and 2013[17]
- 2014 – Snapshot of Global PV 1992-2013[18]
- 2014 – Trends 2013 in Photovoltaic Applications – Survey report of selected IEA countries between 1992 and 2012[19]
- 2013 – Snapshot of Global PV 1992-2012[20]
- 2011 – Trends in Photovoltaic Applications – Survey report of selected IEA countries between 1992 and 2010[21]
- 2010 – Trends in Photovoltaic Applications – Survey report of selected IEA countries between 1992 and 2009[22]
- 2009 – Trends in Photovoltaic Applications – Survey report of selected IEA countries between 1992 and 2008[23]
- 2007 – Trends in Photovoltaic Applications – Survey report of selected IEA countries between 1992 and 2006[24]
- The IEA Photovoltaic Power Systems Programme (PVPS) is one of the collaborative R&D agreements established within the IEA and, since its establishment in 1993, the PVPS participants have been conducting a variety of joint projects in the application of photovoltaic conversion of solar energy into electricity. Its annual "Snapshot" report is released in early April and provides the first and detailed figures of worldwide PV-deployment of the previous year. An overview of all international statistics PDF reports since 1995 can be found on IEA-PVPS' Statistic Reports website.
| Report | Cumulative (MWp) | Installed (MWp) | Year-End Period |
Release date | Type | Ref |
|---|---|---|---|---|---|---|
| IEA-PVPS snapshot | >96,500 | >28,400 | 2012 | May 6, 2013 | preliminary | [20]:3 |
| EPIA outlook | 102,156 | 31,095 | 2012 | May 2013 | detailed | [2]:13 |
| IEA-PVPS trends | 99,300 | 29,300 | 2012 | November 29, 2013 | final | [19]:11 |
| EPIA outlook | 100,504 | 30,011 | 2012 | May 2014 | retroactive | [1]:17–18 |
| IEA-PVPS snapshot | >134,000 | >36,900 | 2013 | March 31, 2014 | preliminary | [18]:14 |
| EPIA outlook | 138,856 | 38,352 | 2013 | May 2014 | detailed | [1]:17–18 |
| IEA-PVPS trends | 139,795 | 39,953 | 2013 | October 12, 2014 | final | [17]:34 |
| EPIA outlook | – | – | 2013 | May 2015 | retroactive | – |
| IEA-PVPS snapshot | >177,000 | >38,700 | 2014 | March 2015 | preliminary | [16] |
| EPIA outlook | – | – | 2014 | May 2015 | detailed | – |
| IEA-PVPS trends | – | – | 2014 | October 2015 | final | – |
| EPIA outlook | – | – | 2014 | May 2016 | retroactive | – |
Deployment by country
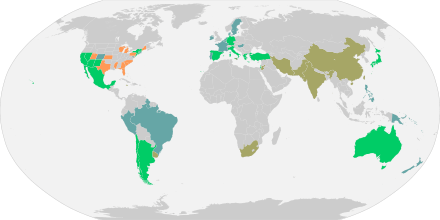
Reached grid-parity before 2014
Reached grid-parity after 2014
Reached grid-parity only for peak prices
U.S. states poised to reach grid-parity
Source: Deutsche Bank, as of February 2015
2016 

2015 


2014 


2013 .svg.png)


2012 


2011 .svg.png)

2010 .svg.png)


2009 
2008 

2004 

2016 2013 2011 2010
- 2015
- See section Forecast for projected photovoltaic deployment in 2015
- 2014
| Country | Capacity 2014 |
Added 2014 |
Source(a) |
|---|---|---|---|
| 4,136 | 910 | IEA-PVPS snapshot | |
| 767 | 140 | EPIA-GMO | |
| 3,115 | 75 | IEA-PVPS AR2014 | |
| n.a. | 22 | [25] | |
| 1,022 | 2 | IEA-PVPS snapshot | |
| 1,710 | 500 | IEA-PVPS snapshot | |
| 368 | 365 | IEA-PVPS snapshot | |
| 28,050 | 10,640 | IEA-PVPS AR2014 | |
| 33 | 13 | EPIA-GMO | |
| 65 | 30 | PV Barometer | |
| 2,134 | 2 | IEA-PVPS snapshot | |
| 608 | 47 | EPIA-GMO | |
| 10 | – | PV Barometer | |
| 5,632 | 927 | EPIA-GMO | |
| 38,235 | 1,898 | EPIA-GMO | |
| 2,596 | 17 | EPIA-GMO | |
| n.a. | 6 | [25] | |
| n.a. | 5 | [25] | |
| 38 | 3 | PV Barometer | |
| 2,936 | 616 | IEA-PVPS snapshot | |
| 1 | 0.1 | PV Barometer | |
| 731 | 250 | IEA-PVPS snapshot | |
| 18,313 | 385 | EPIA-GMO | |
| 23,300 | 9,700 | IEA-PVPS snapshot | |
| 2 | – | PV Barometer | |
| 68 | – | PV Barometer | |
| 110 | 15 | PV Barometer | |
| 160 | 87 | IEA-PVPS snapshot | |
| 54 | 26 | PV Barometer | |
| 176 | 64 | IEA-PVPS snapshot | |
| 1,042 | 400 | EPIA-GMO | |
| 13 | 2 | IEA-PVPS snapshot | |
| n.a. | n.a. | not yet avail. | |
| 34 | 27 | EPIA-GMO | |
| 414 | 115 | EPIA-GMO | |
| 1,223 | 72 | EPIA-GMO | |
| n.a. | n.a. | not yet avail. | |
| 524 | 0.4 | EPIA-GMO | |
| 256 | 8 | PV Barometer | |
| 922 | 800 | IEA-PVPS snapshot | |
| 2,384 | 909 | IEA-PVPS snapshot | |
| 5,388 | 22 | EPIA-GMO | |
| 79 | 36 | IEA-PVPS snapshot | |
| 1,046 | 320 | EPIA-GMO | |
| 776 | 400 | IEA-PVPS snapshot | |
| 1,299 | 475 | IEA-PVPS snapshot | |
| 58 | 40 | IEA-PVPS snapshot | |
| n.a. | n.a. | not yet avail. | |
| 5,230 | 2,402 | EPIA-GMO | |
| 18,280 | 6,201 | IEA-PVPS snapshot | |
(a) Data sources:
(b) Reconverted to watt-peak from MWAC[lower-alpha 1][16]:11 | |||
| Photovoltaic Barometer report – PV capacity in the European Union in 2014[8]:7–10 | |||||||||
|---|---|---|---|---|---|---|---|---|---|
| Country | Added 2014 (MW) | Total 2014 (MW) | Generation 2014 | ||||||
| off- grid |
on- grid |
Capacity | off- grid |
on- grid |
Capacity | Watt per capita |
in GWh |
in % | |
| – | 140.0 | 140.0 | 4.5 | 766.0 | 770.5 | 90.6 | 766.0 | – | |
| – | 65.2 | 65.2 | 0.1 | 3,105.2 | 3,105.3 | 277.2 | 2,768.0 | – | |
| – | 1.3 | 1.3 | 0.7 | 1,019.7 | 1,020.4 | 140.8 | 1,244.5 | – | |
| 0.2 | 14.0 | 14.2 | 0.7 | 33.5 | 34.2 | 8.1 | 35.3 | – | |
| 0.2 | 29.7 | 30.0 | 1.1 | 63.6 | 64.8 | 75.5 | 104.0 | – | |
| – | – | – | 0.4 | 2,060.6 | 2,061.0 | 196.1 | 2,121.7 | – | |
| 0.1 | 29.0 | 29.1 | 1.5 | 600.0 | 601.5 | 106.9 | 557.0 | – | |
| – | – | – | 0.1 | – | 0.2 | 0.1 | 0.6 | – | |
| – | – | – | 10.0 | 0.2 | 10.2 | 1.9 | 5.9 | – | |
| 0.1 | 974.9 | 975.0 | 10.8 | 5,589.0 | 4,697.6 | 87.6 | 5,500.0 | – | |
| – | 1,899.0 | 1,899.0 | 65.0 | 38,236.0 | 38,301.0 | 474.1 | 34,930.0 | – | |
| – | 16.9 | 16.9 | 7.0 | 2,595.8 | 2,602.8 | 236.8 | 3,856.0 | – | |
| 0.1 | 3.1 | 3.2 | 0.7 | 37.5 | 38.2 | 3.9 | 26.8 | – | |
| 0.0 | 0.0 | 0.1 | 0.9 | 0.2 | 1.1 | 0.2 | 0.7 | – | |
| 1.0 | 384.0 | 385.0 | 13.0 | 18,437.0 | 18,450.0 | 303.5 | 23,299.0 | – | |
| – | – | – | – | 1.5 | 1.5 | 0.8 | 0.0 | – | |
| – | – | – | 0.1 | 68.0 | 68.1 | 23.1 | 73.0 | – | |
| – | 15.0 | 15.0 | – | 110.0 | 110.0 | 200.1 | 120.0 | – | |
| – | 26.0 | 26.0 | – | 54.2 | 54.2 | 127.5 | 57.8 | – | |
| – | 361.0 | 361.0 | 5.0 | 1,095.0 | 1,100.0 | 65.4 | 800.0 | – | |
| 0.5 | 19.7 | 20.2 | 2.9 | 21.5 | 24.4 | 0.6 | 19.2 | – | |
| 1.2 | 115.0 | 116.2 | 5.0 | 414.0 | 419.0 | 40.2 | 631.0 | – | |
| – | 270.5 | 270.5 | – | 1,292.6 | 1,292.6 | 64.8 | 1,355.2 | – | |
| – | 2.0 | 2.0 | 0.1 | 590.0 | 590.1 | 109.0 | 590.0 | – | |
| – | 7.7 | 7.7 | 0.1 | 255.9 | 256.0 | 124.2 | 244.6 | – | |
| 0.3 | 21.0 | 21.3 | 25.5 | 4,761.8 | 4,787.3 | 102.7 | 8,211.0 | – | |
| 1.1 | 35.1 | 36.2 | 9.5 | 69.9 | 79.4 | 8.2 | 71.5 | – | |
| – | 2,448.0 | 2,448.0 | 2.3 | 5,228.0 | 5,230.3 | 81.3 | 3,931.0 | – | |
| 4.9 | 6,878.4 | 6,883.3 | 167.1 | 86,506.8 | 86,673.9 | 171.5 | 91,319.7 | – | |
| Country | off- grid |
on- grid |
Capacity | off- grid |
on- grid |
Capacity | Watt per capita |
in GWh |
in % |
| Added 2014 (MW) | Total 2014 (MW) | Generation 2014 | |||||||
- 2013
- Worldwide
In 2013, worldwide deployment of solar PV amounted to almost 40 GW (39,953 MW)—an increase of about 35 percent over the previous year. Cumulated capacity increased by 38 percent to more than 139 GW. This is sufficient to generate at least 160 terawatt-hours (TWh) or 0.85 percent of the world's total electricity consumption of 18,400 TWh.[18]:5,13[17]:9
Cumulative PV capacity by region in 2013[1]:17
| Report | Cumulative (MWp) | Installed (MWp) | Release date | Type | Ref |
|---|---|---|---|---|---|
| IEA-PVPS snapshot | >134,000 | >36,900 | April 2014 | preliminary figures | [18]:14 |
| EPIA outlook | 138,856 | 38,352 | June 2014 | detailed figures | [1]:24 |
| IEA-PVPS trends | 139,795 | 39,953 | October 2014 | final figures | [17]:34 |
- Regions
In 2013, Asia has been the fastest growing region, with China and Japan accounting for 49% of worldwide deployment. About a quarter has been installed in Europe (10,975 MW). The remaining quarter of the 38,400 MW deployed in 2013 is split between North America and other countries.
Europe is still the most developed region with a cumulative capacity of 81.5 GW, about 59 percent of the global total, followed by the Asia-Pacific region (APAC), including countries such as Japan, India and Australia with 22 GW or about 16 percent of worldwide cumulative capacity (due to its significance, China is excluded from the APAC region in all PV statistics and listed separately). European solar PV now covers 3 percent of the electricity demand and 6 percent of the peak electricity demand. However, deployment in Europe has slowed down by half compared to the record year of 2011, and will most likely continue to decrease. This is mainly due to the strong decline of new installations in Germany and Italy.[1]:18
Cumulative capacity in the MEA (Middle East and Africa) region and ROW (rest of the world) accounted for less than 3 GW or about 2.2% of the global total. A great untapped potential remains for many of these countries, especially in the Sunbelt.[1]:19,23
- Countries
Added PV capacity by country in 2013[17]:33–34[lower-alpha 2]
In 2013, the world's top installer were China (+12.92 GW), followed by Japan (+6.97 GW) and the United States (+4.75 GW), while Germany remained the world's largest overall producer of power from solar PV, with a total capacity around 36 GW and contributing 5.7% to its net electricity consumption. Italy met more than 7% of its electricity demands with solar PV, thus leading the world in that respect.
|
| |||||||||||||||||||||||||||||||||||||||||||||||||||||||||||||||||||
|
Data from the EPIA's Global Market Outlook 2014-2018 report[1]:24 and partially updated with figures from the IEA-PVPS Trends 2014 report[17]:34 | ||||||||||||||||||||||||||||||||||||||||||||||||||||||||||||||||||||
The top ten leading countries in terms of deployed and overall PV-capacity are shown above. Other mentionable PV deployments above the 100-megawatt mark included France (643 MW), Canada (445 MW), South Korea (445 MW), Thailand (437 MW), The Netherlands (360 MW), Switzerland (319 MW), Ukraine (290 MW), Austria (263 MW), Israel (244 MW), Belgium (237 MW), Taiwan (170 MW) Denmark (156 MW) and Spain (116 MW).[17]:33–34
| Country | Capacity 2013 |
Added 2013 |
Source(A) |
|---|---|---|---|
| 3,226 | 811 | IEA-PVPS trends | |
| 626 | 263 | IEA-PVPS trends | |
| 3,009 | 237 | IEA-PVPS trends | |
| 32 | ? | ? | |
| 1,020 | 10 | EPIA outlook | |
| 1,210 | 445 | IEA-PVPS trends | |
| 3 | 2 | original.[28] Revised cume in 2015[16] | |
| 19,720 | 12,920 | IEA-PVPS trends | |
| 20 | 20 | EPIA outlook | |
| 32 | 15 | EPIA outlook | |
| 2,175 | 88 | EPIA outlook | |
| 563 | 156 | IEA-PVPS trends | |
| 11 | 0 | EPIA outlook | |
| 4,733 | 643 | IEA-PVPS trends | |
| 35,766 | 3,304 | IEA-PVPS trends | |
| 2,579 | 1,043 | EPIA outlook | |
| 22 | 10 | EPIA outlook | |
| 2,320 | 1,115 | IEA-PVPS trends | |
| 3 | 0 | EPIA outlook | |
| 481 | 244 | IEA-PVPS trends | |
| 18,074 | 1,620 | IEA-PVPS trends | |
| 13,599 | 6,968 | IEA-PVPS trends | |
| 1 | 0 | EPIA outlook | |
| 6 | 0 | EPIA outlook | |
| 30 | 0 | EPIA outlook | |
| 73 | 48 | IEA-PVPS trends | |
| 23 | 7 | EPIA outlook | |
| 112 | 60 | IEA-PVPS Trends | |
| 723 | 360 | IEA-PVPS trends | |
| 11 | 1 | IEA-PVPS trends | |
| 7 | 1 | EPIA outlook | |
| 281 | 53 | IEA-PVPS trends | |
| 1,151 | 1,100 | EPIA outlook | |
| 524 | 1 | EPIA outlook | |
| 212 | 11 | EPIA outlook | |
| 122 | 92 | IEA-PVPS[lower-alpha 3] revised in 2015[16] | |
| 1,475 | 445 | IEA-PVPS trends | |
| 5,340 | 116 | EPIA outlook[lower-alpha 4] | |
| 43 | 19 | IEA-PVPS trends | |
| 756 | 319 | IEA-PVPS trends | |
| 376 | 170 | IEA-PVPS trends | |
| 824 | 437 | IEA-PVPS trends | |
| 18 | 6 | IEA-PVPS trends | |
| 616 | 290 | EPIA outlook | |
| 3,377 | 1,546 | IEA-PVPS trends | |
| 12,079 | 4,751 | IEA-PVPS trends | |
| Listed countries account for 39,666 MW or 99.3% of worldwide total installations of 39,953 MW in 2013. (A) Data sources (Nameplate capacity in DC-output not AC): | |||
In 2013, Europe added 11 gigawatts of new PV installation (including non-EU countries). It is still the most developed region with a cumulated total of 81.5 GW, about 59 percent of the worldwide installed capacity. Solar PV now covers 3 percent of the electricity demand and 6 percent of the peak electricity demand. However, European PV deployment has slowed down by half compared to the record year of 2011, and will most likely continue to decrease. This is mainly due to the strong decline of new installations in Germany and Italy.
| Photovoltaic Barometer report – PV capacity in the European Union in 2013[9]:5–7,9 | |||||||||
|---|---|---|---|---|---|---|---|---|---|
| Country | Added 2013 (MW) | Total 2013 (MW) | Generation 2013 | ||||||
| off- grid |
on- grid |
Capacity | off- grid |
on- grid |
Capacity | Watt per capita |
in GWh |
in % | |
| – | 268.7 | 268.7 | 4.5 | 685.9 | 690.4 | 81.7 | 686.0 | – | |
| – | 214.9 | 215.0 | 0.1 | 2,983.3 | 2,983.4 | 267.3 | 2,352.0 | – | |
| – | 104.4 | 104.4 | 0.7 | 1,018.5 | 1,019.2 | 139.9 | 1,348.5 | – | |
| – | 17.2 | 17.2 | 0.5 | 21.2 | 21.7 | 5.1 | 12.3 | – | |
| 0.1 | 17.5 | 17.5 | 0.9 | 33.9 | 34.8 | 40.2 | 45.8 | – | |
| – | 110.4 | 110.4 | 0.4 | 2,132.4 | 2,132.8 | 202.8 | 2,070.0 | – | |
| 0.2 | 155.0 | 155.2 | 1.4 | 530.0 | 531.4 | 94.8 | 490.0 | – | |
| – | – | – | 0.1 | – | 0.2 | 0.1 | 0.6 | – | |
| – | – | – | 11.0 | 0.2 | 11.2 | 2.1 | 5.4 | – | |
| – | 613.0 | 613.0 | 24.6 | 4,673.0 | 4,697.6 | 71.6 | 4,900.0 | – | |
| 5.0 | 3,305.0 | 3,310.0 | 65.0 | 35,948 | 36,013.0 | 447.2 | 30,000.0 | – | |
| – | 1,042.5 | 1,042.5 | 7.0 | 2,578.8 | 2,585.8 | 233.7 | 3,648.0 | – | |
| 0.1 | 3.0 | 3.1 | 0.6 | 14.8 | 15.4 | 1.6 | 9.3 | – | |
| 0.1 | – | 0.1 | 0.9 | 0.2 | 1.0 | 0.2 | 0.7 | – | |
| 1.0 | 1,461.0 | 1,462.0 | 12.0 | 17,602.0 | 17,614.0 | 295.1 | 22,146.0 | – | |
| – | – | – | – | 1.5 | 1.5 | 0.7 | n.a. | – | |
| – | 61.9 | 61.9 | 0.1 | 68.0 | 68.1 | 22.9 | 45.0 | – | |
| – | 23.3 | 23.3 | – | 100.0 | 100.0 | 186.2 | 50.0 | – | |
| – | 6.0 | 6.0 | – | 24.7 | 24.7 | 58.7 | 30.1 | – | |
| – | 300.0 | 300.0 | 5.0 | 660.0 | 665.0 | 39.6 | 582.0 | – | |
| 0.2 | 0.4 | 0.6 | 2.4 | 1.8 | 4.2 | 0.1 | 4.0 | – | |
| 0.5 | 52.2 | 52.7 | 3.8 | 277.2 | 281.0 | 26.8 | 446.0 | – | |
| – | 972.7 | 972.7 | – | 1,022.0 | 1,022.0 | 51.1 | 397.8 | – | |
| – | – | – | 0.1 | 537.0 | 537.1 | 99.3 | 600.0 | – | |
| – | 33.3 | 33.3 | 0.1 | 254.7 | 254.8 | 123.8 | 240.0 | – | |
| 0.4 | 102.0 | 102.4 | 25.0 | 4,680.5 | 4,705.5 | 100.7 | 8,289.0 | – | |
| 1.1 | 17.9 | 19.0 | 8.4 | 34.7 | 43.1 | 4.5 | 38.8 | – | |
| – | 1,031.0 | 1,031.0 | 2.3 | 2,737.0 | 2,739.3 | 42.9 | 1,800.0 | – | |
| 8.7 | 9,913.5 | 9,922.2 | 177.0 | 78,621.2 | 78,798.2 | 155.8 | 80,236.0 | – | |
| Country | off- grid |
on- grid |
Capacity | off- grid |
on- grid |
Capacity | Watt per capita |
in GWh |
in % |
| Added 2013 (MW) | Total 2013 (MW) | Generation 2013 | |||||||
- 2012
| Country | Capacity | Generation | |||||||
|---|---|---|---|---|---|---|---|---|---|
| off grid Δ |
on grid Δ |
Added | off grid Σ |
on grid Σ |
Total | Watt/ Capita |
GWh | % | |
| 0.0 | 7,604 | 7,604 | 55.0 | 32,643 | 32,698 | 398 | 28,000 | 5.62% | |
| 1.0 | 3,577 | 3,578 | 11.0 | 16,350 | 16,361 | 273 | 18,800 | 6.70% | |
| – | – | 5,000 | – | – | 8,300 | 6 | 6,678 | 0.14% | |
| – | – | 3,346 | – | – | 7,777 | 24 | 9,750 | 0.25% | |
| – | – | 2,000 | – | – | 7,000 | 55 | 6,600 | 0.77% | |
| 1.3 | 193 | 194 | 7.3 | 4,492 | 4,517 | 110 | 8,169 | 2.84% | |
| 0.0 | 1,079 | 1,079 | 24.6 | 4,003 | 4,028 | 61 | 4,000 | 0.91% | |
| 0.0 | 599 | 599 | 0.1 | 2,650 | 2,650 | 241 | 2,115 | 2.90% | |
| – | – | 1,000 | – | – | 2,400 | 105 | 2,800 | 1.23% | |
| 0 | 109 | 109 | 0.4 | 2,022 | 2,022 | 196 | 2,173 | 3.11% | |
| 0 | 929 | 929 | 0 | 1,829 | 1,829 | 29 | 1,327 | 0.50% | |
| 0 | 912 | 912 | 7.0 | 1,536 | 1,543 | – | 1,239 | 4.26% | |
| – | – | 980 | – | – | 1,205 | 1 | 2,115 | 0.33% | |
| – | – | 252 | – | – | 1,064 | 22 | 920 | 0.20% | |
| 0.0 | 721 | 721 | 0.7 | 933 | 933 | 123 | 534 | 3.40% | |
| – | – | 268 | – | – | 765 | 22 | 860 | 0.17% | |
| 0.0 | 30 | 30 | 0.1 | 517 | 517 | 95 | 500 | 1.99% | |
| 0.0 | 235 | 235 | 4.5 | 417 | 422 | 50 | 300 | 0.62% | |
| – | – | 200 | – | – | 410 | 53 | 370 | 0.64% | |
| 0.0 | 375 | 375 | 1.7 | 390 | 392 | 70 | 114 | 1.09% | |
| – | – | 188 | – | – | 373 | 8 | 410 | 0.31% | |
| – | – | 210 | – | – | 359 | 5 | 530 | 0.40% | |
| 0.0 | 175 | 175 | 2.0 | 316 | 321 | 16 | 200 | 0.21% | |
| – | – | 60 | – | – | 250 | 31 | 310 | 0.68% | |
| 0.1 | 68 | 68 | 0.6 | 226 | 229 | 22 | 360 | 0.74% | |
| 0.0 | 117 | 117 | 24.6 | 217 | 217 | 97 | 121 | 1.70% | |
| – | – | 104 | – | – | 206 | 9 | – | – | |
| – | – | 15 | – | – | 38 | 0.3 | 83 | 0.04% | |
| 0 | 7 | 7 | 0 | 47 | 47 | 59 | 30 | 0.44% | |
| – | – | 40 | – | – | 41 | 0.08 | – | – | |
| – | – | 22 | – | – | 36 | 1 | 34 | 0.04% | |
| – | – | 26 | – | – | 30 | 2 | – | – | |
| 0.8 | 7 | 8 | 2.3 | 17 | 24 | 2 | 21 | 0.01% | |
| 0 | 12 | 12 | 5.0 | 19 | 19 | 29 | 14 | 0.89% | |
| 0 | 7 | 7 | 0.8 | 16 | 17 | 11 | 20 | 0.31% | |
| – | – | 12 | – | – | 17 | 0.1 | – | – | |
| – | – | 15 | – | – | 15 | 0.5 | – | – | |
| 0 | 0 | 0 | 11.0 | 0 | 11 | – | 8 | 0.00% | |
| – | – | 0 | – | – | 9 | – | 7 | 0.01% | |
| – | – | 2 | – | – | 9 | 0.1 | 10 | 0.01% | |
| 0 | 6 | 6 | 0.0 | 6 | 6.1 | 2 | 2 | 0.05% | |
| – | – | 2 | – | – | 6 | 0.3 | 2 | – | |
| 0 | 1 | 1 | 0.5 | 3 | 3.74 | – | 5 | 0.01% | |
| 1.1 | 0 | 1 | 3.3 | 1 | 3.4 | 0.1 | 4 | 0.00% | |
| 0 | 0 | 0 | 0.1 | 1.5 | 1.51 | 0.3 | 0 | 0.01% | |
| 0 | 0 | 0 | 0.6 | 0.1 | 0.69 | – | 0 | 0.01% | |
| – | – | 0.2 | – | – | 0.2 | 0.04 | – | – | |
| 0 | 0 | 0 | 0.13 | 0.02 | 0.15 | 0.1 | 0 | 0.00% | |
| Country | off grid Δ |
on grid Δ |
Added | off grid Σ |
on grid Σ |
Total | Watt/ Capita |
GWh | % |
| Capacity | Generation | ||||||||
- 2011
| Country | off grid Δ |
on grid Δ |
Installed 2011 |
off grid Σ |
on grid Σ |
Total 2011 |
Wp/capita Total |
2011 Generation (GWh) |
|---|---|---|---|---|---|---|---|---|
| 5 | 7,500 | 7,505 | 55 | 24,820 | 24,875 | 304.3 | 19,000 | |
| 0 | 9,280 | 9,280 | 13.5 | 12,750 | 12,764 | 210.5 | 10,730 | |
| 4.48 | 1,291.3 | 1,295.8 | 103.3 | 4,810.7 | 4,913.7 | 39 | ||
| 1,867 | 1,867 | 3,965 | 4,383 | 13.8 | ||||
| 1 | 354 | 355 | 23.3 | 4,191 | 4,214 | 91.3 | 7,912 | |
| 15 | 2,485 | 2,500 | 118 | 3,166 | 3,300 | 2.4 | ||
| 0.1 | 1,634 | 1,634 | 29.4 | 2,802 | 2,831 | 43.5 | 1,800 | |
| 0 | 0 | 0 | 0.4 | 1,959 | 1,959 | 186.0 | 2,118 | |
| 0 | 776 | 776 | 0.1 | 1,812 | 1,812 | 165.5 | 1,282 | |
| 76 | 761 | 837 | 163.78 | 1244.16 | 1,407.9 | 56.4 | ||
| 0.3 | 937 | 937 | 2.3 | 1,012 | 1,014 | 16.2 | 259 | |
| 0 | 156.7 | 156.7 | 6 | 806.3 | 812.3 | 15.4 | ||
| 0.1 | 426 | 426 | 7 | 624 | 631 | 55.8 | 544 | |
| 364 | 563 | 16.6 | ||||||
| 0.1 | 314 | 314 | 0.1 | 488 | 488 | 89.8 | 400 | |
| 300 | 461 | 0.4 | ||||||
| 126 | 260 | 32 | ||||||
| 130 | 190 | 23.9 | ||||||
| 0.69 | 90.98 | 91.64 | 4.5 | 182.67 | 187.17 | 20.7 | 163 | |
| 0.1 | 12.6 | 12.7 | 3.2 | 140 | 144 | 13.5 | 265 | |
| 188 | 190 | 4.1 | ||||||
| 0.4 | 100 | 100 | 0.7 | 132 | 133 | 17.7 | 120 | |
| 0 | 30 | 30 | 5 | 113 | 118 | 7.1 | 86 | |
| 70 | 102 | 4.4 | ||||||
| 50 | 100[29] | |||||||
| 0 | 44.9 | 44.9 | 0.1 | 90.3 | 90.4 | 44.1 | 60 | |
| 1 | 41 | 0.8 | ||||||
| 10 | 40 | 0.4 | ||||||
| 5 | 32 | 0.2 | ||||||
| 0 | 1.2 | 1.2 | 0 | 30.6 | 30.6 | 59.9 | 21 | |
| 0.73 | 3.59 | 4.31 | 6.48 | 9.27 | 15.75 | 2.0 | 15.0 | |
| 0.2 | 9.5 | 9.7 | 0.8 | 15.88 | 16.68 | 3.0 | 12.0 | |
| 0 | 7.7 | 7.7 | 0 | 11.5 | 11.5 | 27.4 | 17.5 | |
| 1.5 | 0 | 1.5 | 11 | 0.2 | 11.2 | 2.1 | 8.0 | |
| 0 | 0.9 | 0.9 | 11 | 2.5 | 13.5 | 0.4 | ||
| 0.1 | 3.8 | 3.8 | 0.7 | 9.3 | 10.1 | 12.5 | 12.0 | |
| 5 | 6 | 0.1 | ||||||
| 0.2 | 2.2 | 2.4 | 0.4 | 3.7 | 4.1 | 0.4 | 3.3 | |
| 0 | 1 | 1 | 0.6 | 2.3 | 2.9 | 0.1 | 2.0 | |
| 0 | 0 | 0 | 1.3 | 0.5 | 1.8 | 0.0 | 1.7 | |
| 0 | 1.5 | 1.5 | 0 | 1.5 | 1.5 | 0.7 | ||
| 0 | 0 | 0 | 0.6 | 0.1 | 0.7 | 0.2 | 0.5 | |
| 0.1 | 0 | 0.1 | 0.1 | 0.0 | 0.2 | 0.1 | 0.1 | |
| 0 | 0 | 0 | 0.1 | 0 | 0.1 | 0.0 | 0.1 | |
| 0 | 0.1 | 0.02 | ||||||
| Country | off grid Δ |
on grid Δ |
Installed 2011 |
off grid Σ |
on grid Σ |
Total 2011 |
Wp/capita Total |
2011 Generation (GWh) |
- 2010
| Country | off grid Δ |
on grid Δ |
Installed 2010 |
off grid Σ |
on grid Σ |
Total 2010 |
Watt/ Capita |
Module Price US$/Wp |
Feed-in Tariff US$/kW·h |
|---|---|---|---|---|---|---|---|---|---|
| 5 | 7,406 | 7,411 | 50 | 17,320 | 17,370 | 212.3 | – | – | |
| 1 | 369 | 370 | 21.1 | 3,787 | 3,808 | 82.8 | – | – | |
| 4.2 | 986.8 | 991.0 | 98.8 | 3,519 | 3,618 | 28.3 | – | – | |
| 0.1 | 2,321 | 2,321 | 13.5 | 3,465 | 3,478 | 57.6 | – | – | |
| 31 | 887 | 918 | 440 | 2,094 | 2,534 | 8.1 | 1.48-2.36 | – | |
| 0 | 1,490 | 1,490 | 0.4 | 1,952.7 | 1,953 | 185.9 | – | – | |
| 0.1 | 719.0 | 719.1 | 29.4 | 1,025 | 1,054 | 16.3 | – | – | |
| – | – | 520.0 | – | – | 893.0 | – | – | – | |
| 0 | 213.4 | 213.4 | 0.1 | 787.4 | 787.5 | 72.6 | – | – | |
| 0 | 131.2 | 131.2 | 6.0 | 649.6 | 655.6 | 13.4 | – | – | |
| 3.8 | 379.5 | 383.3 | 87.8 | 483.1 | 570.9 | 25.2 | – | – | |
| 24.9 | 171.7 | 196.6 | 60.1 | 231.0 | 291.1 | 8.4 | – | – | |
| 0.1 | 150.3 | 150.4 | 6.9 | 198.5 | 205.4 | 18.2 | – | – | |
| – | – | 69.0 | – | – | 189.0 | – | – | – | |
| 0.2 | 25.5 | 25.7 | 4 | 69.6 | 73.6 | 9.7 | 3.0-3.5 | 14.7 | |
| 0.091 | 10.58 | 10.67 | 5 | 62.5 | 67.5 | 4.1 | – | – | |
| 0.25 | 19.96 | 20.21 | 3.61 | 48.99 | 52.60 | 6.4 | 3.0-3.2 | 26.4 | |
| 0.155 | 6.922 | 7.077 | 0 | 26.4 | 26.4 | 0.4 | – | – | |
| 2.47 | 0.80 | 3.27 | 23.72 | 1.30 | 25.02 | 0.2 | 4-5 | <36.2 | |
| 0.5 | 21 | 21.5 | 2.9 | 21.63 | 24.53 | 3.4 | 3.6-5.1 | 12.5 | |
| 0.2 | 14.25 | 14.45 | 2.841 | 15.03 | 17.87 | 1.7 | 2.1-4.2 | 10.3-19.2 | |
| 2 | 0.287 | 2.287 | 10 | 1.063 | 11.06 | 0.4 | 3.71 | <13.5 | |
| 0 | 6.9 | 6.9 | 0.1 | 8.9 | 9.0 | 4.1 | – | – | |
| 0.338 | 0.516 | 0.854 | 5.169 | 3.595 | 8.764 | 1.0 | 2.4-6.5 | 18.3-20.9 | |
| 0.32 | 0 | 0.32 | 8.530 | 0.132 | 8.662 | 1.9 | – | 11.1–14.3 | |
| 2.0 | 0 | 2.0 | 7.5 | 0.2 | 7.6 | 1.4 | – | – | |
| 0 | 1.8 | 1.8 | 0 | 5.7 | 5.7 | 52.4 | – | – | |
| 0 | 4.3 | 4.3 | 0 | 5.7 | 5.7 | 0.8 | – | – | |
| 0.2 | 1.2 | 1.3 | 0.540 | 4.025 | 4.565 | 0.8 | 2.8-4.7 | 37.5 | |
| 0.9 | 0.1 | 1 | 4.5 | 0.5 | 5 | 0.1 | 2.8-4.2 | 13.3 | |
| Country | off grid Δ |
on grid Δ |
Installed 2010 |
off grid Σ |
on grid Σ |
Total 2010 |
Watt/ Capita |
Module Price US$/Wp |
Feed-in Tariff US$/kW·h |
- 2009
| Country | off grid Δ |
on grid Δ |
Installed 2009 |
off grid Σ |
on grid Σ |
Total 2009 |
Watt/ Capita |
Module Price US$/Wp |
Feed-in Tariff US$/kW·h |
|---|---|---|---|---|---|---|---|---|---|
| 5 | 3,840 | 3,845 | 45 | 9,800 | 9,845 | 119.6 | 2.1-3.5 | 31.5 | |
| 0 | 60 | 60 | 31 | 3,492 | 3,523 | 76.1 | 1.6-3.5 | – | |
| 3.8 | 479.2 | 483.0 | 95 | 2,533 | 2,627 | 20.7 | 4.3 | 19.1-25.8 | |
| 40 | 433.1 | 473.1 | 410 | 1,232 | 1,642 | 5.3 | 1.85-2.2 | 10.4 | |
| 0 | 723 | 723 | 13 | 1168 | 1,181 | 20.3 | 2.2-3.0 | 23.6 | |
| 0 | 84.4 | 84.4 | 5.9 | 436.0 | 441.9 | 9.1 | 1.9-2.0 | 13.3-19.6 | |
| 0.2 | 250 | 250.2 | 23 | 407 | 430 | 6.7 | 1.5-2.8 | – | |
| 10.56 | 68.57 | 79.13 | 83.91 | 99.7 | 183.65 | 8.3 | 2.3-4.7 | 10.2-15.6 | |
| 0.1 | 34.15 | 34.25 | 3.05 | 99.15 | 102.2 | 9.5 | 2.1-4.2 | 10.3-19.2 | |
| 7.71 | 54.14 | 61.85 | 35.2 | 59.37 | 94.57 | 2.8 | 2.9 | 6.1 | |
| 0.2 | 25.5 | 25.7 | 4 | 69.6 | 73.6 | 9.7 | 3.0-3.5 | 14.7 | |
| 0.091 | 10.58 | 10.67 | 5 | 62.5 | 67.5 | 4.1 | – | – | |
| 0.25 | 19.96 | 20.21 | 3.61 | 48.99 | 52.60 | 6.4 | 3.0-3.2 | 26.4 | |
| 0.155 | 6.922 | 7.077 | 1.75 | 27.85 | 29.59 | 0.4 | – | – | |
| 2.47 | 0.80 | 3.27 | 23.72 | 1.30 | 25.02 | 0.2 | 4-5 | <36.2 | |
| 0.5 | 21 | 21.5 | 2.9 | 21.63 | 24.53 | 3.4 | 3.6-5.1 | 12.5 | |
| 2 | 0.287 | 2.287 | 10 | 1.063 | 11.06 | 0.4 | 3.71 | <13.5 | |
| 0.338 | 0.516 | 0.854 | 5.169 | 3.595 | 8.764 | 1.0 | 2.4-6.5 | 18.3-20.9 | |
| 0.32 | 0 | 0.32 | 8.530 | 0.132 | 8.662 | 1.9 | – | 11.1–14.3 | |
| 0.9 | 0.1 | 1 | 4.5 | 0.5 | 5 | 0.1 | 2.8-4.2 | 18.0 | |
| 0.2 | 1.2 | 1.3 | 0.540 | 4.025 | 4.565 | 0.8 | 2.8-4.7 | 37.5 | |
| Country | off grid Δ |
on grid Δ |
Installed 2009 |
off grid Σ |
on grid Σ |
Total 2009 |
Watt/ Capita |
Module Price US$/Wp |
Feed-in Tariff US$/kW·h |
- 2008
| Country | off grid Δ |
on grid Δ |
Installed 2008 |
off grid Σ |
on grid Σ |
Total 2008 |
Watt/ Capita |
|---|---|---|---|---|---|---|---|
| 4.5 | 1,500 | 1,504.5 | 40 | 5,300 | 5,340 | 64.7 | |
| 1 | 60 | 2,661 | 31 | 3,323 | 3,354 | 77.1 | |
| 0.7 | 224.6 | 225.3 | 90.8 | 2,053 | 2,144 | 16.8 | |
| 45 | 293 | 338 | 370 | 798.5 | 1,168.5 | 3.9 | |
| 0.2 | 337.9 | 338.1 | 13.3 | 445 | 458.3 | 7.8 | |
| 0 | 276.3 | 276.3 | 5.9 | 351.6 | 357.5 | 7.3 | |
| 0.4 | 104.1 | 104.5 | 22.9 | 156.8 | 179.7 | 2.9 | |
| 6.9 | 15.1 | 22.0 | 73.3 | 31.2 | 104.5 | 5.1 | |
| 0.1 | 49.98 | 50.08 | 2.941 | 65.01 | 67.95 | 6.7 | |
| 0.21 | 4.2 | 4.4 | 5.2 | 52 | 57.2 | 3.5 | |
| 0.2 | 11.5 | 11.7 | 3.8 | 44 | 47.9 | 6.4 | |
| 4.62 | 2.33 | 6.94 | 27.48 | 5.24 | 32.7 | 1.0 | |
| 0.13 | 4.55 | 4.69 | 3.36 | 29.03 | 32.39 | 4.0 | |
| 0.12 | 4.3 | 4.42 | 1.59 | 20.92 | 22.51 | 0.3 | |
| 0.80 | 0.20 | 1.00 | 21.25 | 0.50 | 21.75 | 0.2 | |
| 1.6 | 0.135 | 1.76 | 8 | 0.776 | 8.776 | 0.4 | |
| 0.35 | 0 | 0.35 | 8.210 | 0.132 | 8.342 | 1.8 | |
| 0.275 | 10.403 | 1.678 | 4.83 | 3.08 | 7.91 | 0.9 | |
| 0.675 | 0.075 | 0.75 | 3.75 | 0.25 | 4 | 0.06 | |
| 0.55 | 0.135 | 0.190 | 0.440 | 2.825 | 3.265 | 0.8 | |
| 0.6 | 0.6 | 1.21 | 2.4 | 0.62 | 3.03 | 0.4 | |
| Country | off grid Δ |
on grid Δ |
Installed 2009 |
off grid Σ |
on grid Σ |
Total 2009 |
Watt/ capita |
- 2007
Off grid refers to photovoltaics which are not grid connected. On grid means connected to the local electricity grid. Δ means the amount installed during the previous year. Σ means the total amount installed. Wp/capita refers to the ratio of total installed capacity divided by total population, or total installed Wp per person. Module price is average installed price, in Euros. kW·h/kWp·yr indicates the range of insolation to be expected. While National Report(s) may be cited as source(s) within an International Report, any contradictions in data are resolved by using only the most recent report's data. Exchange rates represent the 2006 annual average of daily rates (OECD Main Economic Indicators June 2007).
Module Price: Lowest:2.5 EUR/Wp (2.83 USD/Wp[30]) in Germany 2003. Uncited insolation data is from maps dating 1991–1995.[31][32]
| Country | off grid Δ |
on grid Δ |
Installed 2007 |
off grid Σ |
on grid Σ |
Total 2007 |
Watt/ Capita |
Module Price €/Wp |
Feed-in Tariff EU¢/kWh |
|---|---|---|---|---|---|---|---|---|---|
| 35 | 1,100 | 1,135 | 35 | 3,827 | 3,862 | 46.8 | 4.0–5.3 | 51.8–56.8 | |
| 1.562 | 208.8 | 210.4 | 90.15 | 1,829 | 1,919 | 15 | 2.96 | Ended(2005) | |
| 55 | 151.5 | 206.5 | 325 | 505.5 | 830.5 | 2.8 | 2.98 | 1.2–31.04(CA) | |
| 22 | 490 | 512 | 29.8 | 625.2 | 655 | 15.1 | 3.0–4.5 | 18.38–44.04 | |
| 0.3 | 69.9 | 70.2 | 13.1 | 107.1 | 120.2 | 2.1 | 3.2–3.6 | 36.0–49.0 | |
| 5.91 | 6.28 | 12.19 | 66.45 | 16.04 | 82.49 | 4.1 | 4.5–5.4 | 0–26.4(SA'08) | |
| 0 | 42.87 | 42.87 | 5.943 | 71.66 | 77.60 | 1.6 | 3.50–3.84 | 56.5–59.3 | |
| 0.993 | 30.31 | 31.30 | 22.55 | 52.68 | 75.23 | 1.2 | 3.2–5.1 | 30.0–55.0 | |
| 0.582 | 1.023 | 1.605 | 5.3 | 48 | 53.3 | 3.3 | 3.3–4.5 | 1.21–9.7 | |
| 0.2 | 6.3 | 6.5 | 3.6 | 32.6 | 36.2 | 4.9 | 3.18–3.30 | 9.53–50.8 | |
| 0.055 | 2.061 | 2.116 | 3.224 | 24.48 | 27.70 | 3.4 | 3.6–4.3 | >0 | |
| 3.888 | 1.403 | 5.291 | 22.86 | 2.911 | 25.78 | 0.8 | 3.76 | 0–29.48(ON) | |
| 0.869 | 0.15 | 1.019 | 20.45 | 0.3 | 20.75 | 0.2 | 5.44–6.42 | None | |
| 0.16 | 3.65 | 3.81 | 1.47 | 16.62 | 18.09 | 0.3 | 3.67–5.72 | 0–11.74(exprt) | |
| 0.2 | 14.25 | 14.45 | 2.841 | 15.03 | 17.87 | 1.7 | – | – | |
| 0.32 | 0.004 | 0.324 | 7.86 | 0.132 | 7.992 | 1.7 | 11.2 | None | |
| 0.271 | 1.121 | 1.392 | 4.566 | 1.676 | 6.242 | 0.7 | 3.24–7.02 | None | |
| 0.05 | 0.125 | 0.175 | 0.385 | 2.69 | 3.075 | 0.6 | 5.36–8.04 | None | |
| 0.5 | 0 | 0.5 | 1.794 | 0.025 | 1.819 | 0.3 | 4.3 | 13.13–16.40 | |
| Country | off grid Δ |
on grid Δ |
Installed 2007 |
off grid Σ |
on grid Σ |
Total 2007 |
Watt/ Capita |
Module Price €/Wp |
Feed-in Tariff EU¢/kW·h |
- 2006
Notes: While National Report(s) may be cited as source(s) within an International Report, any contradictions in data are resolved by using only the most recent report's data. Exchange rates represent the 2006 annual average of daily rates (OECD Main Economic Indicators June 2007)
Module Price: Lowest:2.5 EUR/Wp[24] (2.83 USD/Wp[30]) in Germany 2003. Uncited insolation data is lifted from maps dating 1991–1995.[31][32]
| Country | Cells Made |
Modules Made |
off grid Δ |
on grid Δ |
Installed 2006 |
off grid Σ |
on grid Σ |
Total 2006 |
Watt/ Capita |
Module Price €/Wp |
Feed-in Tariff EU¢/kWh |
|---|---|---|---|---|---|---|---|---|---|---|---|
| 514.0 | 341.0 | 3 | 950 | 953 | 32 | 2,831 | 2,863 | 34.78 | 4.0–5.3 | 51.8–56.8 | |
| 919.8 | 645.4 | 1.531 | 285.1 | 286.6 | 88.59 | 1,620 | 1,709 | 13.37 | 2.96 | Ended(2005) | |
| 201.6 | 200.5 | 37 | 108 | 145 | 270 | 354 | 624 | 2.058 | 2.98 | 1.2–31.04(CA) | |
| 75.3 | – | 9.1 | 51.4 | 60.5 | 17.8 | 100.4 | 118.2 | 2.620 | 3.0–4.5 | 18.38–44.04 | |
| 380 | 510 | 15 | – | 15 | 73 | – | 73 | 0.055 | – | – | |
| 36.0 | 7.6 | 7.576 | 2.145 | 9.721 | 60.54 | 9.765 | 70.30 | 3.327 | 4.5–5.4[48] | 0–26.4(SA'08) | |
| 18.0 | 2.6 | 0.278 | 1.243 | 1.521 | 5.713 | 46.99 | 52.71 | 3.217 | 3.3–4.5 | 1.21–9.7 | |
| 11.0 | 27.0 | 0.5 | 12 | 12.5 | 12.8 | 37.2 | 50 | 0.846 | 3.2–3.6 | 36.0–49.0 | |
| 33.5 | 36.0 | 1.478 | 9.412 | 10.89 | 21.55 | 22.38 | 43.93 | 0.685 | 3.2–5.1 | 30.0–55.0 | |
| 18.0 | 16.9 | 0.28 | 20.93 | 21.21 | 5.943 | 28.79 | 34.73 | 0.716 | 3.50–3.84 | 56.5–59.3 | |
| – | 20 | 6 | – | 6 | 30 | – | 30 | 0.477 | 2.5[33] | – | |
| 0.03 | 0.03 | 0.15 | 2.5 | 2.65 | 3.4 | 26.3 | 29.7 | 3.955 | 3.18–3.30 | 9.53–50.8 | |
| – | – | 0.274 | 1.29 | 1.564 | 3.169 | 22.42 | 25.59 | 3.076 | 3.6–4.3 | >0 | |
| – | – | – | 0.042 | 0.042 | – | 23.60 | 23.60 | 50.54 | – | – | |
| 0 | 2.35 | 3.354 | 0.384 | 3.738 | 18.98 | 1.508 | 20.48 | 0.620 | 3.76 | 0–29.48(ON) | |
| – | – | 0.938 | 0.116 | 1.054 | 19.59 | 0.155 | 19.75 | 0.185 | 5.44–6.42 | None | |
| 1.9 | 89.4 | 0.376 | 3.007 | 3.383 | 1.3 | 12.96 | 14.26 | 0.232 | 3.67–5.72 | 0–11.74(exprt) | |
| 43.4[49] | 65 | 6 | – | 6 | 12 | – | 12 | 0.010 | – | – | |
| 37.0 | 0 | 0.35 | 0.053 | 0.403 | 7.54 | 0.128 | 7.668 | 1.624 | 11.2 | None | |
| – | – | 1.049 | 0.201 | 1.25 | 5.081 | 1.613 | 6.694 | 0.601 | – | 40.0–50.0 | |
| 0 | 55.4 | 0.302 | 0.301 | 0.613 | 4.285 | 0.555 | 4.84 | 0.529 | 3.24–7.02 | None | |
| – | – | – | 2.103 | 2.103 | 0.053 | 4.108 | 4.161 | 0.398 | – | – | |
| – | – | – | 0.064 | 0.064 | 3.779 | 0.287 | 4.066 | 0.768 | – | – | |
| – | – | 1.134 | – | 1.134 | 3.6 | – | 3.6 | 0.023 | – | – | |
| – | – | 0.65 | – | 0.65 | 3.6 | – | 3.6 | 0.187 | – | – | |
| – | – | 0.25 | 0.227 | 0.477 | 2.691 | 0.775 | 3.466 | 0.326 | – | – | |
| 0 | 0.525 | 0.04 | 0.21 | 0.25 | 0.335 | 2.565 | 2.9 | 0.531 | 5.36–8.04 | None | |
| – | – | 0.333 | – | 0.333 | 2.333 | – | 2.333 | 0.083 | – | – | |
| 0 | 0 | 0.275 | – | 0.275 | 1.294 | 0.025 | 1.319 | 0.183 | 4.3 | 13.13–16.40 | |
| – | – | 0.08 | 0.44 | 0.52 | 0.45 | 0.526 | 0.976 | 1.142 | – | – | |
| – | 42[24] | – | 0.241 | 0.241 | 0.15 | 0.621 | 0.771 | 0.075 | – | – | |
| 0 | 0 | – | .00452 | 0.00452 | – | 0.486 | 0.486 | 0.018 | 4.73 | None | |
| – | – | 0.027 | 0.087 | 0.114 | 0.319 | 0.112 | 0.431 | 0.011 | – | – | |
| – | – | – | 0.183 | 0.183 | 0.098 | 0.265 | 0.363 | 0.180 | – | – | |
| – | – | – | – | – | 0.3 | – | 0.3 | 0.070 | – | – | |
| – | – | 0.12 | – | 0.12 | 0.2 | – | 0.2 | 0.026 | – | 38.5–40.0 | |
| – | – | – | – | – | 0.09 | 0.065 | 0.155 | 0.015 | – | – | |
| – | – | 0.004 | – | 0.004 | 0.064 | – | 0.064 | 0.012 | – | – | |
| – | – | – | 0.033 | 0.033 | – | 0.048 | 0.048 | 0.118 | – | – | |
| – | – | 0.023 | – | 0.023 | 0.04 | – | 0.04 | 0.012 | – | – | |
| – | – | 0.005 | – | 0.005 | 0.008 | – | 0.008 | 0.006 | – | – | |
| – | – | 0.001 | – | 0.001 | 0.006 | – | 0.006 | 0.003 | – | – | |
| Country | Cells Made |
Modules Made |
off[32] | on grid Δ |
Installed 2006 |
off grid Σ |
on grid Σ |
Total 2006 |
Wp/capita Total |
Module Price €/Wp |
Feed-in Tariff EU¢/kWh |
- 2005
Original source gives these individual numbers and totals them to 37,500 kW. The 2004 reported total was 30,700 kW.[51] With new installations of 6,800 kW, this would give the reported 37,500 kW.
| Country | Cumulative | Installed in 2005 | |||
|---|---|---|---|---|---|
| Off Grid PV [kW] | On Grid [kW] | Total [kW] | Total [kW] | Grid-tied [kW] | |
| Germany | 29,000 | 1,400,000 | 1,429,000 | 635,000 | 632,000 |
| Japan | 87,057 | 1,334,851 | 1,421,908 | 289,917 | 287,105 |
| United States | 233,000 | 246,000 | 479,000 | 103,000 | 70,000 |
| Australia | 41,841 | 8,740 | 60,581 | 8,280 | 1,980 |
| Spain | 15,800 | 41,600 | 57,400 | 20,400 | 18,600 |
| Netherlands | 4,919 | 45,857 | 50,776 | 1,697 | 1,547 |
| Italy | 12,300 | 15,200 | 37,500* | 6,800 | 6,500 |
| France | 20,076 | 12,967 | 33,043 | 7,020 | 5,900 |
| Switzerland | 3,250 | 23,800 | 27,050 | 3,950 | 3,800 |
| Austria | 2,895 | 21,126 | 24,021 | 2,961 | 2,711 |
| Mexico | 18,654 | 40 | 18,694 | 513 | 30 |
| Canada | 15,622 | 1,124 | 16,746 | 2,862 | 612 |
| South Korea | 5,663 | 9,358 | 15,021 | 6,487 | 6,183 |
| United Kingdom | 924 | 9,953 | 10,877 | 2,732 | 2,567 |
| Norway | 7,177 | 75 | 7,252 | 362 | 0 |
| Sweden | 3,983 | 254 | 4,237 | 371 | 0 |
| Denmark | 295 | 2,355 | 2,650 | 360 | 320 |
| Israel | 1,019 | 25 | 1,044 | 158 | 2 |
- 2004
| Country | Cumulative | Installed in 2004 | |||
|---|---|---|---|---|---|
| Off-grid PV [kW] | Grid-connected [kW] | Total [kW] | Total [kW] | Grid-tied [kW] | |
| Japan | 84,245 | 1,047,746 | 1,131,991 | 272,368 | 267,016 |
| Germany | 26,000 | 768,000 | 794,000 | 363,000 | 360,000 |
| United States | 189,600 | 175,600 | 365,200 | 90,000 | 62,000 |
| Australia | 48,640 | 6,760 | 52,300 | 6,670 | 780 |
| Netherlands | 4,769 | 44,310 | 49,079 | 3,162 | 3,071 |
| Spain | 14,000 | 23,000 | 37,000 | 10,000 | 8,460 |
| Italy | 12,000 | 18,700 | 30,700 | 4,700 | 4,400 |
| France | 18,300 | 8,000 | 26,300 | 5,228 | 4,183 |
| Switzerland | 3,100 | 20,000 | 23,100 | 2,100 | 2,000 |
| Austria | 2,687 | 16,493 | 19,180 | 2,347 | 1,833 |
| Mexico | 18,172 | 10 | 18,182 | 1,041 | 0 |
| Canada | 13,372 | 512 | 13,884 | 2,054 | 107 |
| Korea | 5,359 | 4,533 | 9,892 | 3,454 | 3,106 |
| United Kingdom | 776 | 7,386 | 8,164 | 2,261 | 2,197 |
| Norway | 6,813 | 75 | 6,888 | 273 | 0 |
Notes
- Displayed figures are recalculated from AC to DC-figure in megawatt-peak (MWp). The AC-to-DC conversion increases figure on average by 15% (normally in the range of 5%–30%)
- Percentage figures based on "IEA-PVPS Trends 2014" report. Worldwide PV installations of 39,953 MW corresponds to 100% in the pie-chart. See table "2013—Global PV Capacity by Country in MW" for absolute figures.
- IEA-PVPS trends 2014 (see reference in footer), noted on page 33, that the country had 30 MW installed at the beginning of 2013. Cumulative of 122 MW comes from the difference in IEA-PVPS snapshot 2015 report.
- Displayed data is EPIA's recalculated DC-figure in megawatt-peak (MWp). Capacity in the original data was reported in AC and amounts to 4,640 MW (cumulative) and 102 MW (installed), as per IEA-PVPS, Trends 2014, p. 34. The conversion results in a difference of approximately 15%. See cited reference.
References
- "Global Market Outlook for Photovoltaics 2014-2018" (PDF). www.epia.org. EPIA – European Photovoltaic Industry Association. Archived from the original (PDF) on 12 June 2014. Retrieved 12 June 2014.
- "Global Market Outlook for Photovoltaics 2013–2017" (PDF). www.epia.org. EPIA – European Photovoltaic Industry Association. Archived from the original (PDF) on 6 November 2014. Retrieved 6 November 2014.
- "Global Market Outlook for Photovoltaics until 2016" (PDF). www.epia.org. EPIA – European Photovoltaic Industry Association. Archived from the original (PDF) on 6 November 2014. Retrieved 6 November 2014.
- "Global Market Outlook for Photovoltaics until 2015" (PDF). www.epia.org. EPIA – European Photovoltaic Industry Association. Archived from the original on 6 November 2014. Retrieved 6 November 2014.
- "Global Market Outlook for Photovoltaics until 2014" (PDF). www.epia.org. EPIA – European Photovoltaic Industry Association. Archived from the original on 6 November 2014. Retrieved 6 November 2014.
- "Global Market Outlook for Photovoltaics until 2013" (PDF). ec.europa.eu. EPIA – European Photovoltaic Industry Association. Archived (PDF) from the original on 6 November 2014. Retrieved 6 November 2014.
- "Global Market Outlook for Photovoltaics until 2012" (PDF). www.epia.org/. EPIA – European Photovoltaic Industry Association. Archived (PDF) from the original on 2 April 2015. Retrieved 2 April 2015.
- EUROBSER'VER (April 2015). "Photovoltaic Barometer - installations 2013 and 2014" (PDF). www.energies-renouvelables.org. Archived from the original (PDF) on 6 May 2015.
- EUROBSER'VER. "Photovoltaic Barometer - installations 2012 and 2013" (PDF). www.energies-renouvelables.org. Archived from the original (PDF) on 10 September 2014. Retrieved 1 May 2014.
- EUROBSER'VER. "Photovoltaic Barometer - installations 2011 and 2012" (PDF). www.energies-renouvelables.org. p. 7. Archived from the original (PDF) on 16 June 2014. Retrieved 1 May 2013.
- EUROBSER'VER. "Photovoltaic Barometer - installations 2010 and 2011" (PDF). www.energies-renouvelables.org. p. 6. Archived from the original (PDF) on 16 June 2014. Retrieved 1 May 2013.
- EUROBSER'VER. "Photovoltaic Barometer - installations 2009 and 2010" (PDF). www.energies-renouvelables.org. p. 4. Archived from the original (PDF) on 16 June 2014. Retrieved 1 May 2013.
- EUROBSER'VER. "Photovoltaic Barometer - installations 2008 and 2009" (PDF). www.energies-renouvelables.org. p. 5. Archived from the original (PDF) on 16 June 2014. Retrieved 1 May 2013.
- eurobserv-er.org EUROBSER'VER - Observatoire des énergies renouvelables Archived 2014-08-29 at the Wayback Machine
- ec.europa.eu European Commission Energy Intelligent Energy Europe
- "Snapshot of Global PV 1992-2014" (PDF). www.iea-pvps.org/index.php?id=32. International Energy Agency — Photovoltaic Power Systems Programme. 30 March 2015. Archived from the original on 30 March 2015. Retrieved 8 March 2017.
- "IEA PVPS TRENDS 2014 in Photovoltaic Applications" (PDF). www.iea-pvps.org/index.php?id=trends. 12 October 2014. Archived (PDF) from the original on 2 December 2014.
- "Snapshot of Global PV 1992-2013" (PDF). www.iea-pvps.org/index.php?id=trends0. International Energy Agency — Photovoltaic Power Systems Programme. 31 March 2014. Archived (PDF) from the original on 5 April 2014.
- "IEA PVPS TRENDS 2013 in Photovoltaic Applications" (PDF). www.iea-pvps.org/index.php?id=92. 29 November 2013. Archived (PDF) from the original on 17 March 2015.
- "Snapshot of Global PV 1992-2012" (PDF). www.iea-pvps.org. International Energy Agency - Photovoltaic Power Systems Programme. 2013. Archived (PDF) from the original on 1 December 2014.
- "TRENDS IN PHOTOVOLTAIC APPLICATIONS – Survey report of selected IEA countries between 1992 and 2010". www.iea-pvps.org/. International Energy Agency - Photovoltaic Power Systems Programme. 2011. Retrieved 28 December 2014.
- "TRENDS IN PHOTOVOLTAIC APPLICATIONS – Survey report of selected IEA countries between 1992 and 2009". www.iea-pvps.org/. International Energy Agency - Photovoltaic Power Systems Programme. 2010. Retrieved 28 December 2014.
- "TRENDS IN PHOTOVOLTAIC APPLICATIONS – Survey report of selected IEA countries between 1992 and 2008". www.iea-pvps.org/. International Energy Agency - Photovoltaic Power Systems Programme. 2009. Retrieved 28 December 2014.
- "Trends in Photovoltaic Applications – Survey report of selected IEA countries between 1992 and 2006" (PDF). August 2007. Archived (PDF) from the original on 1 May 2015. Retrieved 30 April 2015.
- "Latin America Country Markets 2014-2015E". GTM Research. 10 May 2015.
- IEA-PVPS, Annual Report 2014 (AR2014), pp. 38–110, 21 May 2015
- "Global Market Outlook for Solar Power 2015-2019" (PDF). www.solarpowereurope.org. Solar Power Europe (SPE), formerly known as EPIA – European Photovoltaic Industry Association. Archived from the original (PDF) on 9 June 2015. Retrieved 9 June 2015.
- Centro de Energías Renovables, CORFO (July 2014). "Reporte CER". Archived from the original on 6 July 2014. Retrieved 22 July 2014.
- Trends Preview 2011
- "FRB: G.5A Release--Foreign Exchange Rates--Release Dates". federalreserve.gov. Retrieved 27 January 2016.
- iea-pvps.org PV Power (2007-June) Archived 2009-01-24 at the Wayback Machine
- EurObserv'ER (April 2007). "EurObserv'ER – Photovoltaic Energy Barometer" (PDF). Le Journal des Énergies Renouvelables (178): 49–70. Archived from the original (PDF) on 27 September 2007. Retrieved 7 September 2007.
- Dr. Wissing, Lothar; Jülich, Forschungszentrum; Jülich, Projektträger (May 2007). "National Survey Report of PV Power Applications in Germany 2006 – Version 2" (PDF). PVPS Programme NSRS for Germany. Archived from the original (PDF) on 28 May 2008. Retrieved 20 October 2007.
- Ikki, Osamu; Matsubara, Koji (25 May 2007). "National Survey Report of PV Power Applications in Japan 2006" (PDF). PVPS Programme NSRS for Japan. Archived from the original (PDF) on 28 May 2008. Retrieved 20 October 2007.
- Pedigo, Susannah; Maycock, Paul D.; Bower, Ward (30 August 2007). "National Survey Report of PV Power Applications in The United States of America 2006 – Version 14" (PDF). PVPS Programme NSRS for the USA. Archived from the original (PDF) on 28 May 2008. Retrieved 20 October 2007.
- Guastella, Salvatore; Castello, Salvatore; Anna De Lillo (May 2007). "National Survey Report of PV Power Applications in Italy 2006" (PDF). PVPS Programme NSRS for Italy. Archived from the original (PDF) on 28 May 2008. Retrieved 20 October 2007.
- Watt, Muriel (May 2007). "National Survey Report of PV Power Applications in Australia 2006" (PDF). PVPS Programme NSRS for Australia. Archived from the original (PDF) on 28 May 2008. Retrieved 16 October 2007.
- Yoon, Kyung-Hoon; Kim, Donghwan; Yoon, Kyung Shick (May 2007). "National Survey Report of PV Power Applications in Korea 2006" (PDF). PVPS Programme NSRS for the Republic of Korea. Archived from the original (PDF) on 28 May 2008. Retrieved 20 October 2007.
- Claverie, André; Equer, Bernard (15 July 2007). "Solar Photovoltaic Electricity Applications in France National Survey Report 2006" (PDF). www.iea-pvps.org. Archived from the original (PDF) on 2008-06-25. Retrieved 13 March 2008.
- Swens, Job (May 2007). "National Survey Report of PV Power Applications in The Netherlands 2006" (PDF). PVPS Programme NSRS for the Netherlands. Archived from the original (PDF) on 28 May 2008. Retrieved 20 October 2007.
- Hüsser, Pius; Hostettler, Thomas (2006). "National Survey Report on PV Power Applications in Switzerland 2006" (PDF). IEA-PVPS International Energy Agency. Archived from the original on 22 July 2014. Retrieved 22 July 2014.
- Ayoub, Josef; Martel, Sylvain; Dr Dignard-Bailey, Lisa (May 2007). "National Survey Report of PV Power Applications in Canada 2006" (PDF). PVPS Programme NSRS for Canada. Archived from the original (PDF) on 25 June 2008. Retrieved 16 October 2007.
- Davidson, Sarah (October 2007). "National Survey Report of PV Power Applications in the United Kingdom 2006" (PDF). PVPS Programme NSRS for the United Kingdom. Archived from the original (PDF) on 25 June 2008. Retrieved 16 March 2008.
- Bugge, Lars; Salvesen, Fritjof (30 May 2007). "National Survey Report of PV Power Applications in Norway 2006" (PDF). PVPS Programme NSRS for Norway. Archived from the original (PDF) on 25 June 2008. Retrieved 20 October 2007.
- Malm, Ulf; Stolt, Lars (May 2007). "National Survey Report of PV Power Applications in Sweden 2006" (PDF). PVPS Programme NSRS for Sweden. Archived from the original (PDF) on 25 June 2008. Retrieved 20 October 2007.
- Ahm, Peter (May 2007). "National Survey Report of PV Power Applications in Denmark 2006 – Version 04" (PDF). PVPS Programme NSRS for Denmark. Archived from the original (PDF) on 25 June 2008. Retrieved 20 October 2007.
- Dr. Siderer, Yona; Dann, Roxana (May 2007). "National Survey Report of PV Power Applications in Israel 2006 – Version 14" (PDF). PVPS Programme NSRS for Israel. Archived from the original (PDF) on 25 June 2008. Retrieved 20 October 2007.
- Blakers, Andrew W. (2000). "Solar and Wind Electricity in Australia" (PDF). Australian Journal of Environmental Management. 7 (4): 223–236. doi:10.1080/14486563.2000.10648504. hdl:1885/40851. Archived from the original (– Scholar search) on 31 August 2007. Retrieved 14 February 2008.
- Prometheus Institute, Preliminary Data Hearsay Reference (April 2007). "Eco-Economy Indicators: SOLAR POWER – Data – 23rd Annual Data Collection – Final". PVNews. 26 (4): 8–9. Archived from the original on 7 February 2009. Retrieved 14 April 2008.
- Gulabrai, Lalchand; Ruoss, Daniel; Chen, Wei-nee; Ir Ahmad Hadri Haris (April 2007). "National Survey Report of PV Power Applications in Malaysia 2006 – Version 14" (PDF). www.iea-pvps.org/index.html PVPS Programme – NSRs for Malaysia]. Archived from the original (PDF) on 25 June 2008. Retrieved 20 October 2007.
- "Total photovoltaic power installed in IEA PVPS countries". Archived from the original on 2006-07-11. Retrieved 24 July 2007.
- "Table 1: Installed PV power in reporting IEA PVPS countries as of the end of 2005". iea-pvps.org. Archived from the original on 2006-10-07.
- Total photovoltaic power installed in IEA PVPS countries Archived 2007-02-08 at the Wayback Machine