Solar power in Germany
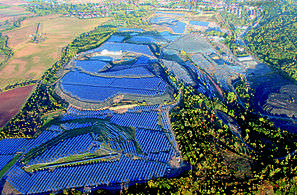
Solar power in Germany consists almost exclusively of photovoltaics (PV) and accounted for an estimated 8.2 percent of the country's gross-electricity generation in 2019.[3][4][5][5] About 1.5 million photovoltaic systems were installed around the country in 2014, ranging from small rooftop systems, to medium commercial and large utility-scale solar parks.[3]:5 Germany's largest solar farms are located in Meuro, Neuhardenberg, and Templin with capacities over 100 MW.

- Nuclear: 71.09 TWh (13.8%)
- Brown Coal: 102.18 TWh (19.9%)
- Hard Coal: 48.69 TWh (9.5%)
- Natural Gas: 54.05 TWh (10.5%)
- Wind: 127.22 TWh (24.8%)
- Solar: 46.54 TWh (9.1%)
- Biomass: 44.42 TWh (8.7%)
- Hydro: 19.23 TWh (3.7%)
Germany has been among the world's top PV installer for several years, with total installed capacity amounting to 41.3 gigawatts (GW) by the end of 2016,[1] behind only China. However, new installations of PV systems have declined steadily since the record year of 2011.[6] It's estimated that by 2017 over 70% of the country's jobs in the solar industry have been lost in the solar sector in recent years.[1] Proponents from the PV industry blame the lack of governmental commitment, while others point out the financial burden associated with the fast-paced roll-out of photovoltaics, rendering the transition to renewable energies unsustainable in their view.[7]
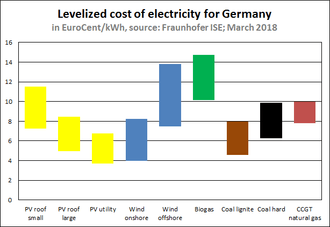
Germany's official governmental goal is to continuously increase renewables' contribution to the country's overall electricity consumption. Long-term minimum targets are 35% by 2020, 50% by 2030 and 80% by 2050.[3]:6 The country is increasingly producing more electricity at specific times with high solar irradiation than it needs, driving down spot-market prices[8] and exporting its surplus of electricity to its neighboring countries, with a record exported surplus of 34 TWh in 2014.[9] A decline in spot-prices may however raise the electricity prices for retail customers, as the spread of the guaranteed feed-in tariff and spot-price increases as well.[3]:17 As the combined share of fluctuating wind and solar is approaching 17 percent on the national electricity mix, other issues are becoming more pressing and others more feasible. These include adapting the electrical grid, constructing new grid-storage capacity, dismantling and altering fossil and nuclear power plants – brown coal and nuclear power are the country's cheapest suppliers of electricity, according to today's calculations – and to construct a new generation of combined heat and power plants.[3]:7
Concentrated solar power (CSP), a solar power technology that does not use photovoltaics, has virtually no significance for Germany, as this technology demands much higher solar insolation. There is, however, a 1.5 MW experimental CSP-plant used for on-site engineering purposes rather than for commercial electricity generation, the Jülich Solar Tower owned by the German Aerospace Center.
History
Germany was one of the first countries to deploy grid-scale PV power. In 2004, Germany was the first country, together with Japan, to reach 1 GW of cumulative installed PV capacity. Since 2004 solar power in Germany has been growing considerably due to the country's feed-in tariffs for renewable energy, which were introduced by the German Renewable Energy Sources Act, and declining PV costs.
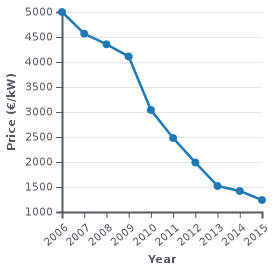
Prices of PV systems decreased more than 50% in the 5 years since 2006.[11] By 2011, solar PV provided 18 TWh of Germany's electricity, or about 3% of the total.[7] That year the federal government set a target of 66 GW of installed solar PV capacity by 2030,[12] to be reached with an annual increase of 2.5–3.5 GW,[13] and a goal of 80% of electricity from renewable sources by 2050.[14]
More than 7 GW of PV capacity were installed annually during the record years of 2010, 2011 and 2012. For this period, the installed capacity of 22.5 GW represented almost 30% of the worldwide deployed photovoltaics.
Since 2013, the number of new installations declined significantly due to more restrictive governmental policies.
Governmental policies
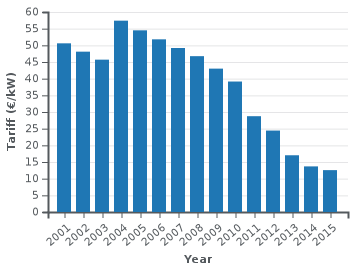
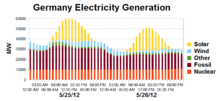
As of 2012, the feed-in tariff (FiT) costs about €14 billion (US$18 billion) per year for wind and solar installations. The cost is spread across all rate-payers in a surcharge of 3.6 €ct (4.6 ¢) per kWh[16] (approximately 15% of the total domestic cost of electricity).[17] On the other hand, as expensive peak power plants are displaced, the price at the power exchange is reduced due to the so-called merit order effect.[18] Germany set a world record for solar power production with 25.8 GW produced at midday on 20 and 21 April 2015.[19]
According to the solar power industry, a feed-in tariff is the most effective means of developing solar power.[20] It is the same as a power purchase agreement, but is at a much higher rate. As the industry matures, it is reduced and becomes the same as a power purchase agreement. A feed-in tariff allows investors a guaranteed return on investment – a requirement for development. A primary difference between a tax credit and a feed-in tariff is that the cost is borne the year of installation with a tax credit, and is spread out over many years with a feed-in tariff. In both cases the incentive cost is distributed over all consumers. This means that the initial cost is very low for a feed-in tariff and very high for a tax credit. In both cases the learning curve reduces the cost of installation, but is not a large contribution to growth, as grid parity is still always reached.[21]
Since the end of the boom period, national PV market has since declined significantly, due to the amendments in the German Renewable Energy Sources Act (EEG) that reduced feed-in tariffs and set constraints on utility-scaled installations, limiting their size to no more than 10 kW.[22]
The previous version of the EEG only guaranteed financial assistance as long as the PV capacity had not yet reached 52 GW. This limit has now been removed. It also foresees to regulate annual PV growth within a range of 2.5 GW to 3.5 GW by adjusting the guaranteed fees accordingly. The legislative reforms stipulates a 40 to 45 percent share from renewable energy sources by 2025 and a 55 to 60 percent share by 2035.[23]
As of November 2016, tenants in North Rhine-Westphalia (NRW) will soon be able to benefit from the PV panels mounted on the buildings in which they live. The state government has introduced measures covering the self-consumption of power, allowing tenants to acquire the electricity generated onsite more cheaply than their regular utility contracts stipulate.[24][25]
Grid capacity and stability issues
Approximately 9 GW of photovoltaic plants in Germany are being retrofitted to shut down[26] if the frequency increases to 50.2 Hz, indicating an excess of electricity on the grid. The frequency is unlikely to reach 50.2 Hz during normal operation, but can if Germany is exporting power to countries that suddenly experience a power failure. This leads to a surplus of generation in Germany, that is transferred to rotating load and generation, which causes system frequency to rise. This happened in 2003 and 2006.[27][28][29]
However, power failures could not have been caused by photovoltaics in 2006, as solar PV played a negligible role in the German energy mix at that time.[30] In December 2012, the president of Germany's "Bundesnetzagentur", the Federal Network Agency, stated that there is "no indication", that the switch to renewables is causing more power outages.[31] Amory Lovins from the Rocky Mountain Institute wrote about the German Energiewende in 2013, calling the discussion about grid stability a "disinformation campaign".[32]
Potential
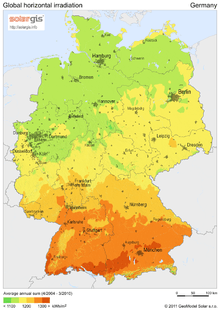
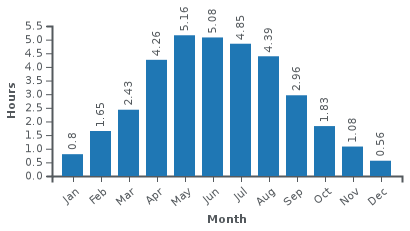
Germany has about the same solar potential as Alaska, which has an average of 3.08 sun hours/day in Fairbanks.
Bremen Sun Hours/day (Avg = 2.92 hrs/day)
Stuttgart Sun Hours/day (Avg = 3.33 hrs/day)
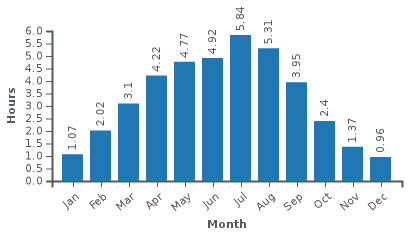
Source: NREL, based on an average of 30 years of weather data.[33]
Statistics
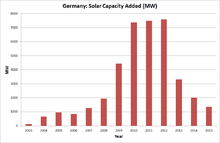
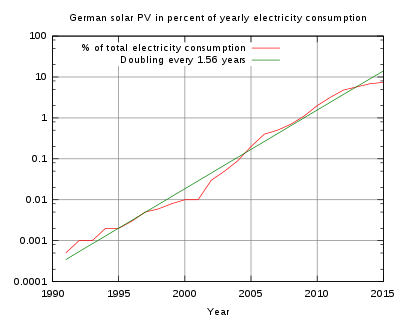
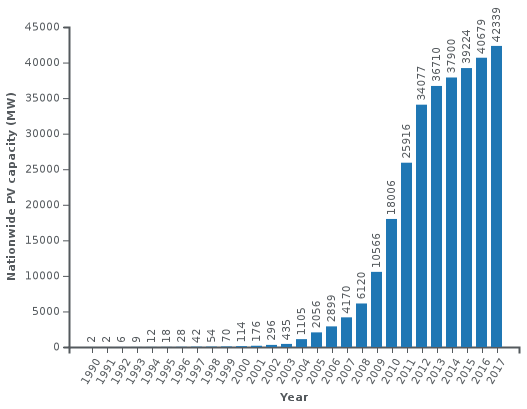
The history of Germany's installed photovoltaic capacity, its average power output, produced electricity, and its share in the overall consumed electricity, showed a steady, exponential growth for more than two decades up to about 2012. Solar PV capacity doubled on average every 18 months in this period; an annual growth rate of more than 50 percent. Since about 2012 growth has slowed down significantly.
Generation
| Year | Capacity (MW) | Annual generation (GWh) | % of gross electricity consumption | Capacity Factor |
|---|---|---|---|---|
| 1990 | 2 | 1 | 2e-04 | 0.06 |
| 1991 | 2 | 1 | 2e-04 | 0.06 |
| 1992 | 6 | 4 | 7e-04 | 0.08 |
| 1993 | 9 | 3 | 6e-04 | 0.04 |
| 1994 | 12 | 7 | 0.001 | 0.07 |
| 1995 | 18 | 7 | 0.001 | 0.04 |
| 1996 | 28 | 12 | 0.002 | 0.05 |
| 1997 | 42 | 18 | 0.003 | 0.05 |
| 1998 | 54 | 35 | 0.006 | 0.07 |
| 1999 | 70 | 30 | 0.005 | 0.05 |
| 2000 | 114 | 60 | 0.01 | 0.06 |
| 2001 | 176 | 76 | 0.013 | 0.05 |
| 2002 | 296 | 162 | 0.028 | 0.06 |
| 2003 | 435 | 313 | 0.052 | 0.08 |
| 2004 | 1105 | 557 | 0.091 | 0.06 |
| 2005 | 2056 | 1282 | 0.21 | 0.07 |
| 2006 | 2899 | 2220 | 0.36 | 0.09 |
| 2007 | 4170 | 3075 | 0.49 | 0.08 |
| 2008 | 6120 | 4420 | 0.72 | 0.08 |
| 2009 | 10566 | 6583 | 1.13 | 0.07 |
| 2010 | 18006 | 11729 | 1.9 | 0.07 |
| 2011 | 25916 | 19599 | 3.23 | 0.09 |
| 2012 | 34077 | 26380 | 4.35 | 0.09 |
| 2013 | 36710 | 31010 | 5.13 | 0.1 |
| 2014 | 37900 | 36056 | 6.08 | 0.11 |
| 2015 | 39224 | 38726 | 6.5 | 0.11 |
| 2016 | 40679 | 38098 | 6.4 | 0.11 |
| 2017 | 42339 | 39401 | 6.6 | 0.11 |
| 2018 | 45181 | 45784 | 7.7 | |
| 2019 | 49016 | 47517 | 8.2 | |
| Source: Federal Ministry for Economic Affairs and Energy, for capacity figures[5]:7 and other figures[5]:16–41 Note: This table does not show net-consumption but gross electricity consumption, which includes self consumption of nuclear and coal-fire power plants. For 2014, net-consumption stands at approximately 6.9% (vs. 6.1% for gross-consumption).[3]:5 | ||||
Source: Federal Ministry for Economic Affairs and Energy[5]:7
Solar PV by type
| Installed PV capacity in Germany by class size 2017[35] | |
|---|---|
| <10 kW | 14.2% |
| 10–100 kW | 38.2% |
| 100–500 kW | 14.1% |
| >500 kW | 33.5% |
Systems of less than 10 kW accounted for 14.2% of totalled installed capacity. These are single direct use systems, mostly residential solar pv systems. Systems rated 10–100 kW represented 38.2% of capacity and represents systems used collectively within one place such as a large residential block or large commercial premise or intensive agricultural units. The next class size of systems 100–500 kW represented 14.1% of capacity and would typically be larger commercial centres, hospitals, schools or industrial / agricultural premises or smaller ground mounted systems. The final category of systems rated over 500 kW accounted for 33.5% and mostly represent district power systems, ground mounted panels providing power to perhaps a mix of industrial and commercial sites. It is interesting to note that whilst large power plants receive a lot of attention in solar power articles, installations under 0.5 MW in size actually represent nearly two thirds of the installed capacity in Germany in 2017.
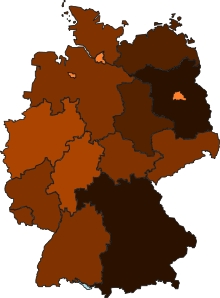
PV capacity by federal states
|
10 – 50 Watts
50 – 100 Watts
100 – 200 Watts
200 – 350 Watts |
350 – 500 Watts
500 – 750 Watts
>750 Watts |
Germany is made up of sixteen, partly sovereign federal states or Länder. The southern states of Bavaria and Baden-Württemberg account for about half of the total, nationwide PV deployment and are also the wealthiest and most populous states after North Rhine-Westphalia. However, photovoltaic installations are widespread throughout the sixteen states and are not limited to the southern region of the country as demonstrated by a watts per capita distribution.
| State | 2008 | 2009 | 2010 | 2011 | 2012 | 2013 | 2014 | 2015 |
|---|---|---|---|---|---|---|---|---|
| 1,245 | 1,772 | 2,907 | 3,753 | 5,838.0 | 6,111.8 | 4,984.5 | 5,117.0 | |
| 2,359 | 3,955 | 6,365 | 7,961 | 9,700.5 | 10,424.7 | 11,099.8 | 11,309.2 | |
| 11 | 19 | 68 | 50 | 63.2 | 68.6 | 80.5 | 83.9 | |
| 72 | 219 | 638 | 1,313 | 2,576.1 | 2,711.2 | 2,901.0 | 2,981.5 | |
| 4 | 5 | 14 | 30 | 32.3 | 35.3 | 39.9 | 42.2 | |
| 7 | 9 | 27 | 25 | 32.1 | 35.8 | 36.5 | 36.9 | |
| 350 | 549 | 868 | 1,174 | 1,520.9 | 1,661.8 | 1,768.5 | 1,811.2 | |
| 352 | 709 | 1,479 | 2,051 | 3,045.1 | 3,257.4 | 3,490.6 | 3,580.4 | |
| 48 | 88 | 263 | 455 | 957.7 | 1,098.5 | 1,337.9 | 1,414.4 | |
| 617 | 1,046 | 1,925 | 2,601 | 3,582.0 | 3,878.5 | 4,234.9 | 4,363.7 | |
| 332 | 504 | 841 | 1,124 | 1,528.2 | 1,670.8 | 1,862.2 | 1,920.5 | |
| 67 | 100 | 158 | 218 | 318.8 | 365.4 | 407.3 | 415.8 | |
| 168 | 288 | 529 | 836 | 1,280.8 | 1,412.3 | 1,575.1 | 1,607.5 | |
| 94 | 181 | 450 | 817 | 1,377.9 | 1,556.1 | 1,828.7 | 1,962.6 | |
| 159 | 310 | 695 | 992 | 1,351.5 | 1,407.8 | 1,468.6 | 1,498.3 | |
| 95 | 159 | 327 | 467 | 871.7 | 1,013.9 | 1,119.9 | 1,187.4 | |
| Cumulative total installed | 5,979 | 9,913 | 17,554 | 23,866 | 34,076.7 | 36,710.1 | 38,236.0 | 39,332.4 |
| Capacity added | N/A | 3,934 | 7,641 | 6,312 | 10,210.7 | 2,633.4 | 1,525.9 | 1,096.4 |
Photovoltaic power stations
| PV Power station | Capacity in MW p |
Notes |
|---|---|---|
| Solarpark Meuro | 166 | 70 MW completed 2011, 166 MW in 2012[45] |
| Neuhardenberg Solar Park | 145 | Completed September 2012[45][46] |
| Templin Solar Park | 128.5 | Completed September 2012[45][47] |
| Brandenburg-Briest Solarpark | 91 | Commissioned in December 2011 |
| Solarpark Finow Tower | 84.7 | Completed in 2010/2011 |
| Eggebek Solar Park | 83.6 | Completed in 2011 |
| Senftenberg Solarpark | 82 | Phase II and III completed 2011, another 70 MW phase planned[48] |
| Finsterwalde Solar Park | 80.7 | Phase I completed 2009, phase II and III 2010[49][50] |
| Lieberose Photovoltaic Park | 71.8 | Completed in 2009[51][52] |
| Solarpark Alt Daber | 67.8 | Completed in 2011[45] |
| Strasskirchen Solar Park | 54 | Commissioned in December 2009[45] |
| Walddrehna Solar Park | 52.3 | Completed June 2012 |
| Waldpolenz Solar Park | 52 | 550,000 CdTe modules. Completed December 2008[53][54] |
| Tutow Solar Park | 52 | Tutow I completed in 2009, II in 2010, III in 2011 |
| Kothen Solar Park | 45 | Operational since 2009 |
| Jura Solar Park | 43 | Completed in 2014[55] |
| Jännersdorf Solar Park | 40.5 | Commissioned in 2012 |
| Fürstenwalde Solar Park | 39.6 | Commissioned in 2011 |
| Reckahn Solar Park | 36 | Completed in 2011 |
| Perleberg Solar Park | 35 | Completed in 2012 |
| Krughütte Solar Park | 29.1 | Completed in 2012 |
| Solarpark Heideblick | 27.5 | Completed in 2011 |
| Solarpark Eiche | 26.5 | Completed in 2011 |
| Lauingen Energy Park | 25.7 | Completed in 2010 |
| Pocking Solar Park | 22 | Completed in March 2006 |
| Mengkofen Solar Park | 21.7 | Commissioned in December 2009 |
| Rothenburg Solar Park | 20 | Commissioned in 2009 |
| Name & Description | Capacity in MW p |
Location | Annual yield in MWh |
Capacity factor | Coordinates |
|---|---|---|---|---|---|
| Erlasee Solar Park, 1408 SOLON | 12 | Arnstein | 14,000 | 0.13 | 50°0′10″N 9°55′15″E |
| Gottelborn Solar Park | 8.4 | Göttelborn | n.a. | n.a. | – |
| Bavaria Solarpark, 57,600 solar modules | 6.3 | Mühlhausen | 6,750 | 0.12 | 49°09′29″N 11°25′59″E |
| Rote Jahne Solar Park, 92,880 thin-film modules, First Solar, FS-260, FS-262 and FS-265[57][58] |
6.0 | Doberschütz | 5,700 | 0.11 | – |
| Bürstadt Solar Farm, 30,000 BP Solar modules | 5.0 | Bürstadt | 4,200 | 0.10 | 49°39′N 8°28′E |
| Espenhain, 33,500 Shell Solar modules | 5.0 | Espenhain | 5,000 | 0.11 | 51°12′N 12°31′E |
| Geiseltalsee Solarpark, 24,864 BP solar modules | 4.0 | Merseburg | 3,400 | 0.10 | 51°22′N 12°0′E |
| Hemau Solar Farm, 32,740 solar modules | 4.0 | Hemau | 3,900 | 0.11 | 49°3′N 11°47′E |
| Solara, Sharp and Kyocera solar modules | 3.3 | Dingolfing | 3,050 | 0.11 | 48°38′N 12°30′E |
| Solarpark Herten, 11.319 Modules from Astronergy | 3 | Rheinfelden | 3,000 | 0.11 | 47°32′39″N 7°43′30″E |
| Bavaria Solarpark, Sharp solar modules | 1.9 | Günching | n.a. | n.a. | 49°16′N 11°34′E |
| Bavaria Solarpark, Sharp solar modules | 1.9 | Minihof | n.a. | n.a. | – |
Gallery
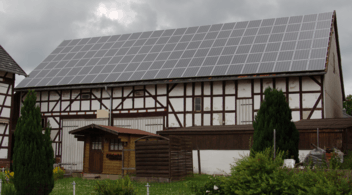 Rooftop solar on half-timbered house
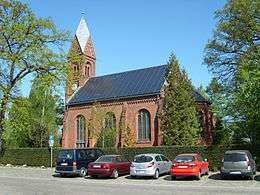 Solar panels on a church
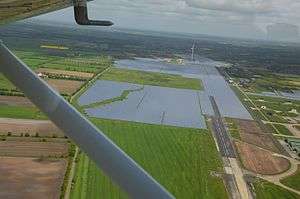
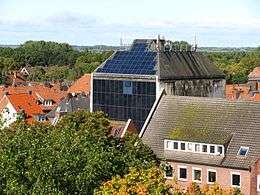 Old bunker cladded with solar
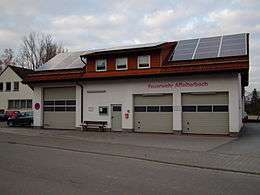 Rooftop solar PV on a fire department building
 PV system on a barn
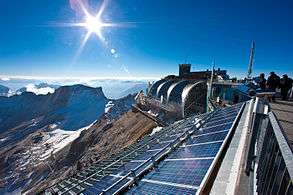 Zugspitze, Germany's highest situated PV system
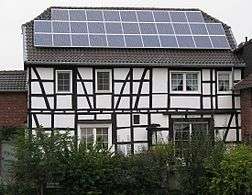 A small, roof-top mounted PV system in Bonn
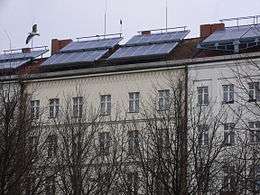
 The Waldpolenz Solar Park uses thin-film CdTe-modules
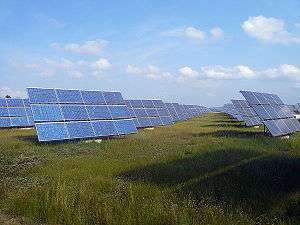 Erlasee was the world's largest solar farm in 2006/2007
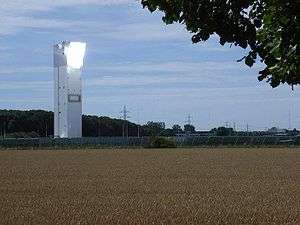 The Jülich Solar Tower, a concentrated solar power plant
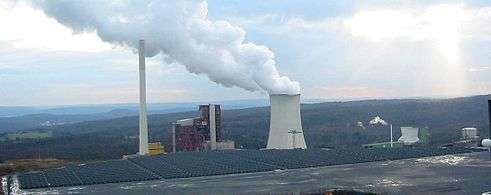 The Gottelborn Solar Park in front of coal-fired power plant "Weiher III".
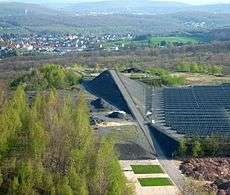 Viewing platform at the Gottelborn Solar Park
Companies
Some companies have collapsed since 2008, facing harsh competition from imported solar panels. Some were taken over like Bosch Solar Energy by SolarWorld. Major German solar companies include:
See also
- German Solar Industry Association
- Renewable energy in Germany
- Solar power in the European Union
- Solar power by country
- Wind power in Germany
- Geothermal power in Germany
- Renewable energy by country
References
- "GERMANY: SOLAR POWER FACTSHEET 2016". Strom-Report.
- Burger, Bruno (15 January 2020). Public Net Electricity Generation in Germany 2019 (pdf). ise.fraunhofer.de. Freiburg, Germany: Fraunhofer Institute for Solar Energy Systems ISE. Retrieved 2 February 2020.
- "Recent facts about photovoltaics in Germany". Fraunhofer ISE. 19 May 2015. Retrieved 3 July 2015.
- "Electricity production from solar and wind in Germany in 2014" (pdf). Germany: Fraunhofer Institute for Solar Energy Systems ISE. 21 July 2014. p. 5. Archived from the original on 22 July 2014. Retrieved 22 July 2014.
- Bundesministerium für Wirtschaft und Energie. "Zeitreihen zur Entwicklung der erneuerbaren Energien in Deutschland" (pdf). Retrieved 13 January 2019.
- "Germany adds about 610 MWp of solar PV in H1 2015". Renewables Now. 3 August 2015.
- "German solar power output up 60 pct in 2011". Reuters. 29 December 2011. Retrieved 2 January 2012.
- "Electricity Spot-Prices and Production Data in Germany 2013" (PDF). fraunhofer.de.
- "Electricity production from solar and wind in Germany in 2014 (German version)" (pdf). Germany: Fraunhofer Institute for Solar Energy Systems ISE. 5 January 2015. pp. 2, 3, 6. Retrieved 5 January 2015.
- Average turn-key prices for roof-top PV systems up to 100 kWp. Sources: for data since 2009 photovoltaik-guide.de, pv-preisindex , using for each year average price of month of January. Data source for previous years (2006–2008), see Bundesverband Solarwirtschaft e.V. (BSW-Solar), September 2009, page 4, quarterly figures from EUPD-Research.
- "BSW-Solar – Statistische Zahlen der deutschen Solarstrombranche (Photovoltaik), Oct 2011" (PDF). solarwirtschaft.de.
- Property Wire (22 April 2010). "Germany Reducing Incentives For Solar Property Investment". NuWire Investor. Retrieved 10 September 2010.
- Lang, Matthias (21 November 2011). "New German 7.5 GWp PV Record by End of 2011". German Energy Blog. Retrieved 9 January 2012.
- Germany
- "Annual Report 2015". IEA-PVPS. 13 May 2016. p. 63.
- Lang, Matthias (14 October 2011). "2012 EEG Surcharge Increases Slightly to 3.592 ct/kWh". German Energy Blog. Retrieved 9 January 2012.
- "Europe's Energy Portal » Fuel, Natural Gas and Electricity Prices From Past to Present".
- Morris, Craig (2 February 2012). "Merit order effect of PV in Germany". Renewables International. Retrieved 17 May 2012.
- "Transparency in Energy Markets – Germany".
- "The U.S. Needs a Feed-in Tariff". www.pennenergy.com.
- "PV Learning Curves:Past and Future Drivers of Cost Reduction" (PDF). q-cells.com.
- "Changes for solar in Germany". renewablesinternational.net. 3 April 2014. Archived from the original on 12 May 2014. Retrieved 12 May 2014.
- Energie, Bundesministerium für Wirtschaft und. "Erneuerbare Energien". www.bmwi.de.
- "Federal state supports "tenant electricity" models with solar PV". Clean Energy Wire (CLEW). Berlin, Germany. 1 November 2016. Retrieved 1 November 2016.
- "Minister Remmel: "NRW macht es vor — Mieterinnen und Mieter können künftig auch von der Energiewende profitieren." — Umweltministerium fördert Mieterstrom-Modelle und Energiespeicher" [Minister Remmel: "NRW makes it possible — tenants can also benefit from the Energiewende in the future." — Environment Ministry promotes tenant electricity models and energy storage] (Press release) (in German). Düsseldorf, Germany: Umweltministerium North Rhine-Westphalia. 31 October 2016. Retrieved 1 November 2016.
- Lang, Matthias. "Study Recommends Retrofitting of PV Power Plants to Solve 50.2 Hz Problem". German Energy Blog. Retrieved 15 February 2017.
- The "50.2 Hz" problem for photovoltaic power plants Archived 23 June 2012 at the Wayback Machine
- "Timeline of the utility frequency: Timeline".
- "Impact of Large-scale Distributed Generation on Network Stability During Over-Frequency Events & Development of Mitigation Measures" (PDF). ecofys.com.
- Michael Döring (1 January 2013). "Dealing with the 50.2 Hz problem". Archived from the original on 13 July 2014. Retrieved 13 July 2014.
- "Germany's Network Agency says power outages "unlikely"". 6 December 2012. Archived from the original on 13 July 2014. Retrieved 13 July 2014.
- Amory Lovins (23 August 2013). "Separating Fact from Fiction in Accounts of Germany's Renewables Revolution". Archived from the original on 13 July 2014.
- "PV Watts". NREL. Retrieved 1 July 2016.
- "Studie: Stromgestehungskosten erneuerbare Energien - März 2018". Fraunhofer ISE. 2018. Retrieved 2 April 2018.
- "EXISTING AND FUTURE PV PROSUMER CONCEPTS , pg. 18" (PDF).
- "Global Market Outlook for Photovoltaics 2014-2018". www.epia.org. EPIA – European Photovoltaic Industry Association. p. 24. Archived from the original (PDF) on 12 June 2014. Retrieved 12 June 2014.
- Bundesnetzagentur – EEG-Statistikbericht 2008
- "Bundesnetzagentur – EEG-Statistikbericht 2009" (PDF). clearingstelle-eeg.de.
- Bundesnetzagentur – EEG-Statistikbericht 2010
- Bundesnetzagentur – EEG-Statistikbericht 2011
- "Bundesnetzagentur – EEG in Zahlen 2012". bundesnetzagentur.de.
- "Bundesnetzagentur – EEG in Zahlen 2013". bundesnetzagentur.de.
- Bundesnetzagentur – EEG in Zahlen 2014
- "Bundesnetzagentur – Installierte EE-Leistung zum 31.12.2015 (vorläufig)" (PDF). bundesnetzagentur.de.
- PV Resources.com (2009). World's largest photovoltaic power plants
- "Contract for services". LIMA Group GmbH.
- CFB News: Commerz Real Acquires Germany's Largest Solar Park. "CFB-Fonds".
- "SolarServer: 78 MW of the world's largest solar photovoltaic plant connected to grid in Senftenberg, Germany".
- "Good Energies, NIBC Infrastructure Partners acquire Finsterwalde II and Finsterwalde III". pv-tech.org.
- "Implementation of the 39 MWp – "Solar Park Finsterwalde II and Finsterwalde III"" (PDF). u-energy.de.
- "Lieberose solar farm becomes Germany's biggest, World's second-biggest".
- SPIEGEL ONLINE, Hamburg, Germany (20 August 2009). "Leaders In Alternative Energy: Germany Turns On World's Biggest Solar Power Project". SPIEGEL ONLINE.CS1 maint: multiple names: authors list (link)
- "Germany's largest Solar parks connected to the grid (19 Dec 08)" (PDF). juwi.de.
- "Large photovoltaic plant in Muldentalkreis". sonnenseite.com.
- Photovoltaik in Oberfranken: IBC SOLAR stellt Jura-Solarpark mit insgesamt 43 MW fertig; Energiewende soll den Wirtschaftsstandort auch künftig stärken, 26 February 2014
- "Large-Scale Photovoltaic Power Plants – Top 50".
- Construction Complete on 6 MW Thin-Film PV Installation in Germany Renewable Energy Access, 5 April 2007.
- https://www.webcitation.org/6QwLVgSYo Rote Jahne Factsheet (de)
External links
| Wikimedia Commons has media related to Solar power in Germany. |
- Energy Charts – interactive graphs of German electricity production and market prices (Fraunhofer ISE)
- Cloudy Germany a Powerhouse in Solar Energy, Washington Post, 2007
- Southern Germany develops its PV Capacities
- Cloudy Germany unlikely hotspot for solar power
- Germany's sunny revolution
- World's Biggest Solar Plant Goes Online in Germany
- Official site about solar power and renewable Energy in the Emscher-Lippe-Region (German)
- Frondel, Manuel; Christoph M. Schmidt; Nolan Ritter; Colin Vance (November 2009). "Economic Impacts from the Promotion of Renewable Energy Technologies — The German Experience" (PDF). Ruhr Economic Papers. RWI Essen. Retrieved 26 November 2010.
- "Performance of Photovoltaics (PV) in Germany". SMA Solar Technology AG. Retrieved 4 August 2011.
| Africa |
| ||||
|---|---|---|---|---|---|
| Asia | |||||
| Europe |
| ||||
| North America | |||||
| Oceania | |||||
| South America | |||||
| |||||