Grant County, Kansas
Grant County (county code GT) is a county located in the U.S. state of Kansas. As of the 2010 census, the county population was 7,829.[1] Its county seat and only city is Ulysses.[2]
Grant County | |
|---|---|
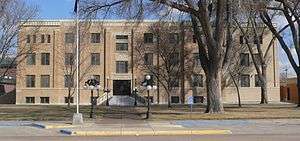 Grant County courthouse in Ulysses | |
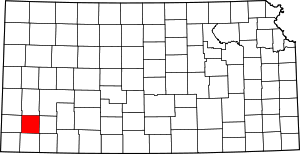 Location within the U.S. state of Kansas | |
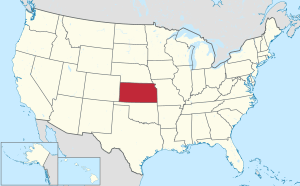 Kansas's location within the U.S. | |
| Coordinates: 37°35′00″N 101°19′59″W | |
| Country | |
| State | |
| Founded | March 20, 1873 |
| Named for | Ulysses S. Grant |
| Seat | Ulysses |
| Largest city | Ulysses |
| Area | |
| • Total | 575 sq mi (1,490 km2) |
| • Land | 575 sq mi (1,490 km2) |
| • Water | 0.3 sq mi (0.8 km2) 0.06%% |
| Population | |
| • Estimate (2018) | 7,336 |
| • Density | 14/sq mi (5/km2) |
| Time zone | UTC−6 (Central) |
| • Summer (DST) | UTC−5 (CDT) |
| Congressional district | 1st |
| Website | GrantCoKS.org |
History
In 1873, the part of Kansas west of Range 25 was divided into 25 new counties. The new counties were Decatur, Rawlins, Cheyenne, Sheridan, Thomas, Sherman, Lane, Buffalo, Foote, Meade, Scott, Sequoyah, Arapahoe, Seward, Wichita, Kearny, Greeley, Hamilton, Stanton, Kansas, Stevens, and Grant.[3]
Grant County, Kansas was named after Ulysses S. Grant, the 18th President of the United States (1869–1877), and incumbent president at the time of the county's formation.[4] The initial survey establishing county boundaries was in the summer of 1874.[4]
In 1883, Kearny, Sequoyah, Arapahoe, Kansas, Stevens, Meade, Clark and Grant counties disappeared. Hamilton, Ford, Seward, and Hodgeman counties enlarged and Finney County was created. Grant County was split with the western portion becoming a part of Hamilton County and the eastern portion becoming a part of the newly created Finney County.[3]
On June 9, 1888, Grant County was again established as a Kansas county, with original county boundaries, with the first officers of the new Grant County being sworn in on June 18, 1888.[3]

In October 1888, the county seat election for Grant County resulted in victory for Ulysses, Kansas, election results were:.[3]
| Town Name | Vote count |
|---|---|
| Ulysses | 578 |
| Appomattox | 268 |
| Shockeyville | 41 |
| Golswn | 31 |
| Spurgeon | 2 |
Geography
According to the U.S. Census Bureau, the county has a total area of 575 square miles (1,490 km2), of which 575 square miles (1,490 km2) is land and 0.3 square miles (0.78 km2) (0.06%) is water.[5]
Major highways


Adjacent counties
- Kearny County (north)
- Finney County (northeast)
- Haskell County (east)
- Stevens County (south)
- Stanton County (west)
- Hamilton County (northwest)
Demographics
| Historical population | |||
|---|---|---|---|
| Census | Pop. | %± | |
| 1890 | 1,308 | — | |
| 1900 | 422 | −67.7% | |
| 1910 | 1,087 | 157.6% | |
| 1920 | 1,087 | 0.0% | |
| 1930 | 3,092 | 184.5% | |
| 1940 | 1,946 | −37.1% | |
| 1950 | 4,638 | 138.3% | |
| 1960 | 5,269 | 13.6% | |
| 1970 | 5,961 | 13.1% | |
| 1980 | 6,977 | 17.0% | |
| 1990 | 7,159 | 2.6% | |
| 2000 | 7,909 | 10.5% | |
| 2010 | 7,829 | −1.0% | |
| Est. 2018 | 7,336 | [6] | −6.3% |
| U.S. Decennial Census[7] 1790-1960[8] 1900-1990[9] 1990-2000[10] 2010-2016[1] | |||

As of the 2000 census,[11] there were 7,909 people, 2,742 households, and 2,097 families residing in the county. The population density was 14 people per square mile (5/km²). There were 3,027 housing units at an average density of 5 per square mile (2/km²). The racial makeup of the county was 77.00% White, 0.86% Native American, 0.37% Asian, 0.21% Black or African American, 19.46% from other races, and 2.10% from two or more races. Hispanic or Latino of any race were 34.67% of the population.
There were 2,742 households out of which 43.60% had children under the age of 18 living with them, 66.40% were married couples living together, 7.10% had a female householder with no husband present, and 23.50% were non-families. 21.00% of all households were made up of individuals and 8.20% had someone living alone who was 65 years of age or older. The average household size was 2.86 and the average family size was 3.34.
In the county, the population was spread out with 32.80% under the age of 18, 8.70% from 18 to 24, 28.70% from 25 to 44, 20.20% from 45 to 64, and 9.60% who were 65 years of age or older. The median age was 31 years. For every 100 females there were 100.70 males. For every 100 females age 18 and over, there were 97.50 males.
The median income for a household in the county was $39,854, and the median income for a family was $44,914. Males had a median income of $34,464 versus $22,000 for females. The per capita income for the county was $17,072. About 6.50% of families and 10.10% of the population were below the poverty line, including 13.60% of those under age 18 and 7.50% of those age 65 or over.
Government
Presidential elections
Grant County is heavily republican. Lyndon B. Johnson was the last democrat to win the county, and Jimmy Carter narrowly lost the county in 1976. Michael Dukakis (as of 2016) is the last democrat to win more than a quarter of the county's vote.
| Year | Republican | Democratic | Third Parties |
|---|---|---|---|
| 2016 | 75.5% 1,804 | 18.5% 441 | 6.0% 144 |
| 2012 | 78.5% 1,811 | 19.8% 456 | 1.7% 39 |
| 2008 | 75.0% 1,995 | 23.9% 635 | 1.2% 31 |
| 2004 | 78.6% 2,169 | 20.3% 561 | 1.0% 28 |
| 2000 | 74.4% 2,126 | 23.9% 683 | 1.7% 47 |
| 1996 | 66.5% 1,772 | 23.8% 633 | 9.7% 259 |
| 1992 | 51.7% 1,561 | 20.5% 619 | 27.8% 839 |
| 1988 | 63.7% 1,654 | 34.9% 907 | 1.4% 36 |
| 1984 | 76.3% 2,043 | 23.0% 615 | 0.8% 21 |
| 1980 | 66.0% 1,711 | 26.4% 683 | 7.6% 198 |
| 1976 | 50.6% 1,226 | 47.5% 1,151 | 1.9% 45 |
| 1972 | 73.2% 1,469 | 23.7% 476 | 3.1% 62 |
| 1968 | 57.2% 1,121 | 31.5% 618 | 11.3% 222 |
| 1964 | 41.0% 727 | 57.6% 1,023 | 1.4% 25 |
| 1960 | 63.6% 1,235 | 36.2% 702 | 0.3% 5 |
| 1956 | 69.5% 1,058 | 30.1% 459 | 0.4% 6 |
| 1952 | 71.0% 1,277 | 27.9% 502 | 1.1% 19 |
| 1948 | 53.3% 742 | 44.9% 625 | 1.7% 24 |
| 1944 | 66.4% 566 | 33.1% 282 | 0.6% 5 |
| 1940 | 61.0% 614 | 38.0% 382 | 1.0% 10 |
| 1936 | 43.6% 476 | 56.4% 616 | 0.0% 0 |
| 1932 | 33.7% 395 | 62.9% 737 | 3.4% 40 |
| 1928 | 76.4% 635 | 22.3% 185 | 1.3% 11 |
| 1924 | 67.1% 459 | 21.6% 148 | 11.3% 77 |
| 1920 | 73.7% 339 | 23.5% 108 | 2.8% 13 |
| 1916 | 44.5% 200 | 46.3% 208 | 9.1% 41 |
| 1912 | 20.8% 56 | 29.7% 80 | 49.4% 133 |
| 1908 | 54.8% 178 | 40.9% 133 | 4.3% 14 |
| 1904 | 65.9% 81 | 28.5% 35 | 5.7% 7 |
| 1900 | 51.8% 58 | 47.3% 53 | 0.9% 1 |
| 1896 | 46.0% 51 | 54.1% 60 | 0.0% 0 |
| 1892 | 53.6% 151 | 46.5% 131 | |
| 1888 | 50.5% 390 | 31.7% 245 | 17.9% 138 |
Education
Unified school districts
Communities
City
Unincorporated communities
Townships
Grant County is divided into three townships. None of the cities within the county are considered governmentally independent, and all figures for the townships include those of the cities. In the following table, the population center is the largest city (or cities) included in that township's population total, if it is of a significant size.
| Township | FIPS | Population center |
Population | Population density /km² (/sq mi) |
Land area km² (sq mi) | Water area km² (sq mi) | Water % | Geographic coordinates |
|---|---|---|---|---|---|---|---|---|
| Lincoln | 40725 | Ulysses | 7,058 | 19 (49) | 372 (144) | 0 (0) | 0.10% | 37°34′26″N 101°20′30″W |
| Sherman | 64975 | 498 | 1 (2) | 559 (216) | 0 (0) | 0.01% | 37°39′23″N 101°17′59″W | |
| Sullivan | 68875 | 353 | 1 (2) | 558 (215) | 0 (0) | 0.01% | 37°28′12″N 101°18′11″W | |
| Sources: "Census 2000 U.S. Gazetteer Files". U.S. Census Bureau, Geography Division. Archived from the original on 2002-08-02. | ||||||||
See also
- Dry counties
|
|
References
- "State & County QuickFacts". United States Census Bureau. Archived from the original on August 6, 2011. Retrieved July 24, 2014.
- "Find a County". National Association of Counties. Archived from the original on 2011-05-31. Retrieved 2011-06-07.
- Ulysses 1885-1909 From Boom to Bust; compiled by The Historic Adobe Museum Staff of Ulysses, Kansas; 2009.
- Bessire, Fern (1982). Grant County, Kansas. Grant County History Commission.
- "US Gazetteer files: 2010, 2000, and 1990". United States Census Bureau. 2011-02-12. Retrieved 2011-04-23.
- "Population and Housing Unit Estimates". Retrieved December 23, 2019.
- "U.S. Decennial Census". United States Census Bureau. Retrieved July 24, 2014.
- "Historical Census Browser". University of Virginia Library. Retrieved July 24, 2014.
- "Population of Counties by Decennial Census: 1900 to 1990". United States Census Bureau. Retrieved July 24, 2014.
- "Census 2000 PHC-T-4. Ranking Tables for Counties: 1990 and 2000" (PDF). United States Census Bureau. Retrieved July 24, 2014.
- "U.S. Census website". United States Census Bureau. Retrieved 2008-01-31.
- http://uselectionatlas.org/RESULTS
- "Map of Wet and Dry Counties". Alcoholic Beverage Control, Kansas Department of Revenue. November 2008. Archived from the original on 2007-10-08. Retrieved 2009-09-09.
Further reading
External links
| Wikimedia Commons has media related to Grant County, Kansas. |
- County
- Maps
- Grant County Map, GrantCoKs.org
- Grant County Maps: Current, Historic, KDOT
- Kansas Highway Maps: Current, Historic, KDOT
- Kansas Railroad Maps: Current, 1996, 1915, KDOT and Kansas Historical Society
Places adjacent to Grant County, Kansas | ||||||||||
|---|---|---|---|---|---|---|---|---|---|---|
| ||||||||||
Municipalities and communities of Grant County, Kansas, United States | ||
|---|---|---|
| City | Map of Kansas highlighting Grant County | |
| Unincorporated communities | ||
| Townships | ||
| Authority control |
|
|---|