Edmonton East
Edmonton East (formerly known as Edmonton Centre-East) was a federal electoral district in Alberta, Canada, that was represented in the House of Commons of Canada from 1917 to 2015.
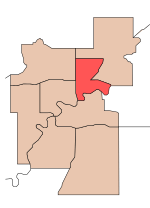
Edmonton East in relation to other federal electoral districts in Edmonton | |
| Defunct federal electoral district | |
| Legislature | House of Commons |
| District created | 1914 |
| District abolished | 2013 |
| First contested | 1917 |
| Last contested | 2011 |
| District webpage | profile, map |
| Demographics | |
| Population (2011)[1] | 135,254 |
| Electors (2011) | 92,495 |
| Area (km²)[2] | 48.98 |
| Census divisions | Division No. 11 |
| Census subdivisions | Edmonton |
The district included a portion of the city of Edmonton.
History
This riding was originally created in 1914 as "Edmonton East" from Edmonton and Victoria ridings. At the time of its creation, this district included a massive, sparsely-populated rural area. Most of this area was removed due to the creation of Athabaska in 1924, and although it gained some back when Pembina riding was abolished in 1987, it is now an urban riding.
As Edmonton's population has grown, Edmonton East has also lost urban areas to new ridings. Edmonton East lost area due to creation of Edmonton—Strathcona (1952), Edmonton Centre (1966), Edmonton North (1976), and Edmonton Northwest (1987). It gained area to due the (temporary) abolition of Edmonton Centre in 1979.
In 2000, it was renamed "Edmonton Centre-East". In 2003 Edmonton Centre-East was abolished and redistributed into a re-created Edmonton Centre, a new Edmonton East riding, and Edmonton—Sherwood Park.
The new "Edmonton East" riding was created from parts of Edmonton Centre-East and Edmonton North.
Members of Parliament
This riding has elected the following members of the House of Commons of Canada:
| Parliament | Years | Member | Party | |
|---|---|---|---|---|
| Edmonton East Riding created from Edmonton and Victoria |
||||
| 22nd | 1953–1957 | Ambrose Holowach | Social Credit | |
| 23rd | 1957–1958 | |||
| 24th | 1958–1962 | William Skoreyko | Progressive Conservative | |
| 25th | 1962–1963 | |||
| 26th | 1963–1965 | |||
| 27th | 1965–1968 | |||
| 28th | 1968–1972 | |||
| 29th | 1972–1974 | |||
| 30th | 1974–1979 | |||
| 31st | 1979–1980 | William Yurko | ||
| 32nd | 1980–1984 | |||
| 33rd | 1984–1988 | William Lesick | ||
| 34th | 1988–1993 | Ross Harvey | New Democratic | |
| 35th | 1993–1997 | Judy Bethel | Liberal | |
| 36th | 1997–2000 | Peter Goldring | Reform | |
| 2000–2000 | Alliance | |||
| Riding renamed — Edmonton Centre-East | ||||
| 37th | 2000–2003 | Peter Goldring | Alliance | |
| 2003–2004 | Conservative | |||
| Riding renamed — Edmonton East | ||||
| 38th | 2004–2006 | Peter Goldring | Conservative | |
| 39th | 2006–2008 | |||
| 40th | 2008–2011 | |||
| 41st | 2011–2011 | |||
| 2011–2013 | Independent | |||
| 2013–2015 | Conservative | |||
| Riding dissolved into Edmonton Griesbach, Edmonton Manning and Edmonton Strathcona |
||||
Election results
Edmonton East, 2004-2015
| 2011 Canadian federal election | ||||||||
|---|---|---|---|---|---|---|---|---|
| Party | Candidate | Votes | % | ±% | Expenditures | |||
| Conservative | Peter Goldring | 24,111 | 52.75 | +1.44 | $74,313 | |||
| New Democratic | Ray Martin | 17,078 | 37.36 | +5.56 | $55,462 | |||
| Liberal | Shafik Ruda | 3,176 | 6.95 | -3.98 | $17,634 | |||
| Green | Trey Capnerhurst | 1,345 | 2.94 | -3.00 | $2,546 | |||
| Total valid votes/Expense limit | 45,710 | 100.00 | $95,270 | |||||
| Total rejected ballots | 194 | 0.42 | +0.06 | |||||
| Turnout | 45,904 | 50.27 | +4.84 | |||||
| Eligible voters | 91,321 | – | – | |||||
| 2008 Canadian federal election | ||||||||
|---|---|---|---|---|---|---|---|---|
| Party | Candidate | Votes | % | ±% | Expenditures | |||
| Conservative | Peter Goldring | 21,487 | 51.31 | +1.18 | $72,687 | |||
| New Democratic | Ray Martin | 13,318 | 31.80 | +13.33 | $27,417 | |||
| Liberal | Stephanie Laskoski | 4,578 | 10.93 | -15.23 | $9,666 | |||
| Green | Trey Capnerhurst | 2,488 | 5.94 | +0.70 | $752 | |||
| Total valid votes/Expense limit | 41,871 | 100.00 | $92,946 | |||||
| Total rejected ballots | 151 | 0.36 | -0.01 | |||||
| Turnout | 42,022 | 45.43 | -9.9 | |||||
| 2006 Canadian federal election | ||||||||
|---|---|---|---|---|---|---|---|---|
| Party | Candidate | Votes | % | ±% | Expenditures | |||
| Conservative | Peter Goldring | 25,086 | 50.13 | +4.11 | – | |||
| Liberal | Nicole Martel | 13,088 | 26.16 | -6.27 | – | |||
| New Democratic | Arlene Chapman | 9,243 | 18.47 | +3.76 | – | |||
| Green | Trey Capnerhurst | 2,623 | 5.24 | -0.38 | – | |||
| Total valid votes | 50,040 | 100.00 | – | |||||
| Total rejected ballots | 186 | 0.37 | -0.09 | |||||
| Turnout | 50,226 | 55.3 | +3.7 | |||||
| 2004 Canadian federal election | ||||||||
|---|---|---|---|---|---|---|---|---|
| Party | Candidate | Votes | % | ±% | Expenditures | |||
| Conservative | Peter Goldring | 20,224 | 46.02 | -1.78 | $54,935 | |||
| Liberal | John Bethel | 14,250 | 32.43 | -1.77 | – | |||
| New Democratic | Janina Strudwick | 6,464 | 14.71 | -2.73 | $11,840 | |||
| Green | Harlan Light | 2,471 | 5.62 | – | – | |||
| Christian Heritage | Ed Spronk | 538 | 1.22 | – | $14,998 | |||
| Total valid votes | 43,947 | 100.00 | – | |||||
| Total rejected ballots | 203 | 0.46 | +0.09 | |||||
| Turnout | 44,150 | 51.6 | -1.8 | |||||
Edmonton Centre-East, 2000
| 2000 Canadian federal election | ||||||||
|---|---|---|---|---|---|---|---|---|
| Party | Candidate | Votes | % | ±% | Expenditures | |||
| Alliance | Peter Goldring | 17,768 | 42.43 | -2.14 | $58,345 | |||
| Liberal | Sue Olsen | 14,323 | 34.20 | -0.38 | $57,858 | |||
| New Democratic | Ray Martin | 7,304 | 17.44 | +5.65 | $56,287 | |||
| Progressive Conservative | Kevin Mahfouz | 2,252 | 5.37 | -1.93 | $1,688 | |||
| Communist | Naomi Rankin | 222 | 0.53 | – | $238 | |||
| Total valid votes | 41,869 | 100.00 | – | |||||
| Total rejected ballots | 156 | 0.37 | +0.15 | |||||
| Turnout | 42,025 | 53.42 | +1.73 | |||||
Note: Canadian Alliance vote is compared to the Reform vote in 1997.
Edmonton East, 1997
| 1997 Canadian federal election | ||||||||
|---|---|---|---|---|---|---|---|---|
| Party | Candidate | Votes | % | ±% | Expenditures | |||
| Reform | Peter Goldring | 15,475 | 44.57 | +12.14 | $53,263 | |||
| Liberal | Judy Bethel | 12,005 | 34.58 | +1.59 | $32,152 | |||
| New Democratic | Hana Razga | 4,096 | 11.79 | -10.28 | $14,574 | |||
| Progressive Conservative | Carla Barkley | 2,535 | 7.30 | -0.08 | $8,948 | |||
| Christian Heritage | John Ludwig | 287 | 0.82 | +0.16 | $5,063 | |||
| Green | Ed Schell | 211 | 0.60 | +0.13 | – | |||
| Natural Law | Geoff Toane | 107 | 0.30 | -0.29 | – | |||
| Total valid votes | 34,716 | 100.00 | – | |||||
| Total rejected ballots | 177 | 0.22 | – | |||||
| Turnout | 34,793 | 51.69 | – | |||||
| 1993 Canadian federal election | ||||||||
|---|---|---|---|---|---|---|---|---|
| Party | Candidate | Votes | % | ±% | ||||
| Liberal | Judy Bethel | 11,949 | 32.99 | +14.80 | ||||
| Reform | Linda Robertson | 11,746 | 32.43 | +28.04 | ||||
| New Democratic | Ross Harvey | 7,994 | 22.07 | -16.13 | ||||
| Progressive Conservative | Kevin Kovacs | 2,674 | 7.38 | -29.15 | ||||
| National | Jim Musson | 1,105 | 3.05 | |||||
| Christian Heritage | Cor Labots | 239 | 0.66 | -1.37 | ||||
| Natural Law | Paula Johnsen | 213 | 0.59 | |||||
| Green | Ernst Eder | 170 | 0.47 | |||||
| Canada Party | Peter Kiriaka | 80 | 0.22 | |||||
| Independent | James Jacques | 51 | 0.14 | |||||
| Total valid votes | 36,221 | 100.00 | ||||||
| 1988 Canadian federal election | ||||||||
|---|---|---|---|---|---|---|---|---|
| Party | Candidate | Votes | % | ±% | ||||
| New Democratic | Ross Harvey | 15,051 | 38.20 | +15.14 | ||||
| Progressive Conservative | William Lesick | 14,394 | 36.53 | -11.95 | ||||
| Liberal | Peggy Blair | 7,167 | 18.19 | +0.14 | ||||
| Reform | Elaine Sim | 1,728 | 4.39 | |||||
| Christian Heritage | Ron Romanow | 798 | 2.03 | |||||
| Communist | Naomi Rankin | 123 | 0.31 | -0.07 | ||||
| Independent | Bernie Sawatzky | 88 | 0.22 | |||||
| Confederation of Regions | Robert J. Yanew | 53 | 0.13 | -0.59 | ||||
| Total valid votes | 39,402 | 100.00 | ||||||
| 1984 Canadian federal election | ||||||||
|---|---|---|---|---|---|---|---|---|
| Party | Candidate | Votes | % | ±% | ||||
| Progressive Conservative | William Lesick | 16,119 | 48.48 | -5.41 | ||||
| New Democratic | Muriel Stanley-Venne | 7,668 | 23.06 | +5.77 | ||||
| Liberal | Al Iafolla | 6,002 | 18.05 | -9.57 | ||||
| Independent | William Yurko | 2,857 | 8.59 | |||||
| Confederation of Regions | Clifford Major | 241 | 0.72 | |||||
| Green | Reg Silvester | 233 | 0.70 | |||||
| Communist | David Wallis | 128 | 0.38 | +0.08 | ||||
| Total valid votes | 33,248 | 100.00 | ||||||
| 1980 Canadian federal election | ||||||||
|---|---|---|---|---|---|---|---|---|
| Party | Candidate | Votes | % | ±% | ||||
| Progressive Conservative | William Yurko | 14,840 | 53.89 | -2.16 | ||||
| Liberal | Gerry Lorente | 7,606 | 27.62 | -0.12 | ||||
| New Democratic | Jo Evans | 4,763 | 17.30 | +1.85 | ||||
| Social Credit | John Tymchyshyn | 187 | 0.68 | |||||
| Communist | Kimball Cariou | 84 | 0.31 | -0.20 | ||||
| Marxist–Leninist | Peggy Morton | 57 | 0.21 | -0.04 | ||||
| Total valid votes | 27,537 | 100.00 | ||||||
| 1979 Canadian federal election | ||||||||
|---|---|---|---|---|---|---|---|---|
| Party | Candidate | Votes | % | ±% | ||||
| Progressive Conservative | William Yurko | 18,699 | 56.06 | +4.20 | ||||
| Liberal | Jerry Paschen | 9,253 | 27.74 | -3.74 | ||||
| New Democratic | Lynn Fogwill | 5,154 | 15.45 | +2.96 | ||||
| Communist | Kimball Cariou | 168 | 0.50 | +0.01 | ||||
| Marxist–Leninist | Peggy Morton | 84 | 0.25 | +0.11 | ||||
| Total valid votes | 33,358 | 100.00 | ||||||
| 1974 Canadian federal election | ||||||||
|---|---|---|---|---|---|---|---|---|
| Party | Candidate | Votes | % | ±% | ||||
| Progressive Conservative | William Skoreyko | 18,321 | 51.86 | +0.28 | ||||
| Liberal | Una Maclean | 11,122 | 31.48 | +2.21 | ||||
| New Democratic | Bill Kobluk | 4,413 | 12.49 | -3.35 | ||||
| Social Credit | Martin Hattersley | 1,119 | 3.17 | +0.39 | ||||
| Communist | Bill Tuomi | 176 | 0.50 | -0.03 | ||||
| Independent | Dick Nimmons | 128 | 0.36 | |||||
| Marxist–Leninist | Peggy Morton | 49 | 0.14 | |||||
| Total valid votes | 35,328 | 100.00 | ||||||
| 1972 Canadian federal election | ||||||||
|---|---|---|---|---|---|---|---|---|
| Party | Candidate | Votes | % | ±% | ||||
| Progressive Conservative | William Skoreyko | 21,137 | 51.58 | +5.49 | ||||
| Liberal | Una MacLean-Evans | 11,997 | 29.27 | -7.97 | ||||
| New Democratic | Ashley Pachal | 6,493 | 15.84 | +0.37 | ||||
| Social Credit | Nick D. Senyk | 1,139 | 2.78 | |||||
| Independent | Bill Tuomi | 217 | 0.53 | -0.67 | ||||
| Total valid votes | 40,983 | 100.00 | ||||||
| 1968 Canadian federal election | ||||||||
|---|---|---|---|---|---|---|---|---|
| Party | Candidate | Votes | % | ±% | ||||
| Progressive Conservative | William Skoreyko | 15,764 | 46.09 | +1.04 | ||||
| Liberal | Pat Shewchuk | 12,739 | 37.24 | +16.61 | ||||
| New Democratic | Roy H. Jamha | 5,292 | 15.47 | +4.80 | ||||
| Communist | William R. Askin | 410 | 1.20 | -0.08 | ||||
| Total valid votes | 34,205 | 100.00 | ||||||
| 1965 Canadian federal election | ||||||||
|---|---|---|---|---|---|---|---|---|
| Party | Candidate | Votes | % | ±% | ||||
| Progressive Conservative | William Skoreyko | 13,596 | 45.05 | +3.35 | ||||
| Social Credit | Preston Manning | 6,752 | 22.37 | +0.71 | ||||
| Liberal | Nick Mosychuk | 6,228 | 20.63 | -3.77 | ||||
| New Democratic | Robert William Douglas | 3,222 | 10.67 | -0.52 | ||||
| Communist | William Tuomi | 385 | 1.28 | +0.23 | ||||
| Total valid votes | 30,183 | 100.00 | ||||||
| 1963 Canadian federal election | ||||||||
|---|---|---|---|---|---|---|---|---|
| Party | Candidate | Votes | % | ±% | ||||
| Progressive Conservative | William Skoreyko | 13,582 | 41.70 | +8.21 | ||||
| Liberal | Donald Brinton | 7,950 | 24.41 | +0.00 | ||||
| Social Credit | Lucien Maynard | 7,057 | 21.66 | -5.94 | ||||
| New Democratic | Ivor G. Dent | 3,645 | 11.19 | -3.31 | ||||
| Communist | William Tuomi | 340 | 1.04 | |||||
| Total valid votes | 32,574 | 100.00 | ||||||
| 1962 Canadian federal election | ||||||||
|---|---|---|---|---|---|---|---|---|
| Party | Candidate | Votes | % | ±% | ||||
| Progressive Conservative | William Skoreyko | 9,291 | 33.49 | -20.85 | ||||
| Social Credit | Lucien Maynard | 7,657 | 27.60 | +4.63 | ||||
| Liberal | John Decore | 6,771 | 24.41 | +8.67 | ||||
| New Democratic | Douglas Tomlinson | 4,023 | 14.50 | +10.15 | ||||
| Total valid votes | 27,742 | 100.0 | ||||||
| 1958 Canadian federal election | ||||||||
|---|---|---|---|---|---|---|---|---|
| Party | Candidate | Votes | % | ±% | ||||
| Progressive Conservative | William Skoreyko | 15,236 | 54.34 | +40.00 | ||||
| Social Credit | Ambrose Holowach | 6,441 | 22.97 | -17.09 | ||||
| Liberal | John David Bracco | 4,413 | 15.74 | -23.29 | ||||
| Co-operative Commonwealth | Peter Uganecz | 1,220 | 4.35 | -2.21 | ||||
| Labor–Progressive | William Tuomi | 473 | 1.69 | |||||
| Independent PC | Aubrey Allen Smith | 253 | 0.90 | |||||
| Total valid votes | 28,036 | 100.00 | ||||||
| 1957 Canadian federal election | ||||||||
|---|---|---|---|---|---|---|---|---|
| Party | Candidate | Votes | % | ±% | ||||
| Social Credit | Ambrose Holowach | 10,967 | 40.06 | -0.42 | ||||
| Liberal | William Hawrelak | 10,683 | 39.03 | +4.19 | ||||
| Progressive Conservative | John Bowie-Reed | 3,927 | 14.35 | +2.15 | ||||
| Co-operative Commonwealth | Robert Atkin | 1,797 | 6.56 | -1.74 | ||||
| Total valid votes | 27,374 | 100.00 | ||||||
| 1953 Canadian federal election | ||||||||
|---|---|---|---|---|---|---|---|---|
| Party | Candidate | Votes | % | ±% | ||||
| Social Credit | Ambrose Holowach | 8,802 | 40.48 | +14.21 | ||||
| Liberal | Albert Frederick Macdonald | 7,574 | 34.83 | -1.30 | ||||
| Progressive Conservative | Albert John Hidson | 2,651 | 12.19 | -0.38 | ||||
| Co-operative Commonwealth | Robert Atkin | 1,805 | 8.30 | -1.46 | ||||
| Labor–Progressive | William Tuomi | 637 | 2.93 | -1.13 | ||||
| Independent | Maurice Dudley McArthur | 275 | 1.26 | |||||
| Total valid votes | 21,744 | 100.00 | ||||||
| 1949 Canadian federal election | ||||||||
|---|---|---|---|---|---|---|---|---|
| Party | Candidate | Votes | % | ±% | ||||
| Liberal | Albert Frederick Macdonald | 10,964 | 36.13 | +14.62 | ||||
| Social Credit | Ambrose Holowach | 7,972 | 26.27 | -6.99 | ||||
| Progressive Conservative | John Hector Thorogood | 3,816 | 12.58 | -4.09 | ||||
| Independent SC | Patrick Harvey Ashby | 3,400 | 11.20 | |||||
| Co-operative Commonwealth | Hugh John McKim Ross | 2,961 | 9.76 | -13.86 | ||||
| Labor–Progressive | Bernard Rudolf Swankey | 1,232 | 4.06 | -0.89 | ||||
| Total valid votes | 30,345 | 100.00 | ||||||
| 1945 Canadian federal election | ||||||||
|---|---|---|---|---|---|---|---|---|
| Party | Candidate | Votes | % | ±% | ||||
| Social Credit | Patrick Harvey Ashby | 8,214 | 33.26 | +3.50 | ||||
| Co-operative Commonwealth | Harry Dean Ainlay | 5,833 | 23.62 | |||||
| Liberal | Cora Taylor Casselman | 5,313 | 21.51 | -30.27 | ||||
| Progressive Conservative | Henry B. Jamieson | 4,115 | 16.66 | |||||
| Labor–Progressive | Jan Lakeman | 1,223 | 4.95 | |||||
| Total valid votes | 24,698 | 100.00 | ||||||
| Canadian federal by-election, 2 June 1941 | ||||||||
|---|---|---|---|---|---|---|---|---|
| Party | Candidate | Votes | % | ±% | ||||
| On Mr. Casselman's death, 20 March 1941 | ||||||||
| Liberal | Cora Taylor Casselman | 7,306 | 51.78 | +8.11 | ||||
| Social Credit | Orvis A. Kennedy | 4,199 | 29.76 | -5.76 | ||||
| Communist | A. A. MacLeod[3] | 2,605 | 18.46 | +7.23 | ||||
| Total valid votes | 14,110 | 100.00 | ||||||
Note: Social Credit vote is compared to New Democracy vote in 1940 election.
| 1940 Canadian federal election | ||||||||
|---|---|---|---|---|---|---|---|---|
| Party | Candidate | Votes | % | ±% | ||||
| Liberal | Frederick Clayton Casselman | 8,948 | 43.67 | +4.63 | ||||
| New Democracy | Orvis A. Kennedy | 7,279 | 35.52 | -13.29 | ||||
| National Government | Sidney J. Gee | 2,302 | 11.23 | |||||
| Co-operative Commonwealth | Clifford E. Lee | 1,962 | 9.57 | |||||
| Total valid votes | 20,491 | 100.00 | ||||||
| Canadian federal by-election, 21 March 1938 | ||||||||
|---|---|---|---|---|---|---|---|---|
| Party | Candidate | Votes | % | ±% | ||||
| On Mr. Hall's death, 26 January 1938 | ||||||||
| Social Credit | Orvis A. Kennedy | 9,904 | 48.81 | +11.19 | ||||
| Liberal | Robert Colin Marshall | 7,920 | 39.03 | +8.88 | ||||
| Unknown | Walter Clevely | 2,466 | 12.15 | |||||
| Total valid votes | 20,290 | 100.00 | ||||||
| 1935 Canadian federal election | ||||||||
|---|---|---|---|---|---|---|---|---|
| Party | Candidate | Votes | % | ±% | ||||
| Social Credit | William Samuel Hall | 5,721 | 35.29 | |||||
| Liberal | George Brown McLeod | 4,889 | 30.16 | -2.96 | ||||
| Conservative | Peter Edwin Bowen | 2,827 | 17.44 | -27.40 | ||||
| Co-operative Commonwealth | Elmer Ernest Roper | 1,726 | 10.65 | |||||
| Communist | Oliver C. Doolan | 671 | 4.14 | |||||
| Social Credit | Raymond Charles Ghostley | 378 | 2.33 | |||||
| Total valid votes | 16,212 | 100.00 | ||||||
| 1930 Canadian federal election | ||||||||
|---|---|---|---|---|---|---|---|---|
| Party | Candidate | Votes | % | ±% | ||||
| Conservative | Ambrose Bury | 6,662 | 44.83 | +1.84 | ||||
| Liberal | Kenneth Alexander Blatchford | 4,921 | 33.12 | -11.31 | ||||
| Farmer Labour | George Latham | 2,767 | 18.62 | |||||
| Farmer Labour | Jan Lakeman | 509 | 3.43 | -9.15 | ||||
| Total valid votes | 14,859 | 100.00 | ||||||
| 1926 Canadian federal election | ||||||||
|---|---|---|---|---|---|---|---|---|
| Party | Candidate | Votes | % | ±% | ||||
| Liberal | Kenneth Alexander Blatchford | 5,090 | 45.55 | |||||
| Conservative | Ambrose Bury | 4,925 | 30.99 | -6.83 | ||||
| Farmer Labour | Jan Lakeman | 1,441 | 23.46 | -38.71 | ||||
| Total valid votes | 13,380 | 100.00 | ||||||
| 1925 Canadian federal election | ||||||||
|---|---|---|---|---|---|---|---|---|
| Party | Candidate | Votes | % | ±% | ||||
| Conservative | Ambrose Bury | 3,927 | 38.75 | |||||
| Liberal | Andrew Robert McLennan | 3,440 | 33.95 | +2.95 | ||||
| Farmer Labour | George Latham | 2,767 | 27.30 | -18.24 | ||||
| Total valid votes | 10,134 | 100.00 | ||||||
| 1921 Canadian federal election | ||||||||
|---|---|---|---|---|---|---|---|---|
| Party | Candidate | Votes | % | ±% | ||||
| Progressive | Donald Ferdinand Kellner | 6,094 | 45.55 | |||||
| Liberal | Joseph Clarke | 4,147 | 30.99 | -6.83 | ||||
| Conservative | Henry Arthur Mackie | 3,139 | 23.46 | -38.71 | ||||
| Total valid votes | 13,380 | 100.00 | ||||||
| 1917 Canadian federal election | ||||||||
|---|---|---|---|---|---|---|---|---|
| Party | Candidate | Votes | % | |||||
| Government (Unionist) | Henry Arthur Mackie | 6,775 | 62.17 | |||||
| Opposition (Laurier Liberals) | Alexander Esson May | 4,122 | 37.83 | |||||
| Total valid votes | 10,897 | 100.00 | ||||||
See also
- Edmonton East provincial electoral district
- List of Canadian federal electoral districts
- Alberta federal electoral districts
- Past Canadian electoral districts
References
- "(Code 48013) Census Profile". 2011 census. Statistics Canada. 2012. Retrieved 2011-03-06.
- Riding history for Edmonton East (2003 - present) from the Library of Parliament
- Riding history for Edmonton Centre-East (2000 - 2003) from the Library of Parliament
- Riding history for Edmonton East (1914 - 2000) from the Library of Parliament
- Expenditures (2008)
- Expenditures (2004) - (2000) - (1997)
- Elections Canada
- Elections Canada Edmonton East Riding Information
Notes
- Statistics Canada: 2012
- Statistics Canada: 2012
- MacLeod ran officially as a People's Movement candidate.
External links
- CBC Edmonton East Riding Profile
- Website of the Parliament of Canada
.png)
.png)