Regina—Lewvan
Regina—Lewvan is a federal riding in Saskatchewan, made up of those parts of the former Palliser and Regina—Lumsden—Lake Centre ridings within the city limits of Regina.[3]
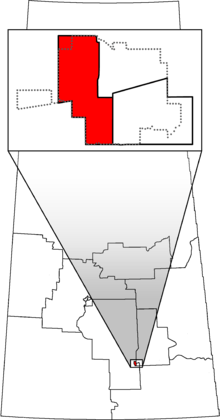 Regina—Lewvan in relation to other Saskatchewan federal electoral districts as of the 2013 Representation Order. Dotted line shows Regina city limits. | |||
| Federal electoral district | |||
| Legislature | House of Commons | ||
| MP |
Conservative | ||
| District created | 2013 | ||
| First contested | 2015 | ||
| District webpage | profile, map | ||
| Demographics | |||
| Population (2011)[1] | 79,587 | ||
| Electors (2011) | 61,879 | ||
| Area (km²)[2] | 58 | ||
| Pop. density (per km²) | 1,372.2 | ||
| Census divisions | Division No. 6 | ||
| Census subdivisions | Regina | ||
Regina—Lewvan was created in the 2012 federal electoral boundaries redistribution and is legally defined in the 2013 representation order. It was first contested in the 42nd Canadian federal election, held on 19 October 2015.[4]
Members of Parliament
This riding has elected the following Members of Parliament:
| Parliament | Years | Member | Party | |
|---|---|---|---|---|
| Regina—Lewvan Riding created from Palliser and Regina—Lumsden—Lake Centre |
||||
| 42nd | 2015–2018 | Erin Weir | New Democratic | |
| 2018–2018 | Independent | |||
| 2018–2019 | Co-operative Commonwealth | |||
| 43rd | 2019–present | Warren Steinley | Conservative | |
Election results
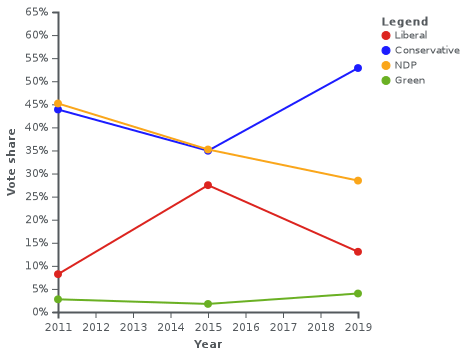
Graph of election results in Regina—Lewvan (minor parties that never got 2% of the vote or didn't run consistently are omitted)
| 2019 Canadian federal election | ||||||||
|---|---|---|---|---|---|---|---|---|
| Party | Candidate | Votes | % | ±% | Expenditures | |||
| Conservative | Warren Steinley | 26,837 | 52.86 | +17.92 | ||||
| New Democratic | Jigar Patel | 14,454 | 28.47 | -6.74 | ||||
| Liberal | Winter Fedyk | 6,625 | 13.05 | -14.43 | ||||
| Green | Naomi Hunter | 2,035 | 4.01 | +3.01 | ||||
| People's | Trevor Wowk | 564 | 1.11 | – | ||||
| Independent | Don Morgan | 198 | 0.39 | – | ||||
| National Citizens Alliance | Ian Bridges | 59 | 0.11 | – | ||||
| Total valid votes/Expense limit | 51,614 | 100.0 | ||||||
| Total rejected ballots | 312 | |||||||
| Turnout | 51,926 | 75.88 | ||||||
| Eligible voters | 68,435 | |||||||
| Conservative gain from New Democratic | Swing | +12.33 | ||||||
| Source: Elections Canada[5] Canadian Broadcasting Corporation[6] | ||||||||
| 2015 Canadian federal election | ||||||||
|---|---|---|---|---|---|---|---|---|
| Party | Candidate | Votes | % | ±% | Expenditures | |||
| New Democratic | Erin Weir | 16,843 | 35.21 | -9.97 | $92,223.66 | |||
| Conservative | Trent Fraser | 16,711 | 34.94 | -8.93 | $72,236.17 | |||
| Liberal | Louis Browne | 13,143 | 27.48 | +19.28 | $70,367.24 | |||
| Green | Tamela Friesen | 839 | 1.75 | -1.00 | $1,285.24 | |||
| Libertarian | Wojciech K. Dolata | 298 | 0.62 | – | $5,634.21 | |||
| Total valid votes/Expense limit | 47,834 | 99.62 | $198,699.60 | |||||
| Total rejected ballots | 181 | 0.38 | – | |||||
| Turnout | 48,015 | 77.64 | – | |||||
| Eligible voters | 64,325 | |||||||
| New Democratic notional hold | Swing | −0.52 | ||||||
| Source: Elections Canada[7][8] | ||||||||
| 2011 federal election redistributed results[9] | |||
|---|---|---|---|
| Party | Vote | % | |
| New Democratic | 17,400 | 45.18 | |
| Conservative | 16,894 | 43.87 | |
| Liberal | 3,157 | 8.20 | |
| Green | 1,060 | 2.75 | |
References
- Statistics Canada: 2012
- Statistics Canada: 2012
- http://www.elections.ca/res/cir/maps2/mapprov.asp?map=47007&lang=e
- Timeline for the Redistribution of Federal Electoral Districts
- "List of confirmed candidates". Elections Canada. Retrieved 4 October 2019.
- "Federal election 2019 live results". CBCNews. Retrieved 22 October 2019.
- Elections Canada – Confirmed candidates for Regina—Lewvan, 30 September 2015
- Elections Canada – Preliminary Election Expenses Limits for Candidates
- Pundits' Guide to Canadian Elections
.png)
This article is issued from Wikipedia. The text is licensed under Creative Commons - Attribution - Sharealike. Additional terms may apply for the media files.