Edmonton—Leduc
Edmonton—Leduc was a federal electoral district in Alberta, Canada, that was represented in the House of Commons of Canada from 2004 to 2015. As a result of changes to the Electoral Boundaries Readjustment Act, based on the 2011 census, the number of seats in the House of Commons of Canada increased from 308 to 338. Alberta's seat count increased from 28 to 34. The riding was redistributed into the new ridings of Edmonton Riverbend and Edmonton—Wetaskiwin.[3]
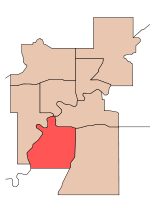
Edmonton–Leduc in relation to other federal electoral districts in Edmonton | |
| Federal electoral district | |
| Legislature | House of Commons |
| District created | 2003 |
| District abolished | 2013 |
| First contested | 2004 |
| Last contested | 2011 |
| District webpage | profile, map |
| Demographics | |
| Population (2011)[1] | 150,234 |
| Electors (2011) | 92,861 |
| Area (km²)[2] | 421.23 |
| Census divisions | Division No. 11 |
| Census subdivisions | Edmonton, Leduc, Leduc County, Devon |
Geography
The district included a southwestern portion of Edmonton, the Town of Devon and the City of Leduc and its vicinity.
History
The electoral district was created in 2003 as a result of the creation of two extra Alberta seats. It is composed from the following previous ridings: 55.5% from Edmonton Southwest, 20.9% from Edmonton—Strathcona and 23.6% from Wetaskiwin.
Member of Parliament
This riding has elected the following Member of Parliament:
| Parliament | Years | Member | Party | |
|---|---|---|---|---|
| Edmonton—Leduc Riding created from Edmonton Southwest, Edmonton—Strathcona and Wetaskiwin |
||||
| 38th | 2004–2006 | James Rajotte | Conservative | |
| 39th | 2006–2008 | |||
| 40th | 2008–2011 | |||
| 41st | 2011–2015 | |||
| Riding dissolved into Edmonton Riverbend and Edmonton—Wetaskiwin | ||||
Most Recent Member of Parliament
Its last sitting Member of Parliament was James Rajotte, a former executive assistant. He was first elected to Parliament in the 2000 election. He is a member of the Conservative Party of Canada.
Elections results
| 2011 Canadian federal election | ||||||||
|---|---|---|---|---|---|---|---|---|
| Party | Candidate | Votes | % | ±% | Expenditures | |||
| Conservative | James Rajotte | 37,778 | 63.57 | +0.37 | $75,315 | |||
| New Democratic | Artem Medvedev | 11,488 | 19.33 | +7.91 | $14,916 | |||
| Liberal | Richard Peter Fahlman | 7,270 | 12.23 | -5.36 | $22,157 | |||
| Green | Valerie Kennedy | 2,896 | 4.87 | -2.90 | $8,166 | |||
| Total valid votes/Expense limit | 59,432 | 100.00 | – | |||||
| Total rejected ballots | 149 | 0.25 | +0.03 | |||||
| Turnout | 59,581 | 59.62 | +2.98 | |||||
| Eligible voters | 99,942 | – | – | |||||
| 2008 Canadian federal election | ||||||||
|---|---|---|---|---|---|---|---|---|
| Party | Candidate | Votes | % | ±% | Expenditures | |||
| Conservative | James Rajotte | 33,174 | 63.20 | +2.67 | $81,190 | |||
| Liberal | Donna Lynn Smith | 9,234 | 17.59 | -1.87 | $29,456 | |||
| New Democratic | Hana Razga | 5,994 | 11.42 | -2.36 | $15,390 | |||
| Green | Valerie Kennedy | 4,081 | 7.77 | +1.53 | $1,154 | |||
| Total valid votes/Expense limit | 52,483 | 100.00 | $92,972 | |||||
| Total rejected ballots | 118 | 0.22 | ||||||
| Turnout | 52,601 | 56.64 | ||||||
| 2006 Canadian federal election | ||||||||
|---|---|---|---|---|---|---|---|---|
| Party | Candidate | Votes | % | ±% | ||||
| Conservative | James Rajotte | 33,764 | 60.53 | +5.49 | ||||
| Liberal | Jim Jacuta | 10,856 | 19.46 | -9.85 | ||||
| New Democratic | Martin Rybiak | 7,685 | 13.78 | +4.37 | ||||
| Green | Ben Morrison Pettit | 3,479 | 6.24 | +0.02 | ||||
| Total valid votes | 55,784 | 100.00 | ||||||
| 2004 Canadian federal election | ||||||||
|---|---|---|---|---|---|---|---|---|
| Party | Candidate | Votes | % | ±% | Expenditures | |||
| Conservative | James Rajotte | 26,791 | 55.04 | – | $54,847 | |||
| Liberal | Bruce King | 14,269 | 29.31 | – | $46,445 | |||
| New Democratic | Doug McLachlan | 4,581 | 9.41 | – | $7,563 | |||
| Green | Bruce Sinclair | 3,029 | 6.22 | – | $107 | |||
| Total valid votes | 48,670 | 100.00 | ||||||
| Total rejected ballots | 111 | 0.23 | ||||||
| Turnout | 48,781 | 65.08 | ||||||
See also
- List of Canadian federal electoral districts
- Alberta federal electoral districts
- Past Canadian electoral districts
References
- "(Code 48014) Census Profile". 2011 census. Statistics Canada. 2012. Retrieved 2011-03-06.
Notes
External links
- Riding history for Edmonton—Leduc from the Library of Parliament
- Expenditures - 2008
- Expenditures - 2004
- Website of the Parliament of Canada
.png)
.png)